

 X
 Discord
 Instagram
 YouTube
 ChatGPT
Strategy Dashboard
A compact on-chart dashboard reports the numbers that matter while the strategy runs.
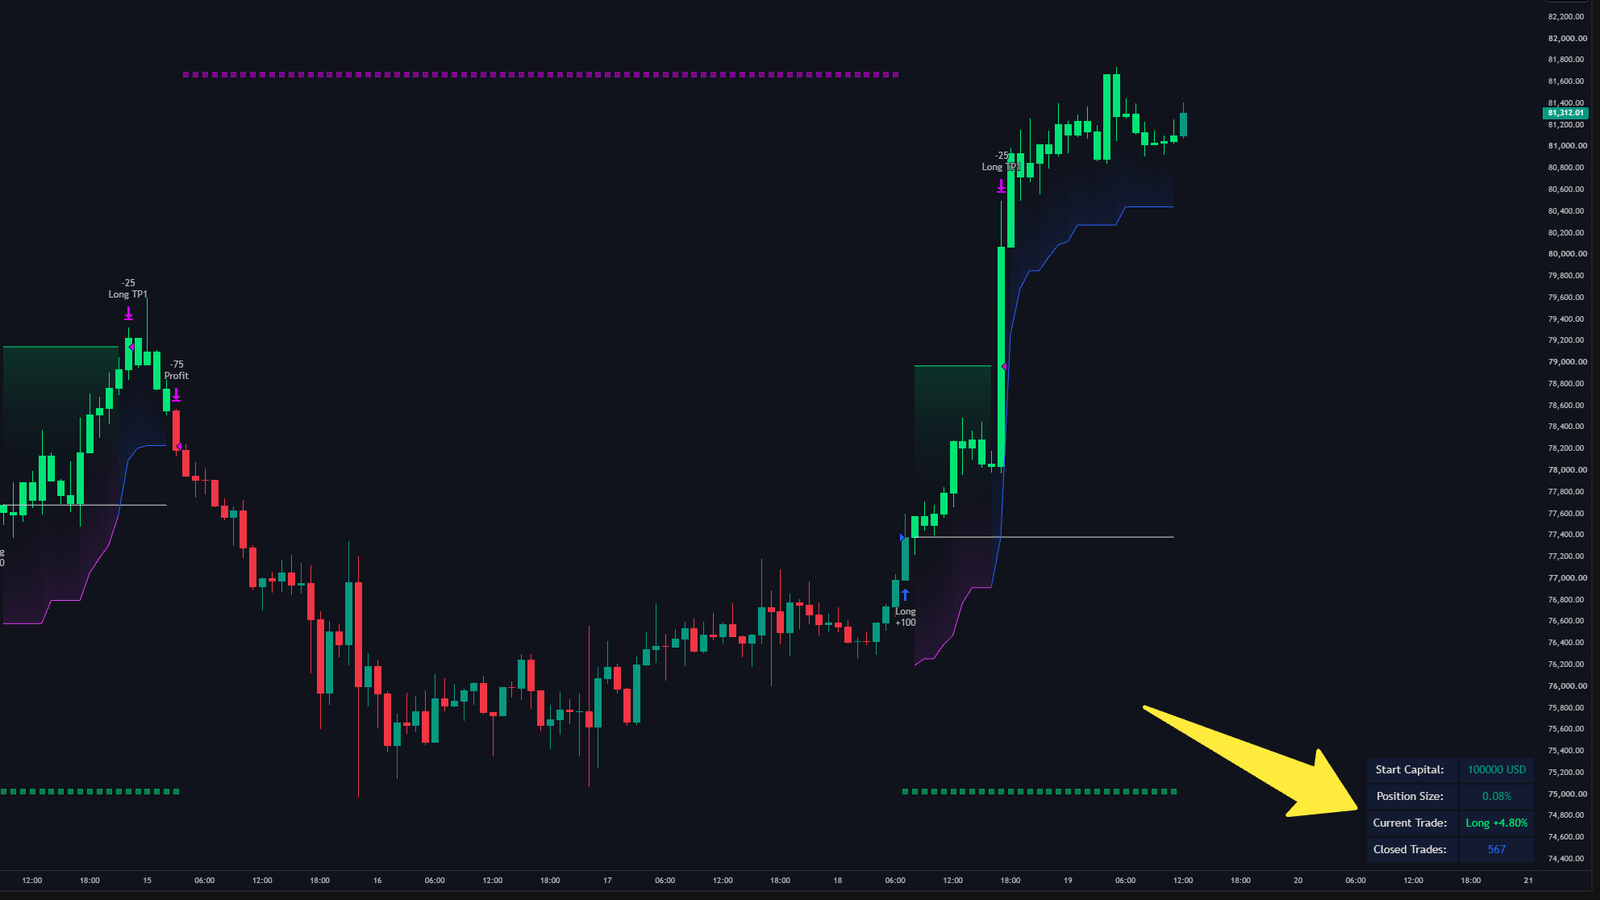
What it shows
| Metric | Description |
|---|---|
| Start capital | Initial account balance used in the simulation. |
| Position size | Percentage of capital allocated per trade, recalculated as targets are hit. |
| Current trade | Active direction (long or short) and the real-time return from entry. |
| Closed trades | Number of completed positions, which is the sample size behind any result. |
Reading it during a backtest
The two numbers to watch before judging a strategy are closed trades and position size.
A result built on a handful of closed trades is noise, no matter how good the equity curve looks. And a position size that drifts upwards as take profits are hit means the later trades in the sample were taken with a different risk than the first ones — which changes what the result actually represents.
Settings
| Settings | Description |
|---|---|
| Dashboard | Show or hide the on-chart panel. |
| Start capital | Initial balance for the simulation. |
| Position size | Percentage of capital allocated per trade. |
| Position | Where the dashboard is drawn on the chart. |
