

 X
 Discord
 Instagram
 YouTube
 ChatGPT
Nautilus Map
The Nautilus Map feature divides the oscillator into daily sections using vertical lines, providing a clear structure for analyzing price action on a day-by-day basis.
This tool is particularly useful for day traders, as it helps them pinpoint daily momentum trends and shifts, making it easier to spot opportunities and evaluate market behavior within specific trading sessions.
The Nautilus Map feature pairs seamlessly with the 10X Analysis by segmenting the oscillator into daily sections while highlighting exceptional trading days.
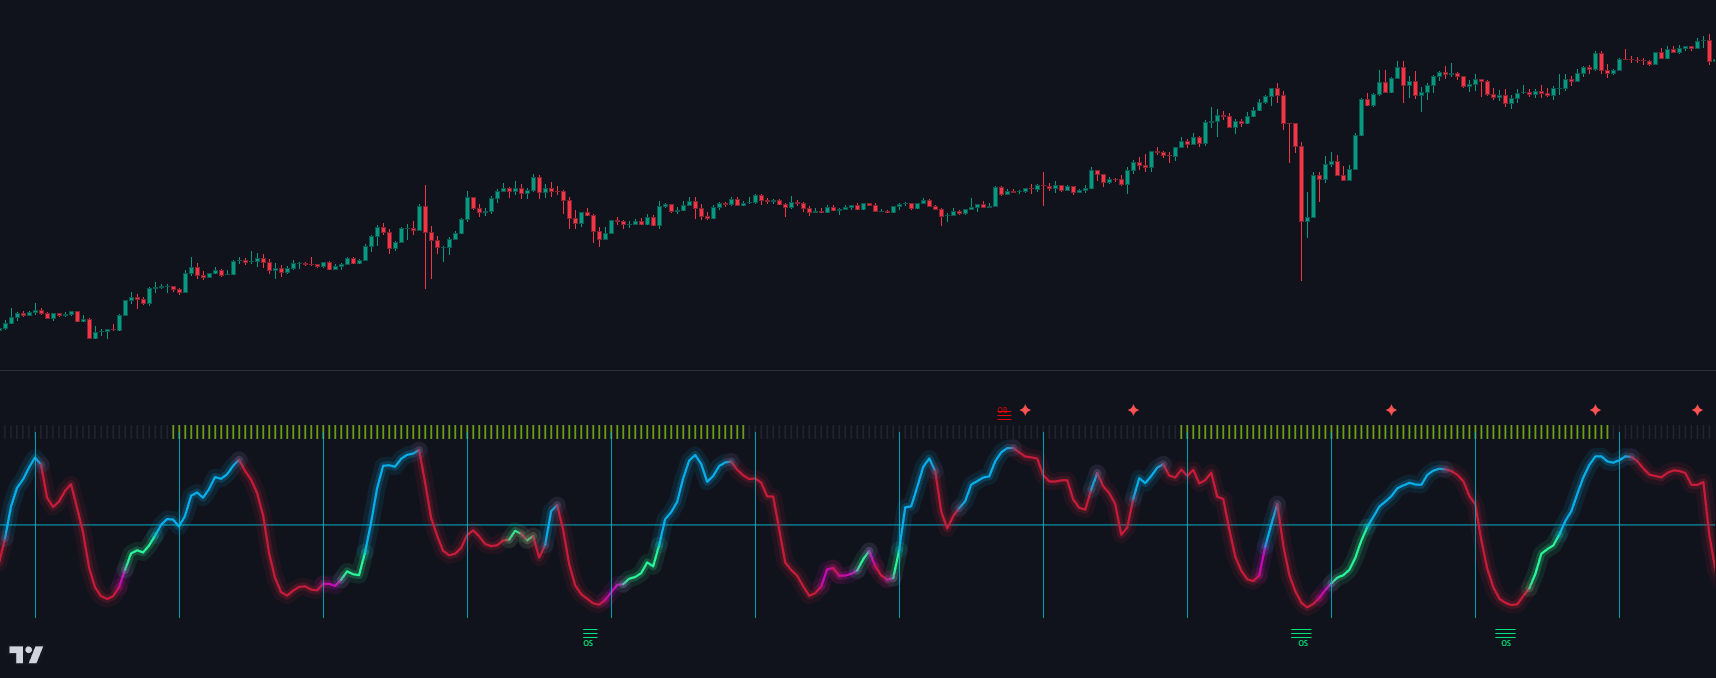
Together, these tools provide a structured and insightful view of market momentum, allowing traders to spot key activity shifts within defined timeframes.
This synergy is particularly useful for identifying trends and validating potential opportunities in high-activity periods.
