
 X
X Facebook
 Discord
 Instagram
 YouTube
 ChatGPT
RSI Signals
The RSI Signals module detects momentum reversals that occur inside overbought or oversold regions.
It’s built to identify when the market transitions from exhaustion to recovery (bullish) or from strength to weakness (bearish).
Each signal is timed and filtered to ensure only high-quality reversals are displayed — removing noise from typical RSI crossovers.
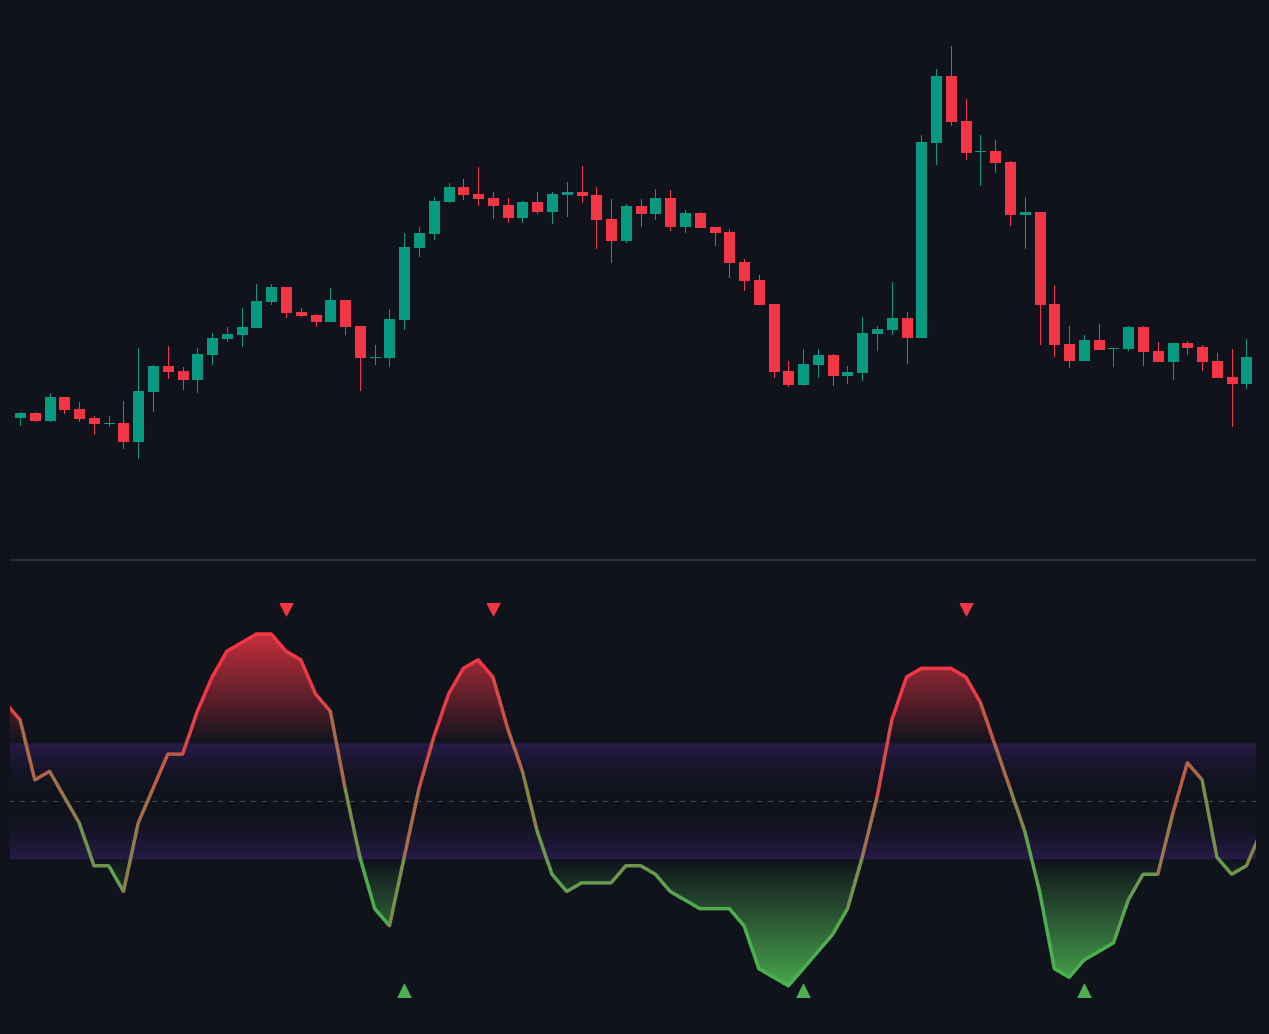
RSI Reversal Signals
This system tracks RSI’s behavior near its extreme zones and looks for confirmation that momentum is shifting in the opposite direction.
Each RSI reversal is clearly shown both inside the RSI pane and optionally on the main price chart.
- In RSI Pane:
- Green ▲ marker — Bullish reversal (from oversold zone).
- Red ▼ marker — Bearish reversal (from overbought zone).
- On Chart (optional):
The same arrows can be shown on the main chart
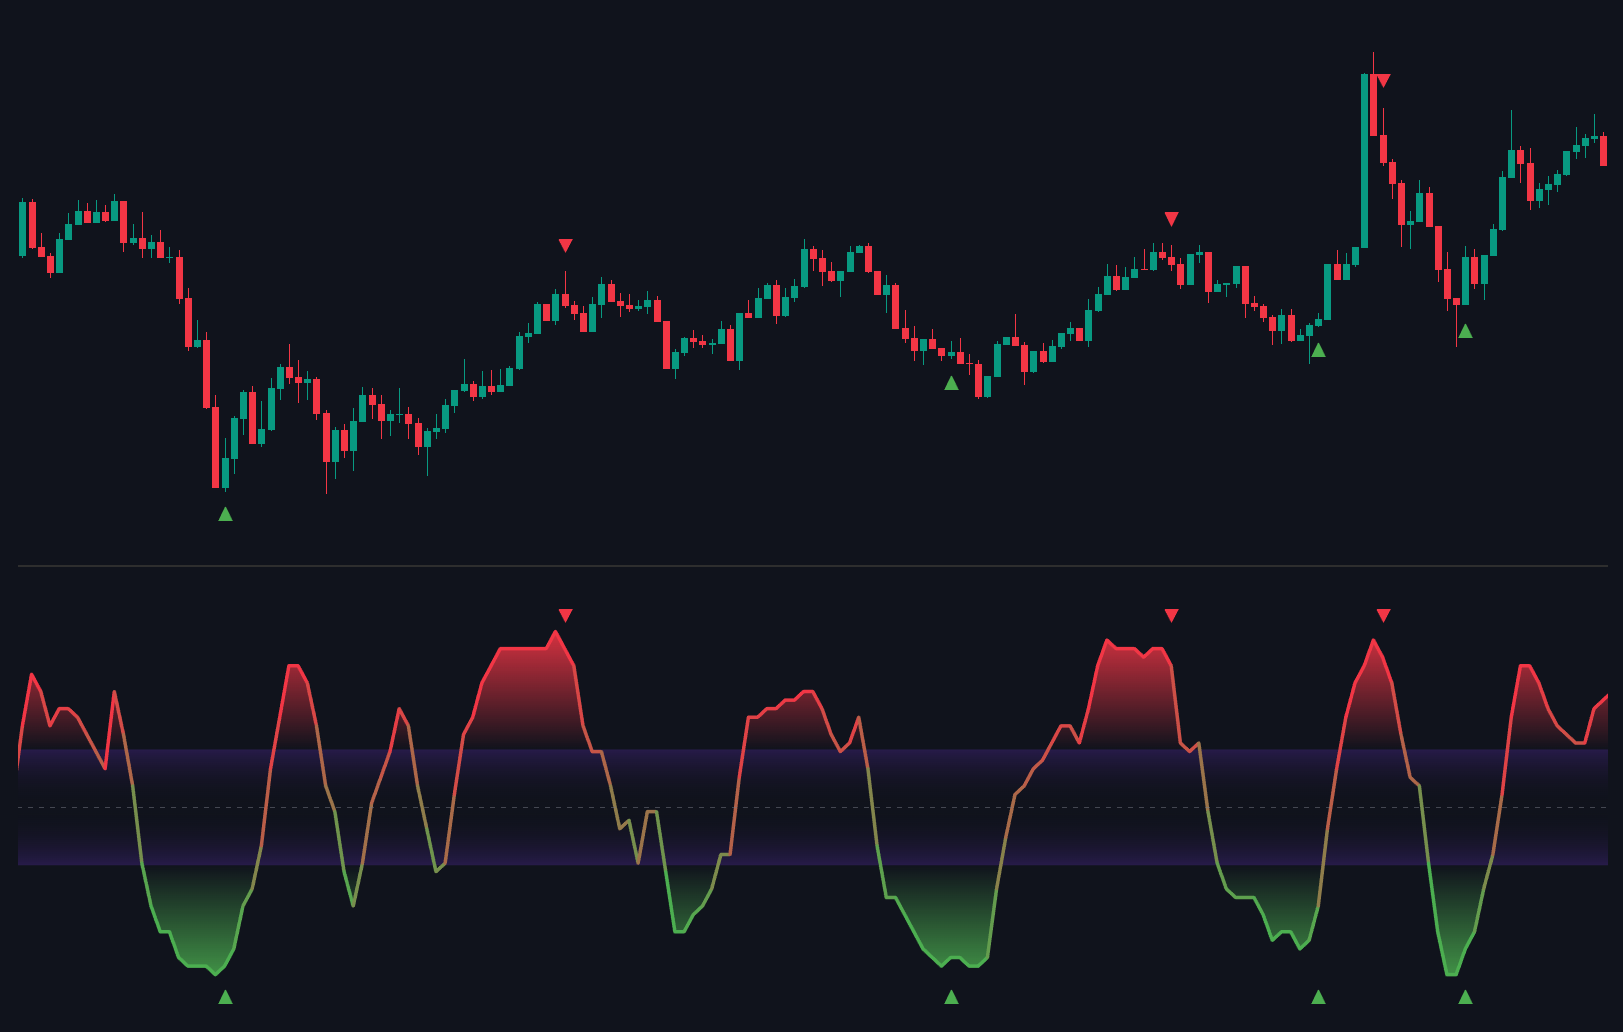
This gives a clear connection between RSI reversals and corresponding price action moves.
Deviation Mode (+1 / +2)
When enabled, Deviation Mode extends each RSI signal with dynamic follow-through levels labeled +1 and +2.
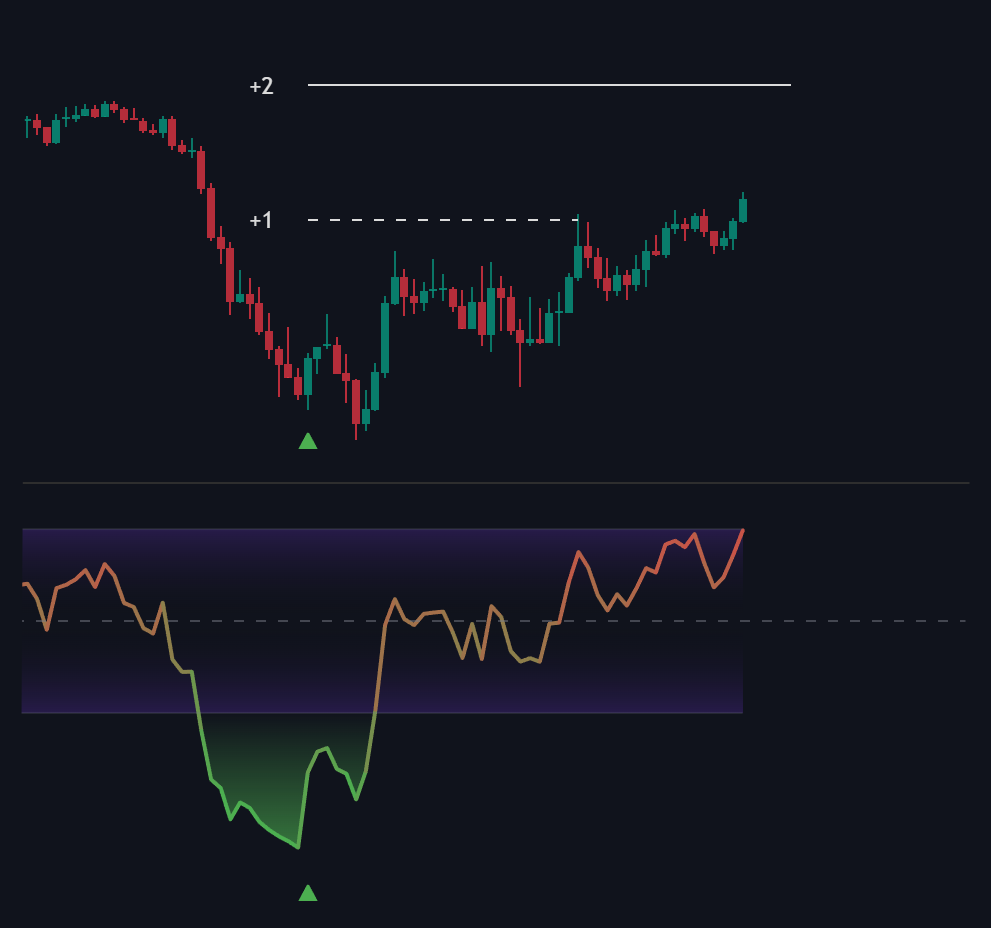
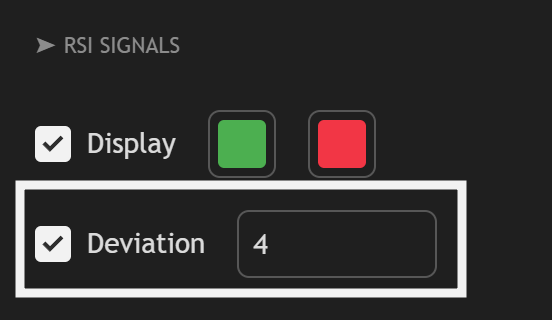
These represent progressive momentum retests measured by volatility distance from the signal candle.
- +1 Cross: The first expansion move confirming early continuation.
- +2 Cross: The second stage showing stronger directional conviction.
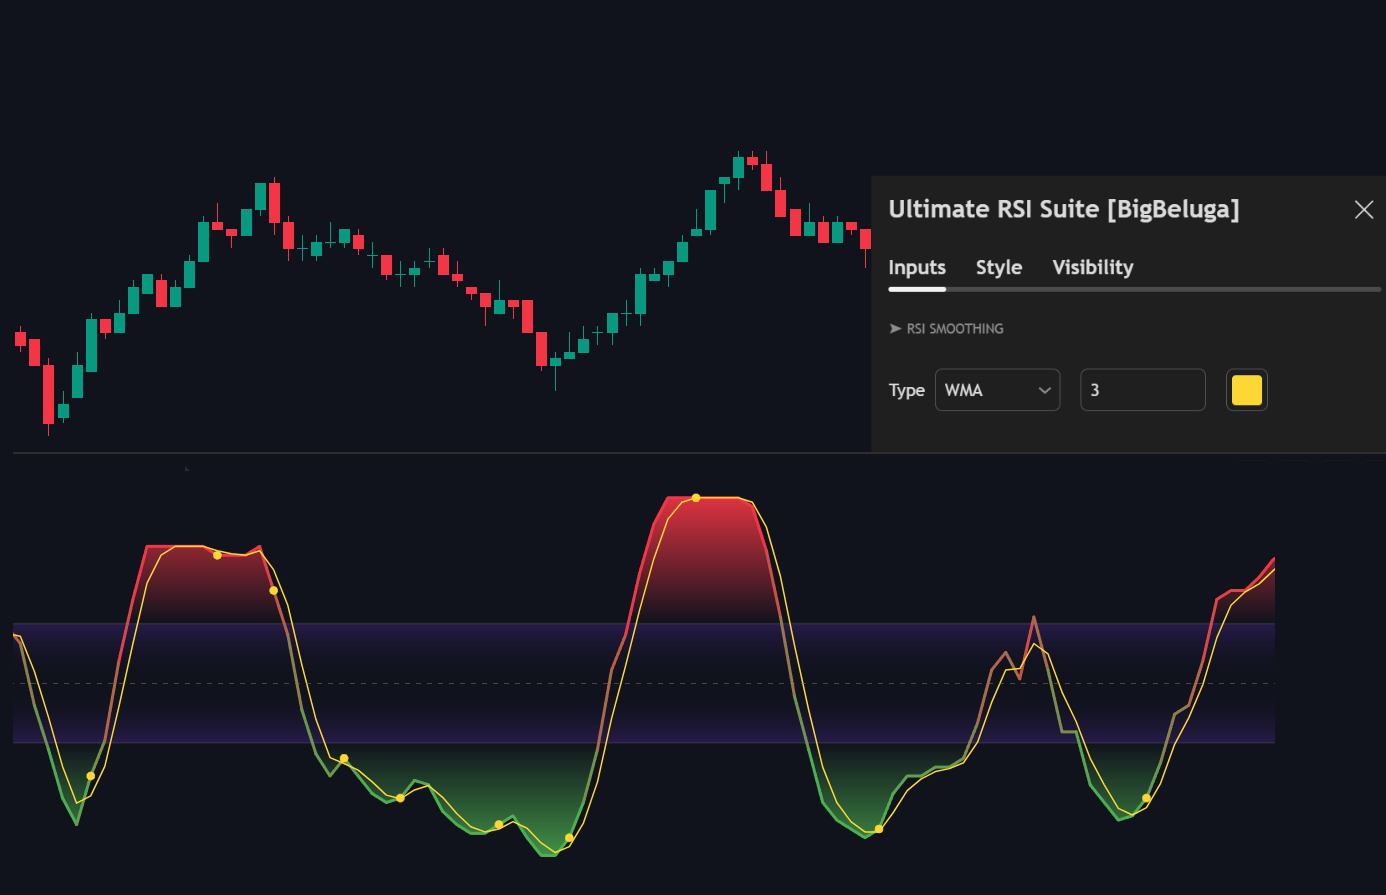
RSI Crossover Signals (Yellow Dots)
The yellow dots on the indicator serve as momentum execution signals. They are strictly triggered by a crossover between the RSI Line and its Signal Line (Moving Average), but only when momentum moves outside of the central purple neutral zone.
To see the yellow dot crossover signals on your oscillator, you must first enable the signal line in the indicator settings:
| Dot Location | Market Zone | Momentum Direction | Action |
|---|---|---|---|
| Above Purple Band (Red Zone) | Overbought | Turning Downward | Look to Sell / Take Profit |
| Below Purple Band (Green Zone) | Oversold | Turning Upward | Look to Buy / Accumulate |
