
 X
X Facebook
 Discord
 Instagram
 YouTube
 ChatGPT
RSI Channel
The RSI Channel module adds dynamic volatility-based envelopes around RSI values.
It transforms RSI from a simple oscillator into a structured momentum framework, making it easier to detect overextensions, compression zones, and breakout conditions.
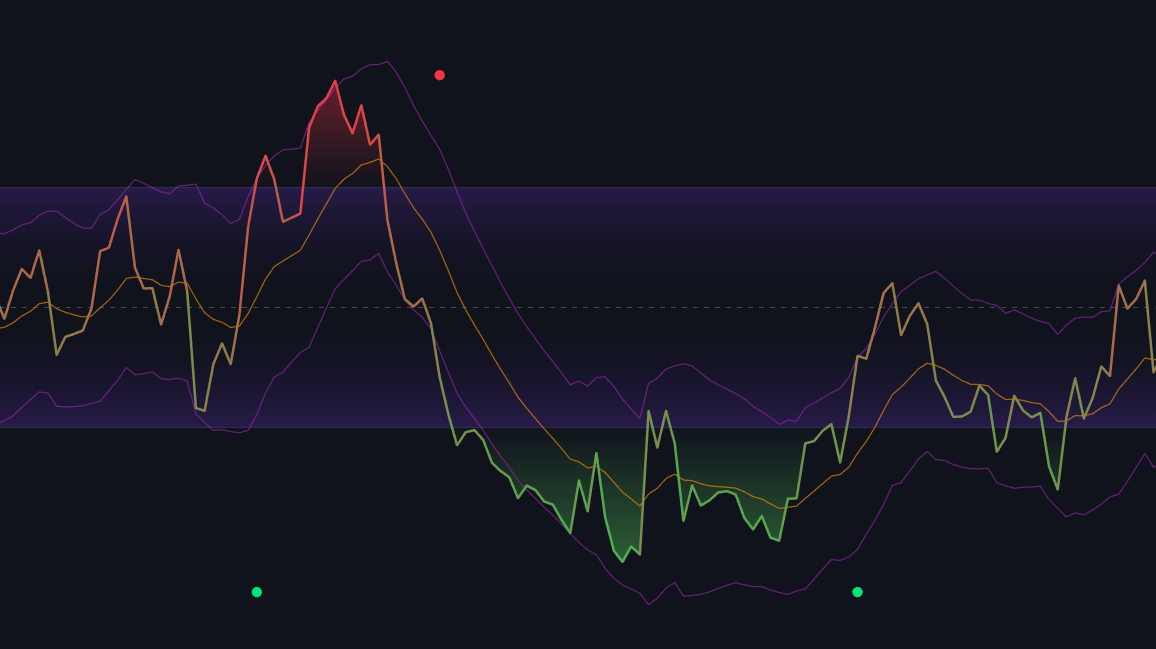
Three types of channels are available — Bollinger Bands, Keltner, and Donchian — each offering a unique way of analysing RSI volatility and breakout behavior.
Channel Types
The RSI Channel supports multiple models for volatility measurement.
Only one channel type can be active at a time, and each has its own logic for upper, lower, and baseline construction.
Bollinger Bands
Built around a moving average of RSI and its standard deviation. Expands and contracts dynamically with volatility. Highlights momentum “squeezes” where RSI is about to expand again.

Ideal for detecting when RSI leaves tight ranges into new momentum bursts.
Keltner Channel
Based on RSI’s exponential moving average (EMA) and Volatility-derived range. Reacts more smoothly than Bollinger Bands, filtering sudden volatility spikes.
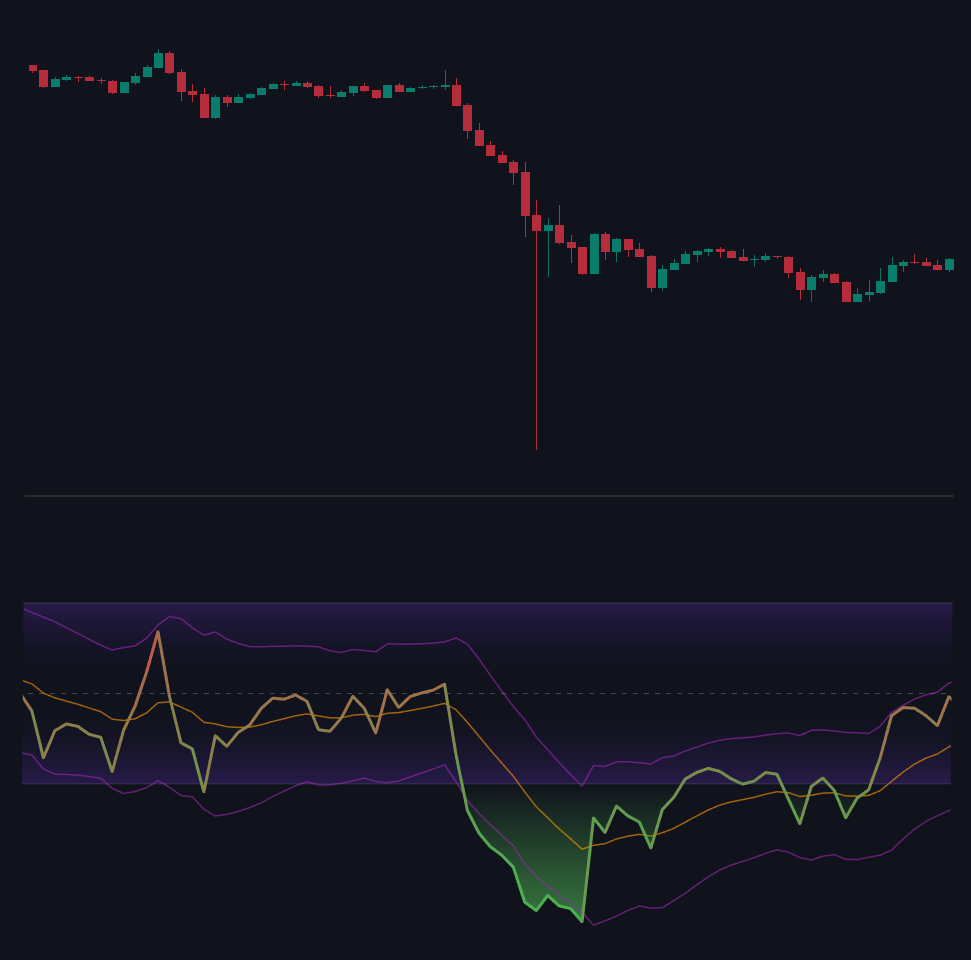
The upper and lower bands indicate where RSI is stretching beyond its average range. Suitable for trend-following systems that rely on steady directional strength.
Donchian Channel
Uses the highest and lowest RSI values within a set length. Excellent for identifying breakout boundaries of RSI consolidation zones. When RSI exceeds these extremes, it often aligns with volatility breakouts in price action.
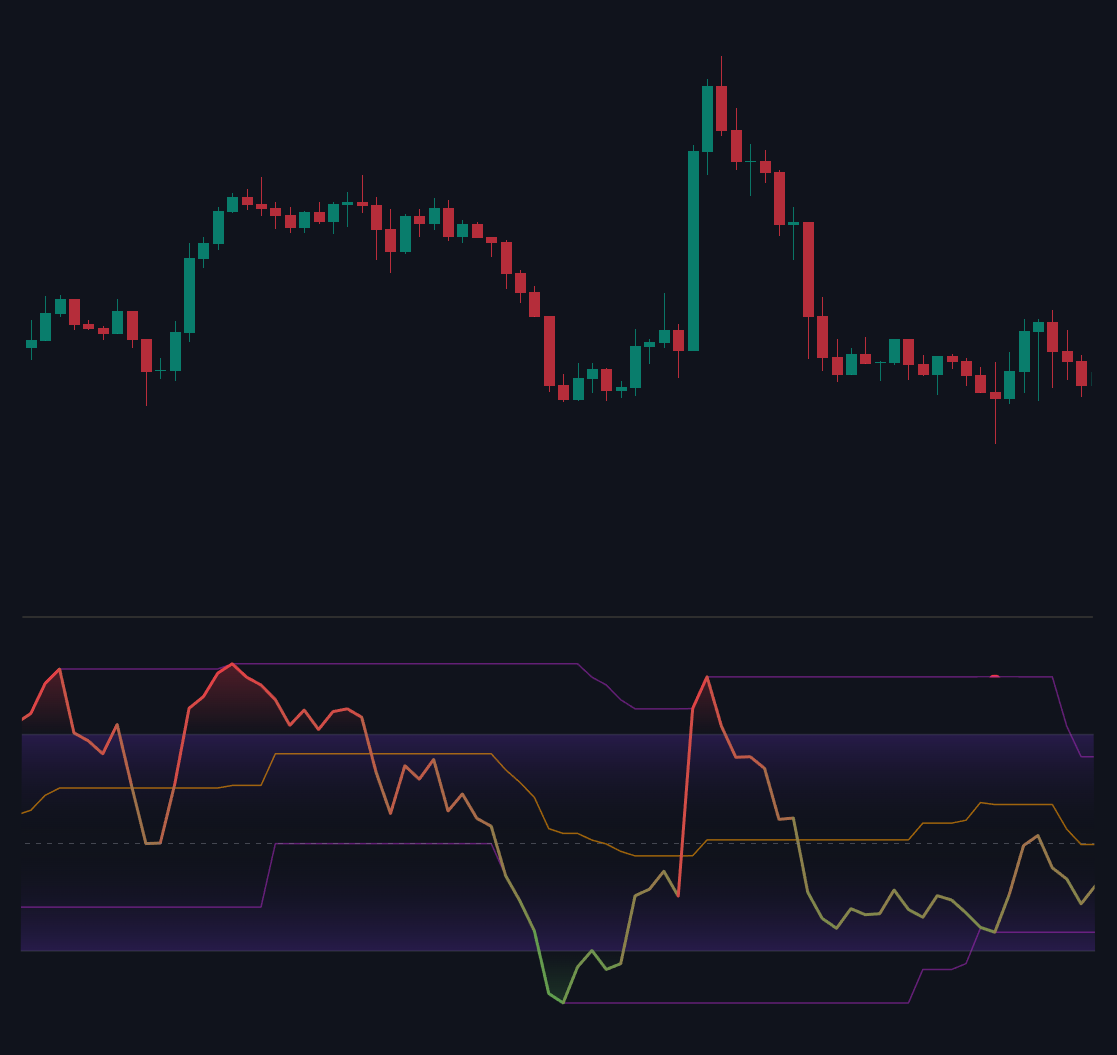
Ideal for breakout traders or momentum scalpers.
Channel Break Detection
The module tracks real-time RSI movements relative to the upper and lower channel boundaries.
Breakouts through these levels generate visual signals and optional alerts.
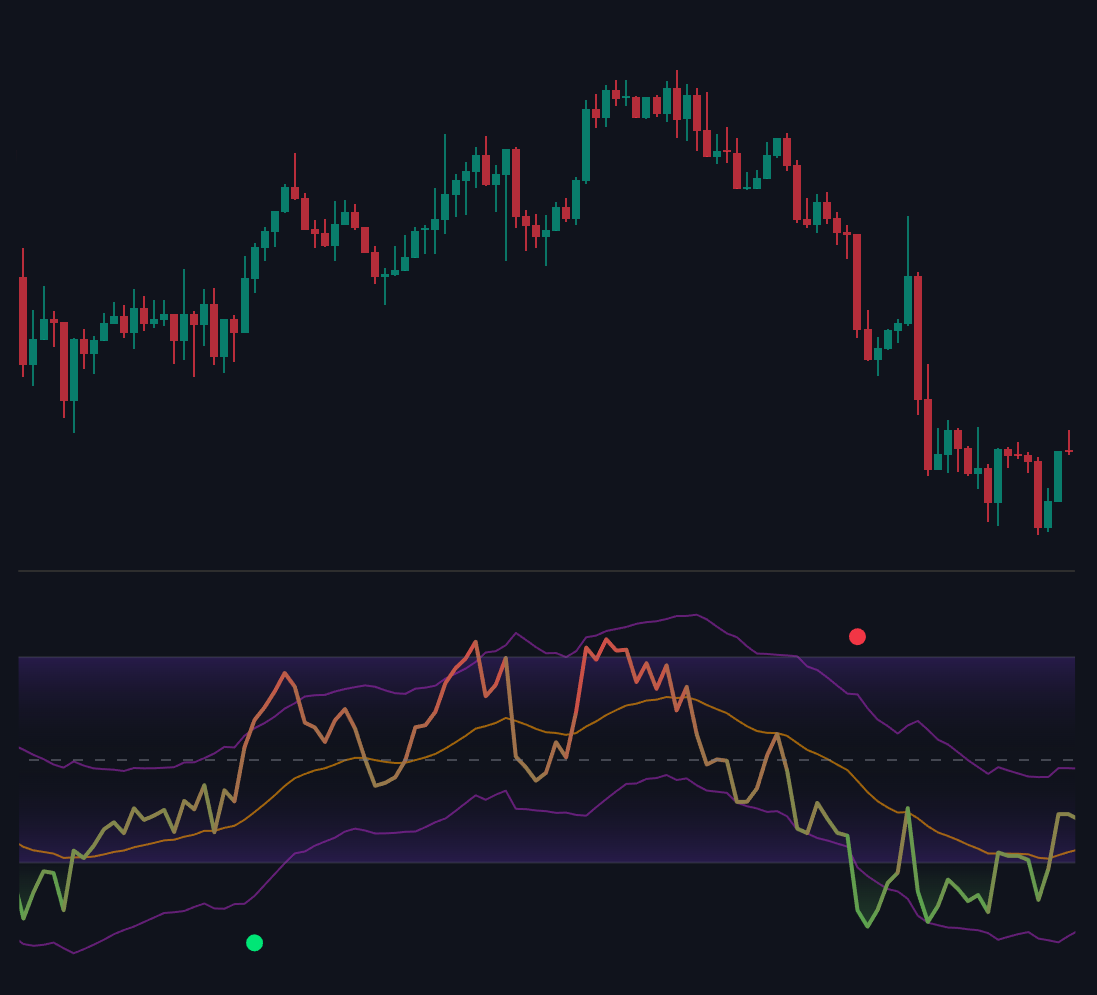
- Upward Breakout:
RSI crosses above the upper channel, indicating a bullish momentum expansion.
Marked with a small green circle below the RSI plot. - Downward Breakout:
RSI crosses below the lower channel, signaling bearish momentum expansion.
Marked with a small red circle above the RSI plot. - Channel Basis:
The central line (basis) acts as the mean RSI equilibrium level — a balance point between momentum extremes.
By surrounding RSI with adaptive envelopes and breakout detection, it helps traders visualize transitions from contraction to expansion — the critical moments when trends are born.
When combined with divergence and reversal systems, it becomes a powerful filter for identifying breakout momentum with confidence.
