
 X
X Facebook
 Discord
 Instagram
 YouTube
 ChatGPT
Swing Failure Pattern
A Swing Failure Pattern occurs when the price attempts to break a significant high or low but fails to sustain above or below that level.
SFP Types
Bullish and Bearish SFP Detection – Spots fakeouts above highs (bearish) and below lows (bullish), where price quickly reverses after taking liquidity.
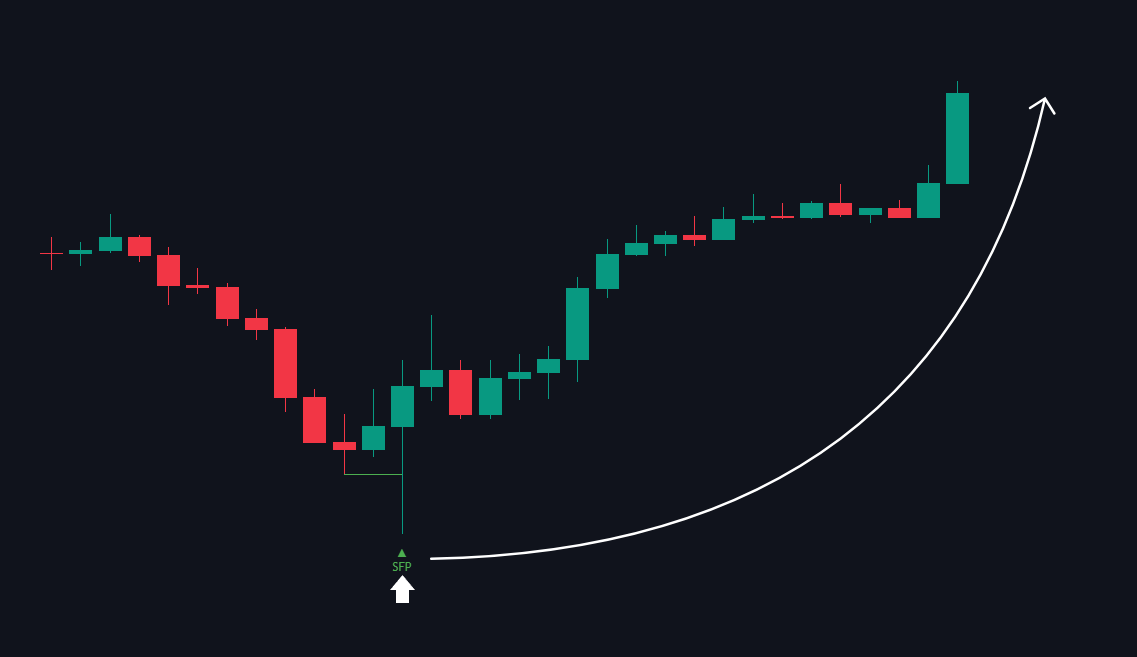
Bullish SFP
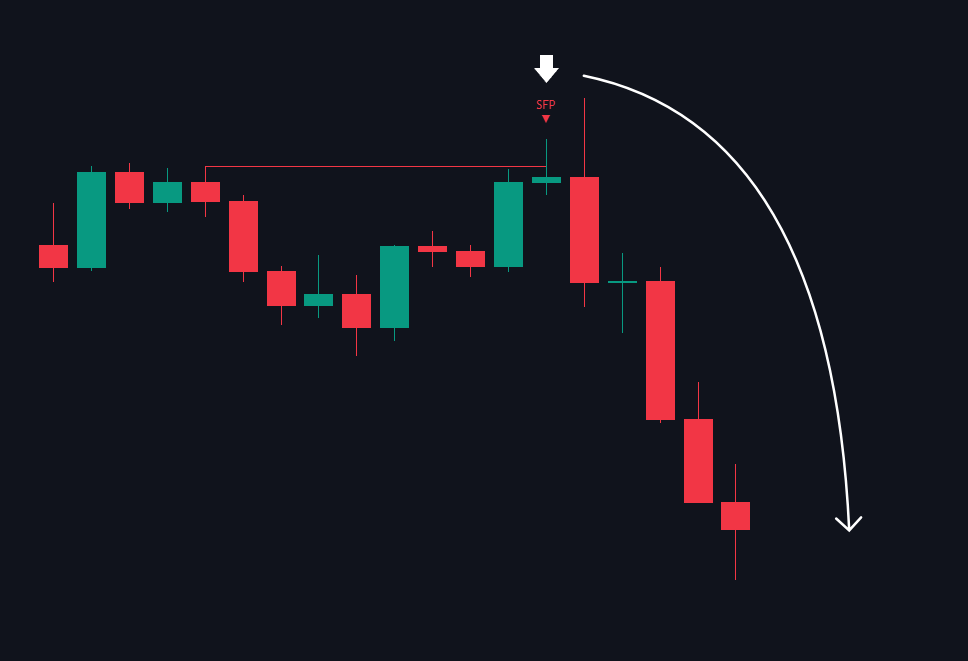
Bearish SFP
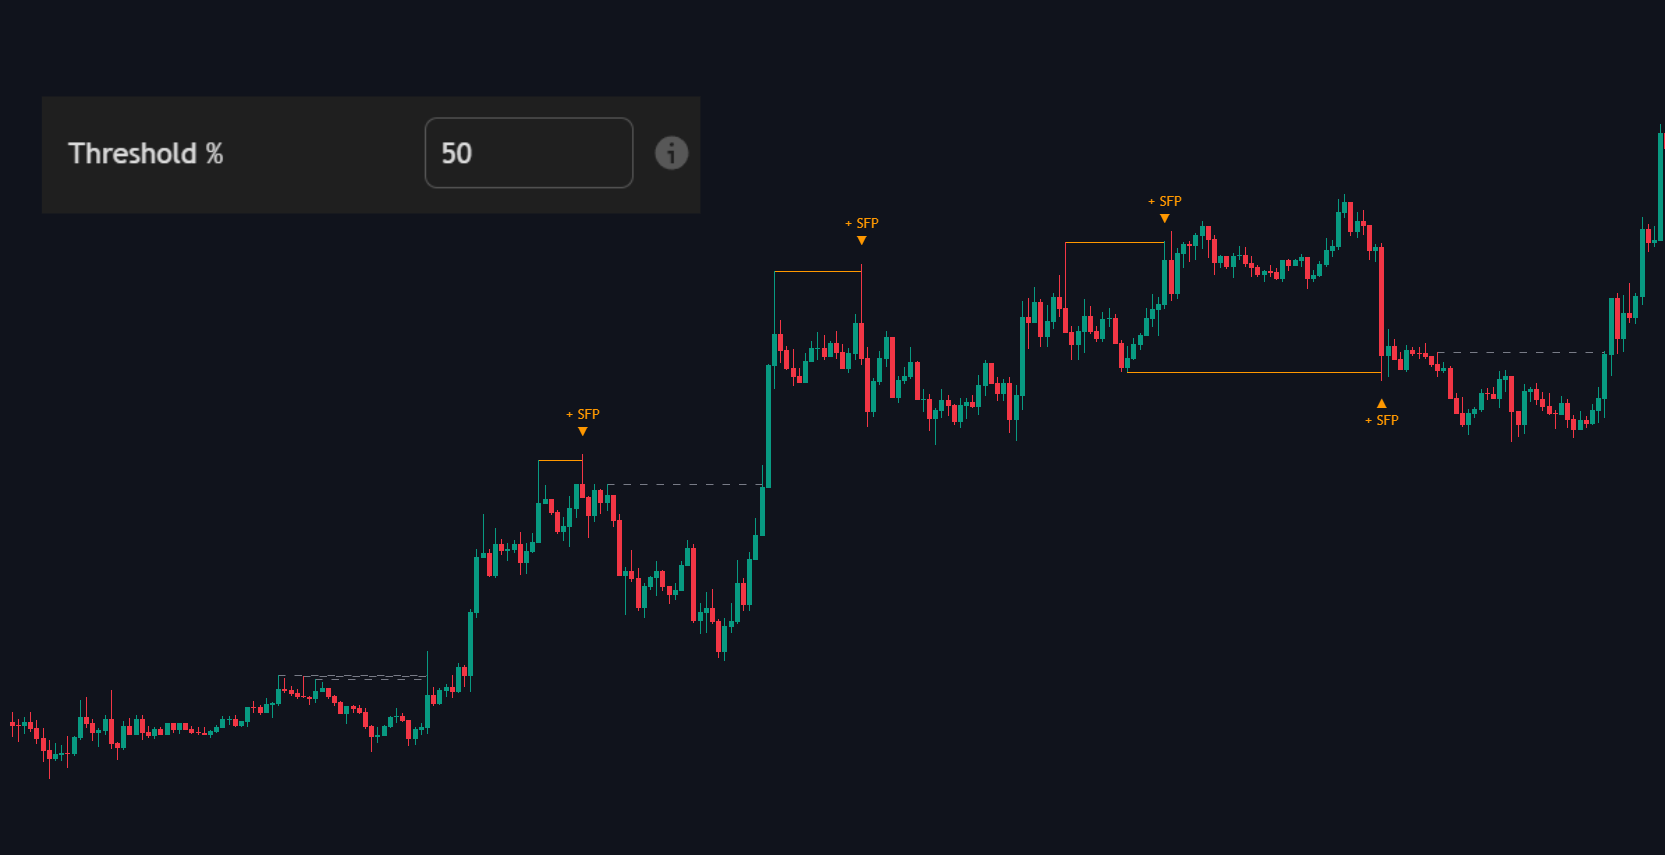
High-Volume SFP Markers (+ SFP): Identified on the chart by an orange plus sign (+ SFP) above or below the plot arrow. This marker appears exclusively when the SFP occurs with a Volume Strength exceeding 50%.
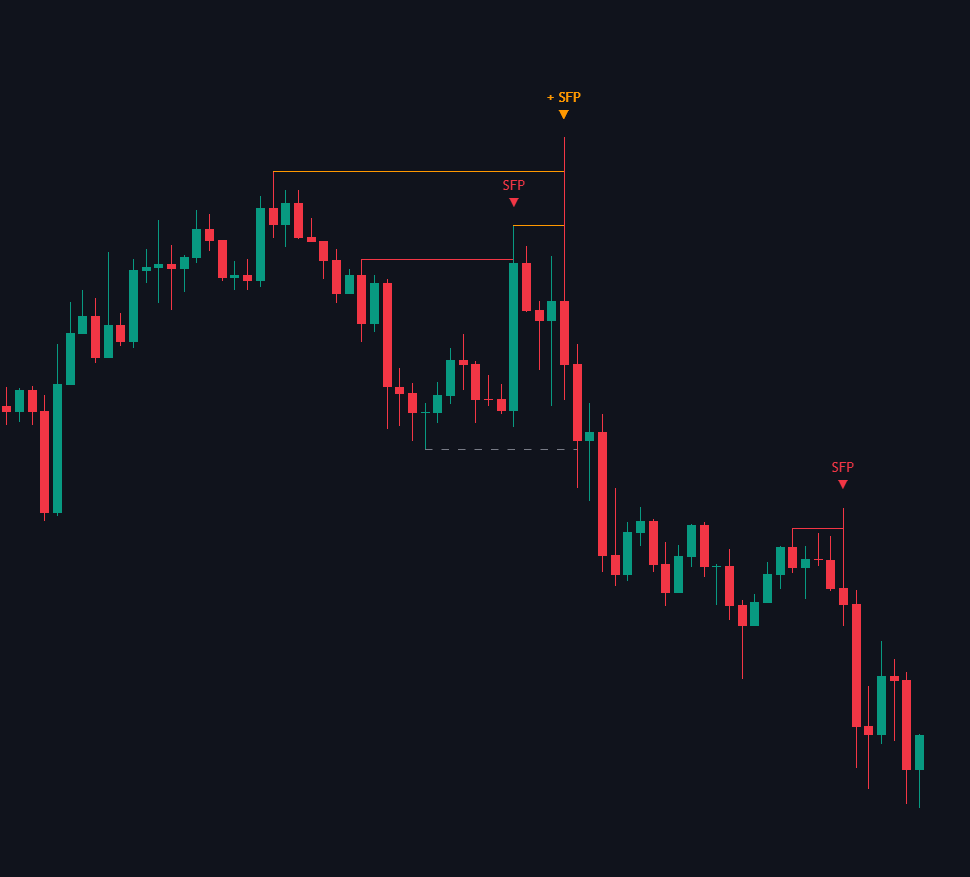
Volume Strength & Interactive Tooltips
The indicator evaluates the institutional volume backing each liquidity sweep.
When an SFP meets specific volume criteria, it triggers an enhanced visual marker and provides real-time data on hover.
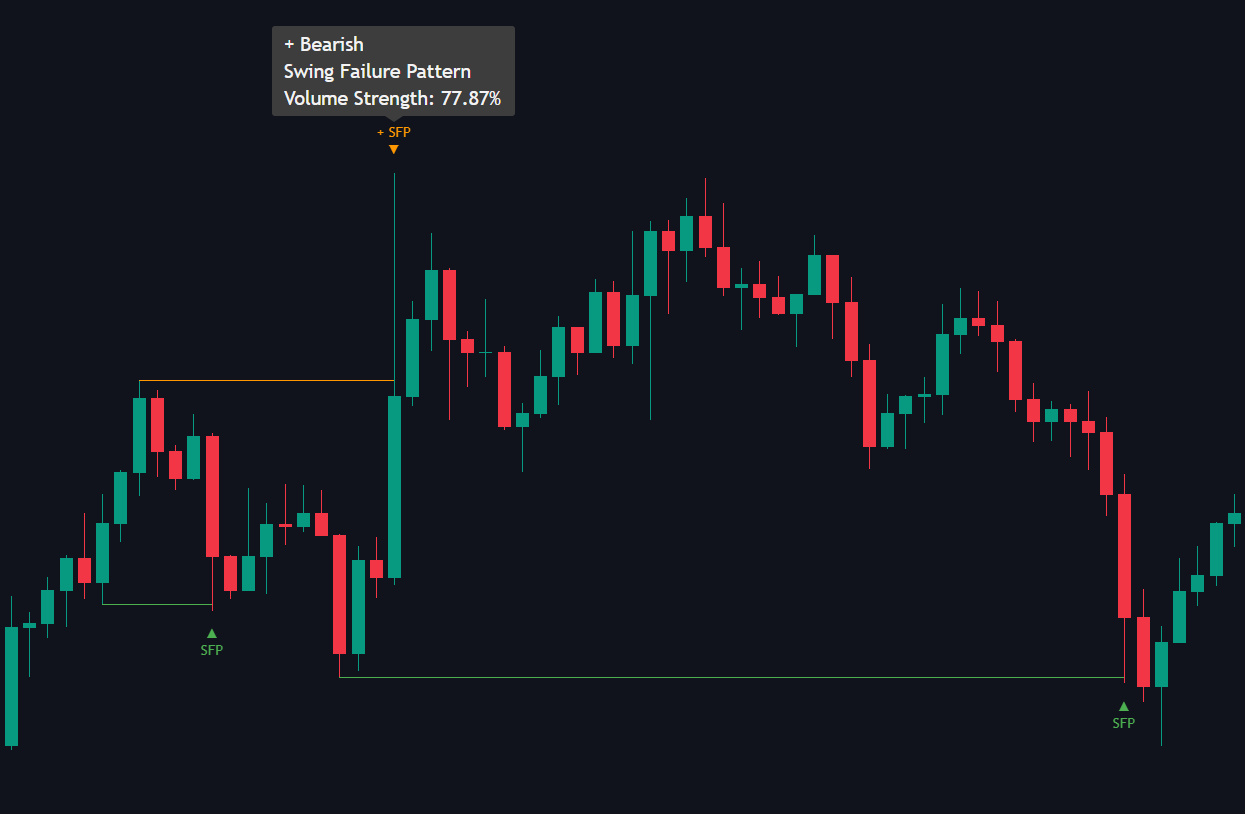
Interactive Tooltips:
Hovering over any active SFP marker opens a tooltip HUD displaying key metrics:
- Directional Bias: Shows whether the setup is Bullish (liquidity sweep of a low) or Bearish (liquidity sweep of a high).
- Volume Strength: Displays a precise value from 0% to 100%, quantifying the volume intensity behind the candle wick sweep.
- Threshold Filtering: You can filter which SFPs appear on your chart using the Threshold input setting. For example, if you set the threshold to 50%, the indicator will completely hide any SFP with a volume strength below that value.
Trend-Based Filtering (Directional Bias)
To optimize entry precision, the indicator features an directional bias filter.
This logic dynamically syncs with the toolkit's internal Market Structure engine, using the market structure trend to isolate high-probability setups.
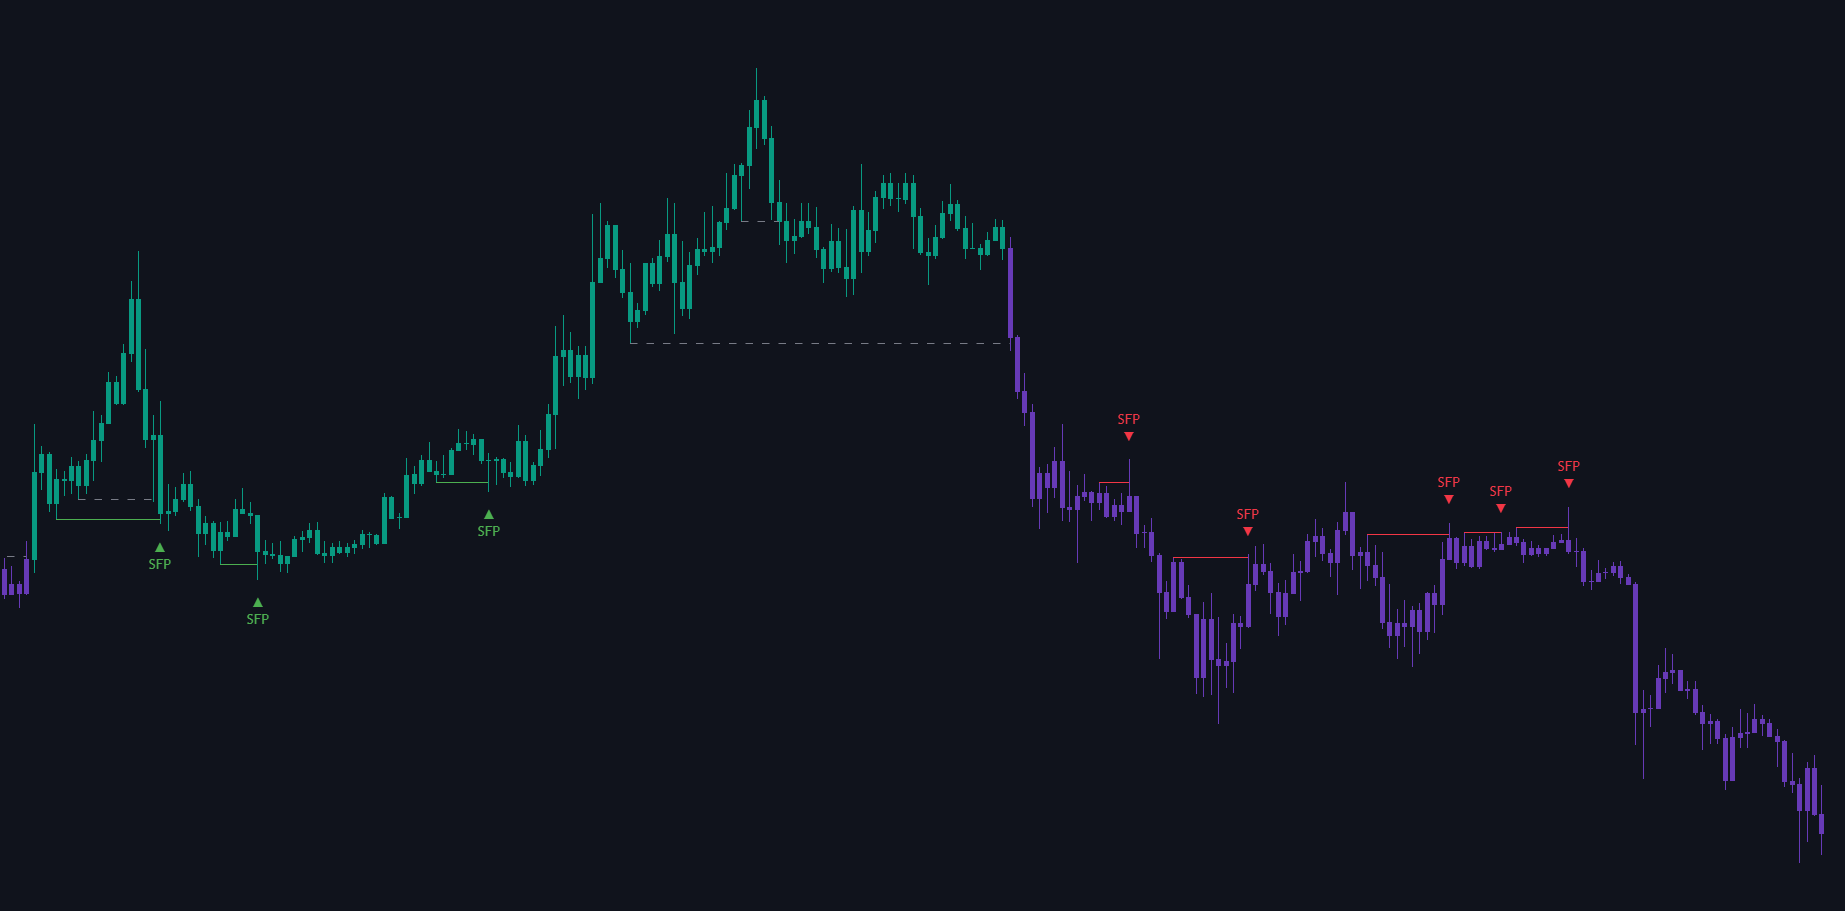
You can customize how the tool handles trend alignment via the Filtering dropdown menu:
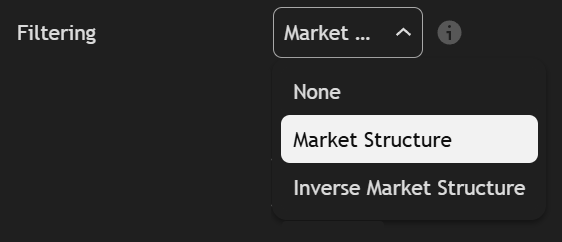
- None: Disables the directional filter. The indicator will detect and display every valid liquidity sweep (both trend-aligned and counter-trend).
- Market Structure: Recommends pro-trend setups. The toolkit automatically references the underlying Internal Market Structure Trend and restricts displays to SFPs that align with the prevailing trend direction.
- Inverse Market Structure: Recommends counter-trend setups. The filter isolates SFPs that print against the internal market structure trend, helping traders pinpoint macro reversal zones or deep premium/discount liquidity sweeps.
Invalidation Tracking (Show Invalid SFP)
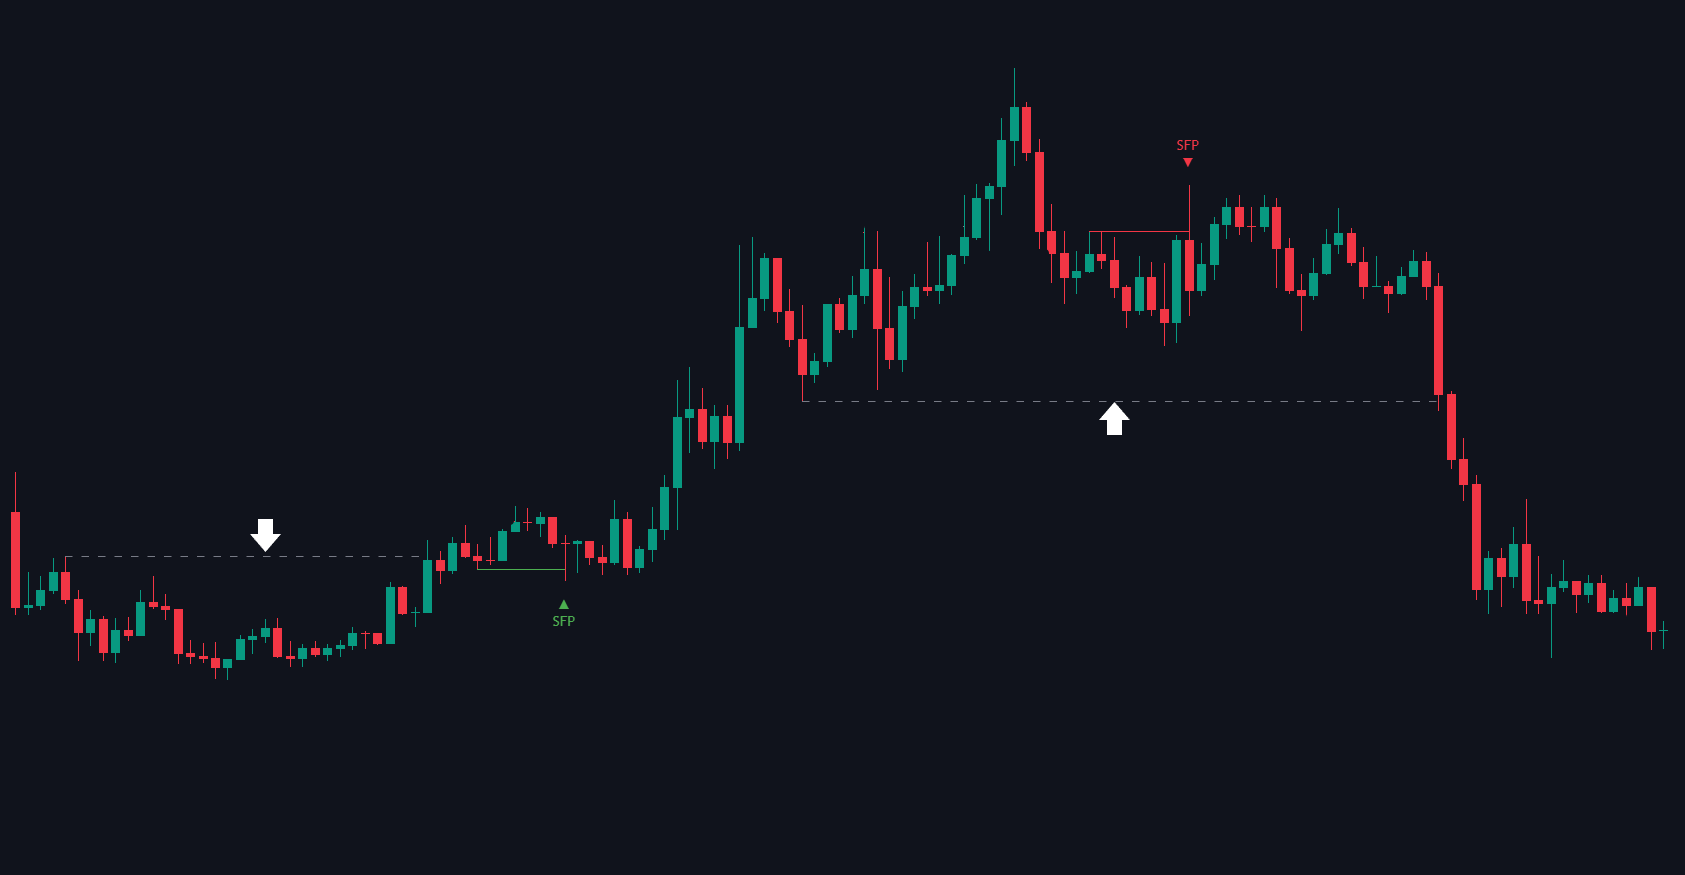
To keep your charts organized without losing historical context, the indicator tracks whether an SFP setup remains valid or has been breached by price action.
When the Show Invalid SFP toggle is enabled,

the tool keeps broken setups visible on your canvas rather than deleting them.
Settings
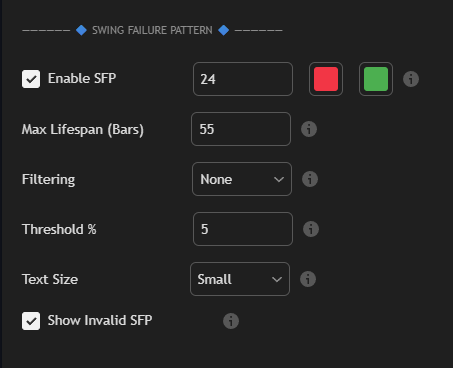
| Setting | Description |
|---|---|
|
|
| Length | Sets the number of bars considered to determine swing highs or lows. A higher value identifies more significant swings over a longer range. |
| Filtering | Select the filtering method for SFP detection:
|
| Threshold | Sets the volume threshold for identifying a valid SFP (0-100%) |
| Text Size | Adjusts the size of the SFP labels on the chart for better visibility (Small, Medium, Large) |
| Deviation Area |
|
