
 X
X Facebook
 Discord
 Instagram
 YouTube
 ChatGPT
Fair Value Gap
Fair Value Gaps — areas on the chart where price moved too quickly, leaving an imbalance between buyers and sellers.
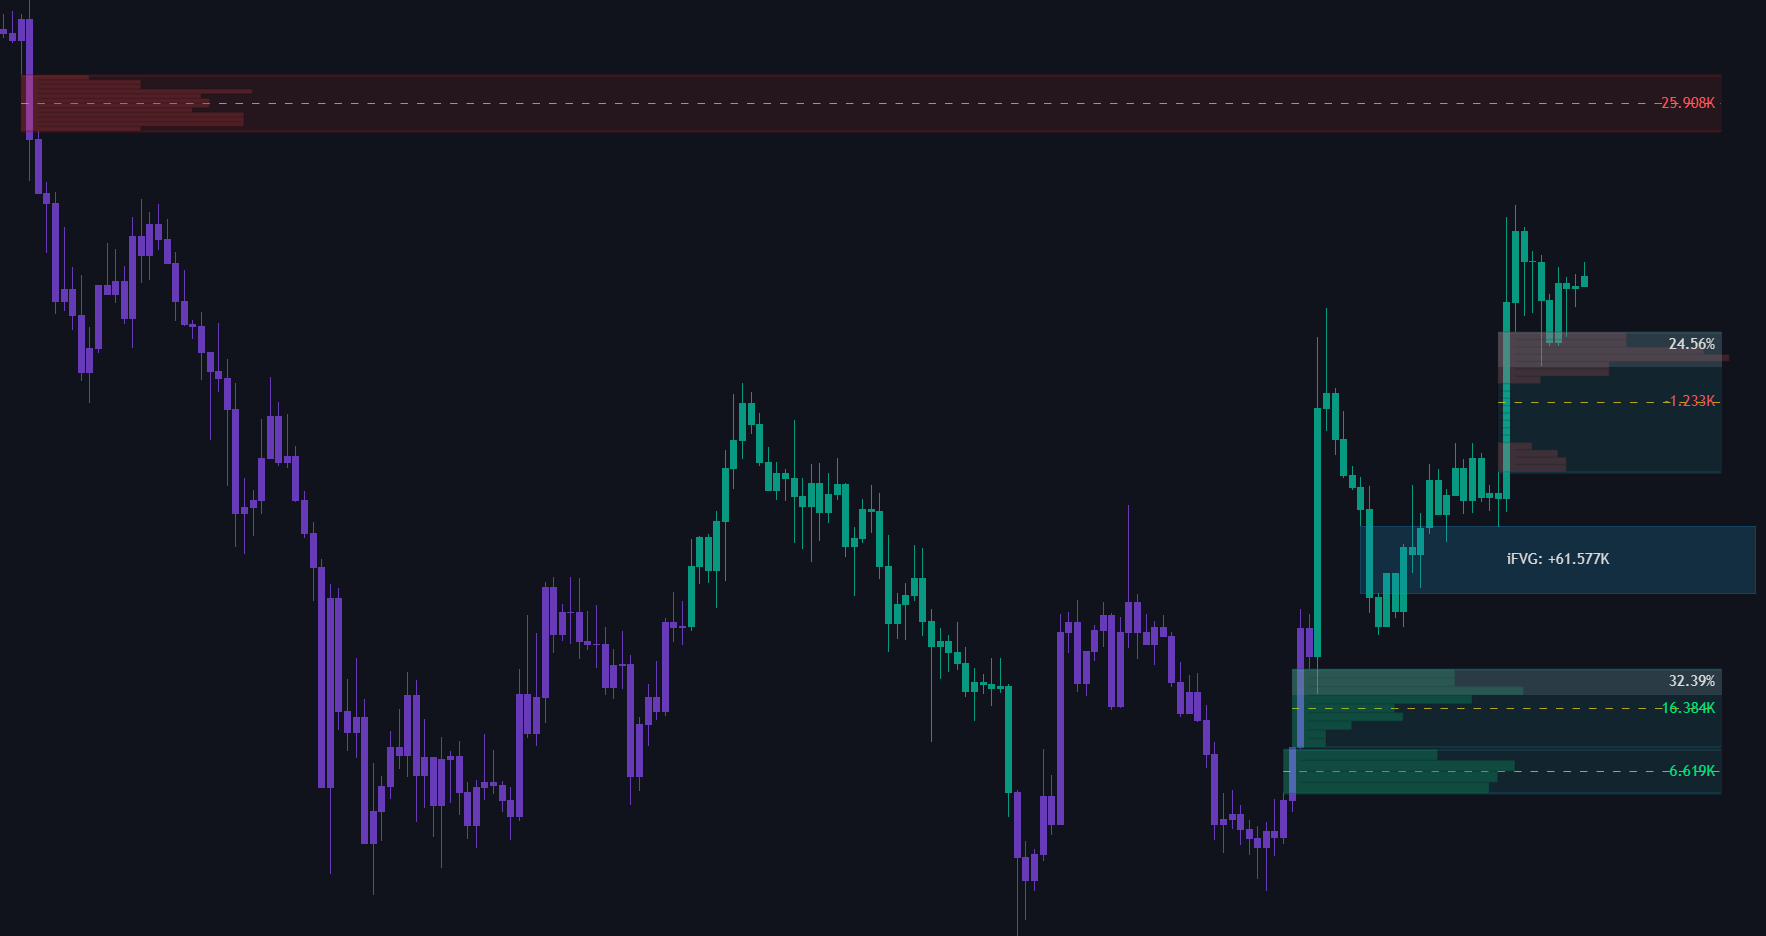
These gaps often act as magnets, drawing price back for a potential "fill" before continuing the trend.
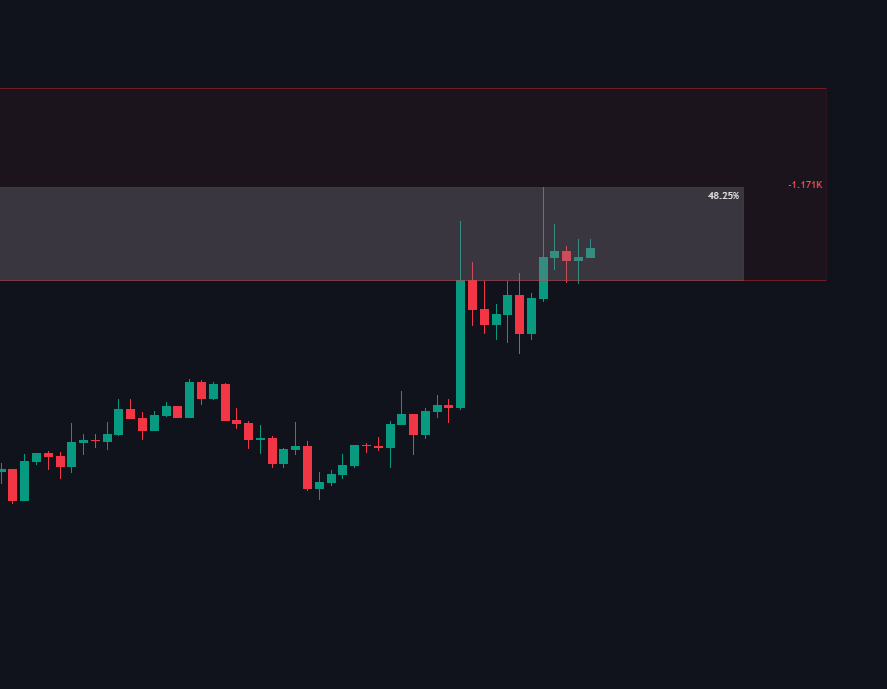
Partial Fill
When price overlays part of the FVG, it turns gray to signal a partial fill.
Each FVG displays its filled percentage
Volume Detection
Calculates delta volume inside each FVG to highlight whether buying or selling pressure dominated during the move.
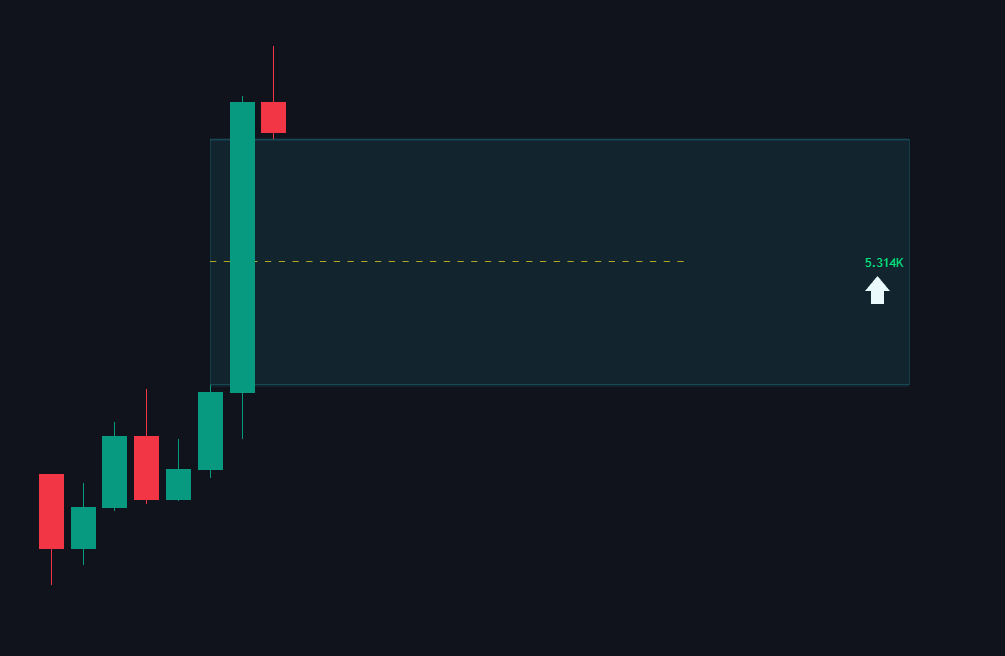
Volume Detection
FVG POC & Volume Profile
Each FVG now includes a Point of Control line that can be set to either the highest-volume price inside the gap or the mean volume level.
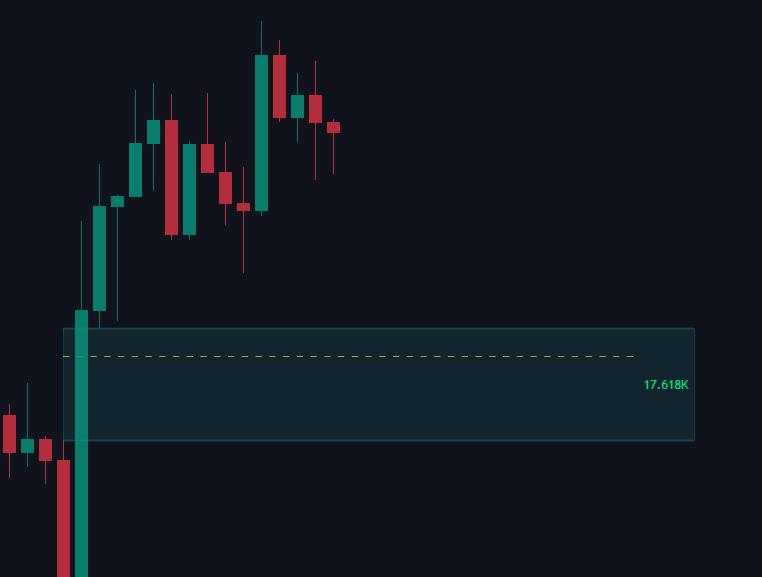
Highest volume line
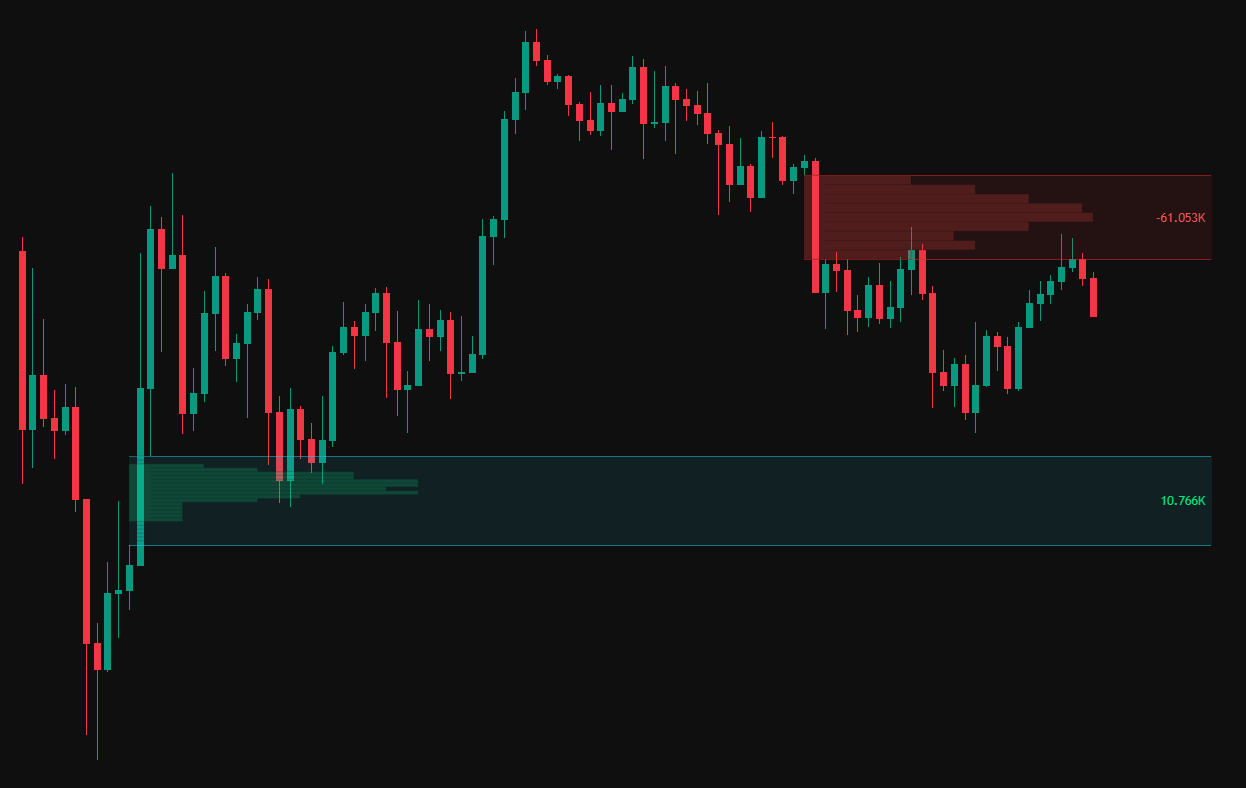
A compact volume profile can be displayed inside the FVG, showing where volume is concentrated and helping identify the most reactive level within the gap.
Timeframe
Timeframe setting allows detecting FVGs from different timeframes (e.g., higher timeframes).
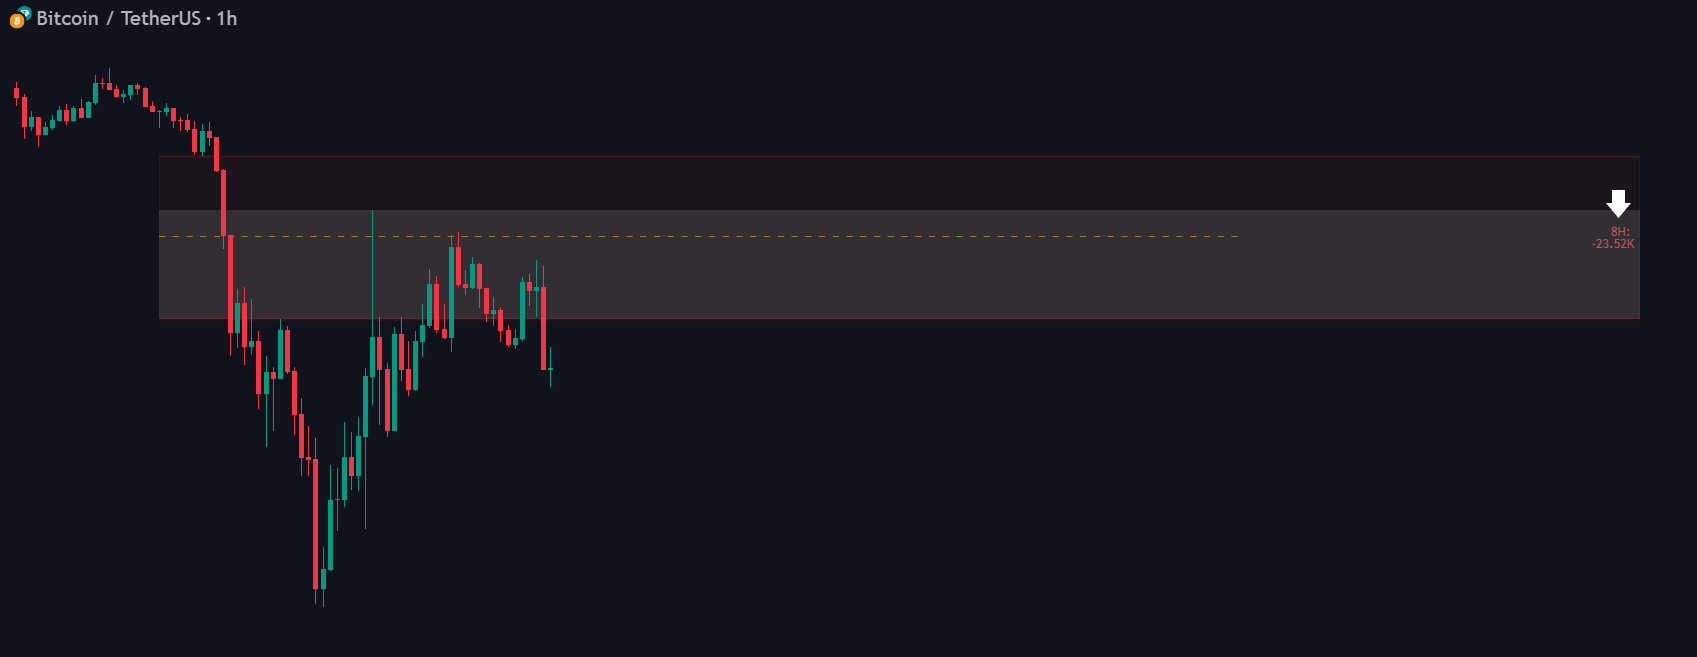
Chart 1h - FVG 8h
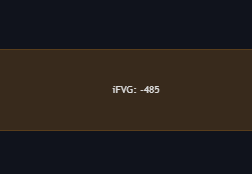
Inversion FVG (Last Broken)
When a standard FVG is breached by a candle body wick, the indicator "flips" the zone, signaling that the previous imbalance has now become a support or resistance level for a trend reversal.
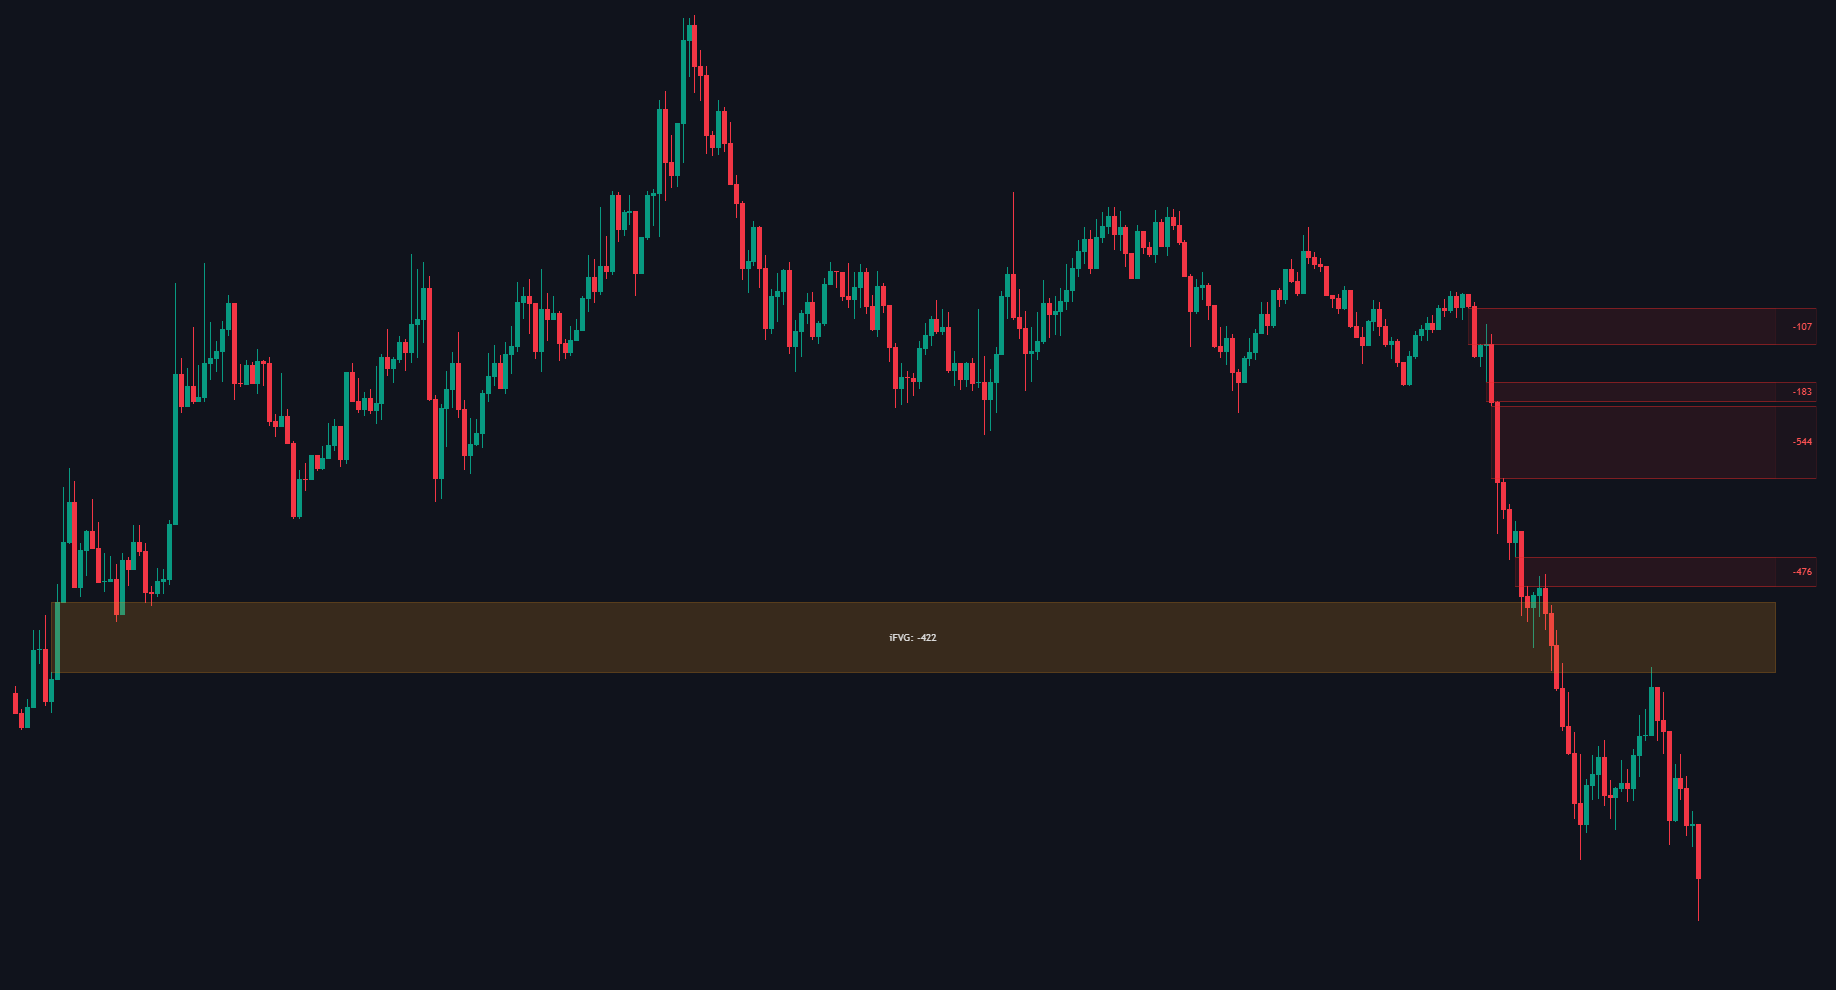
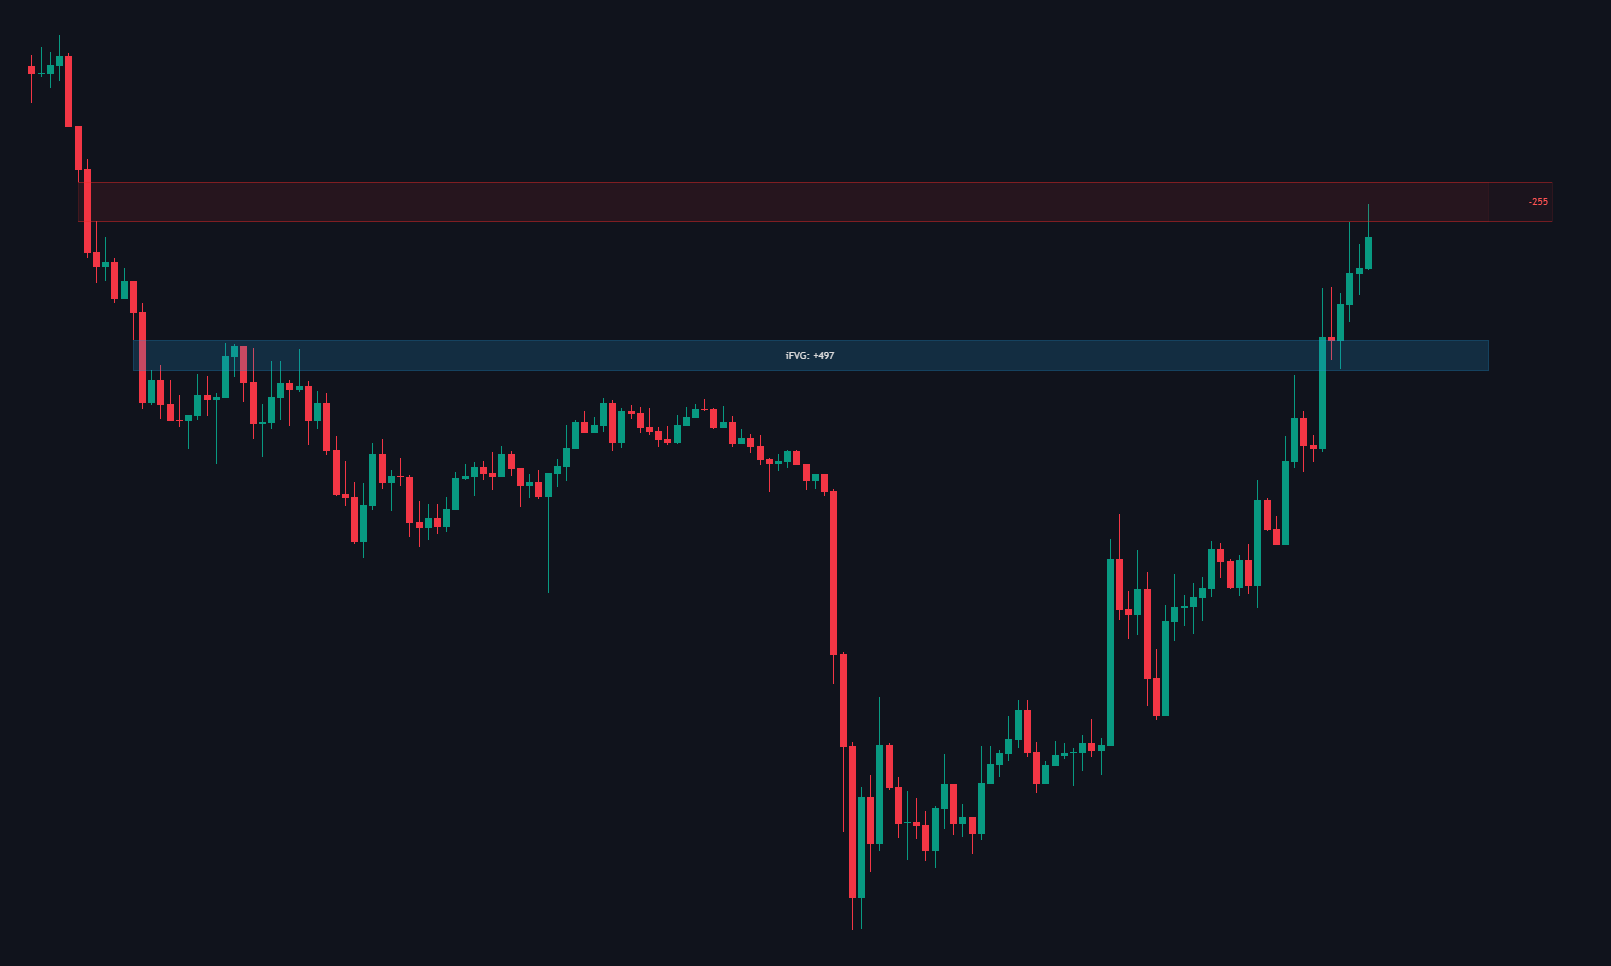
Momentum Volume: The numerical value displayed next to the iFVG label represents the total volume at the specific moment the FVG was breached and converted into an inversion zone.
FVG Signals (Created & Retest)
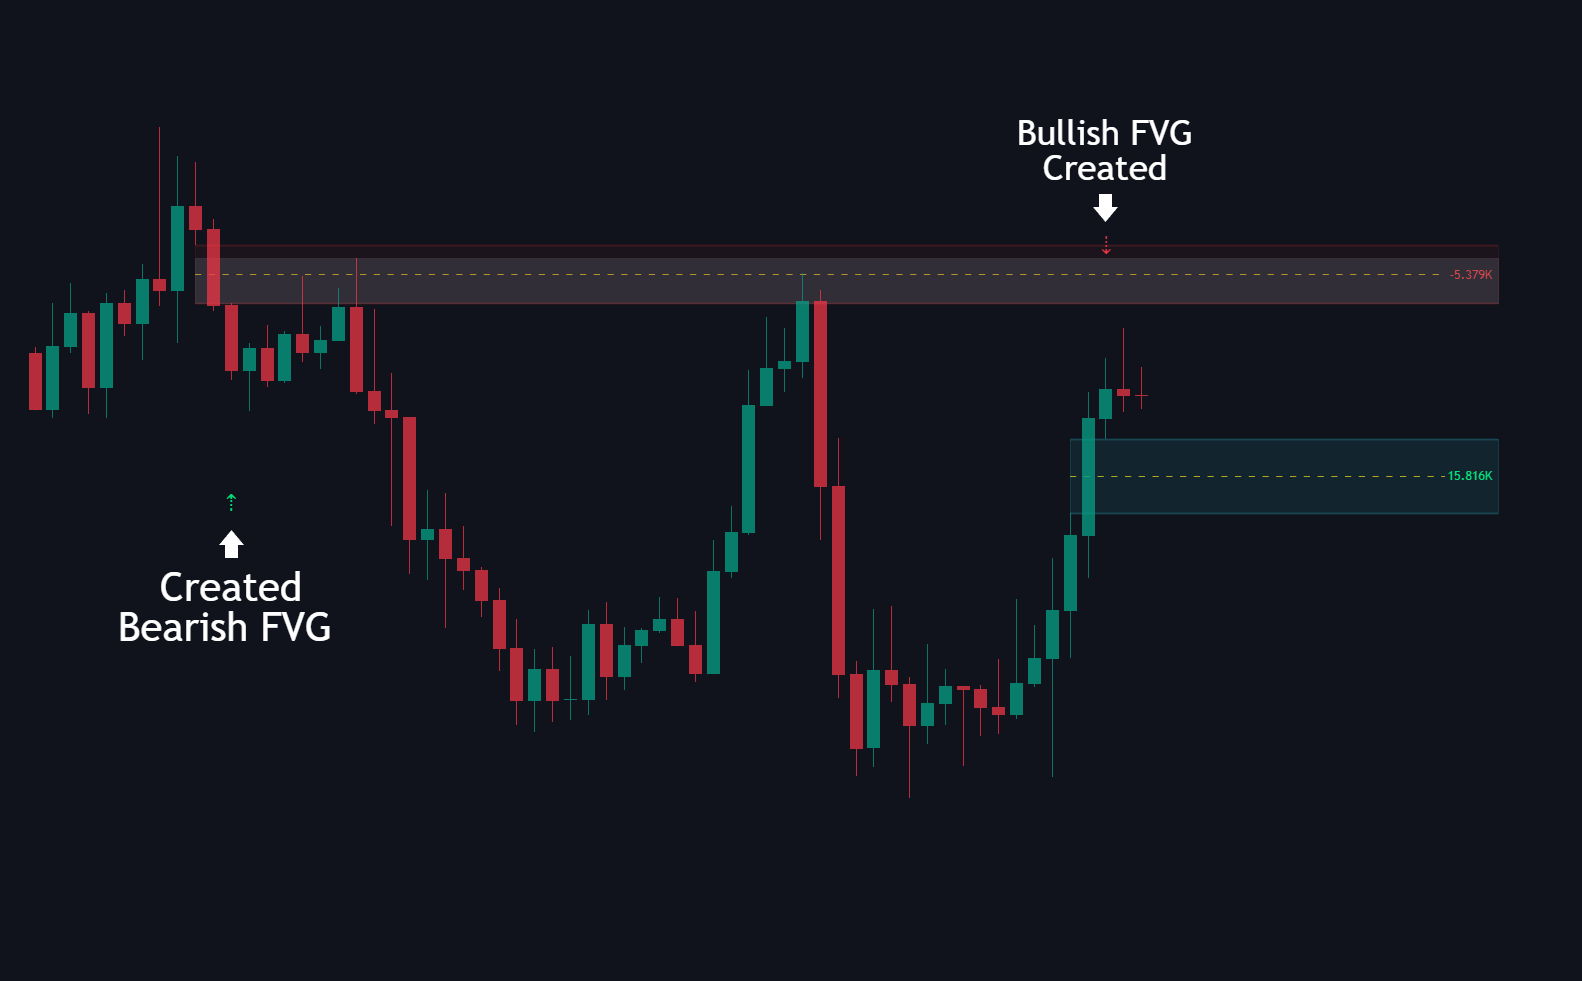
Created: Triggers when a new FVG forms.
- Bullish FVG shows a small arrow down above the creation candle
- Bearish FVG shows a small arrow up below the candle.
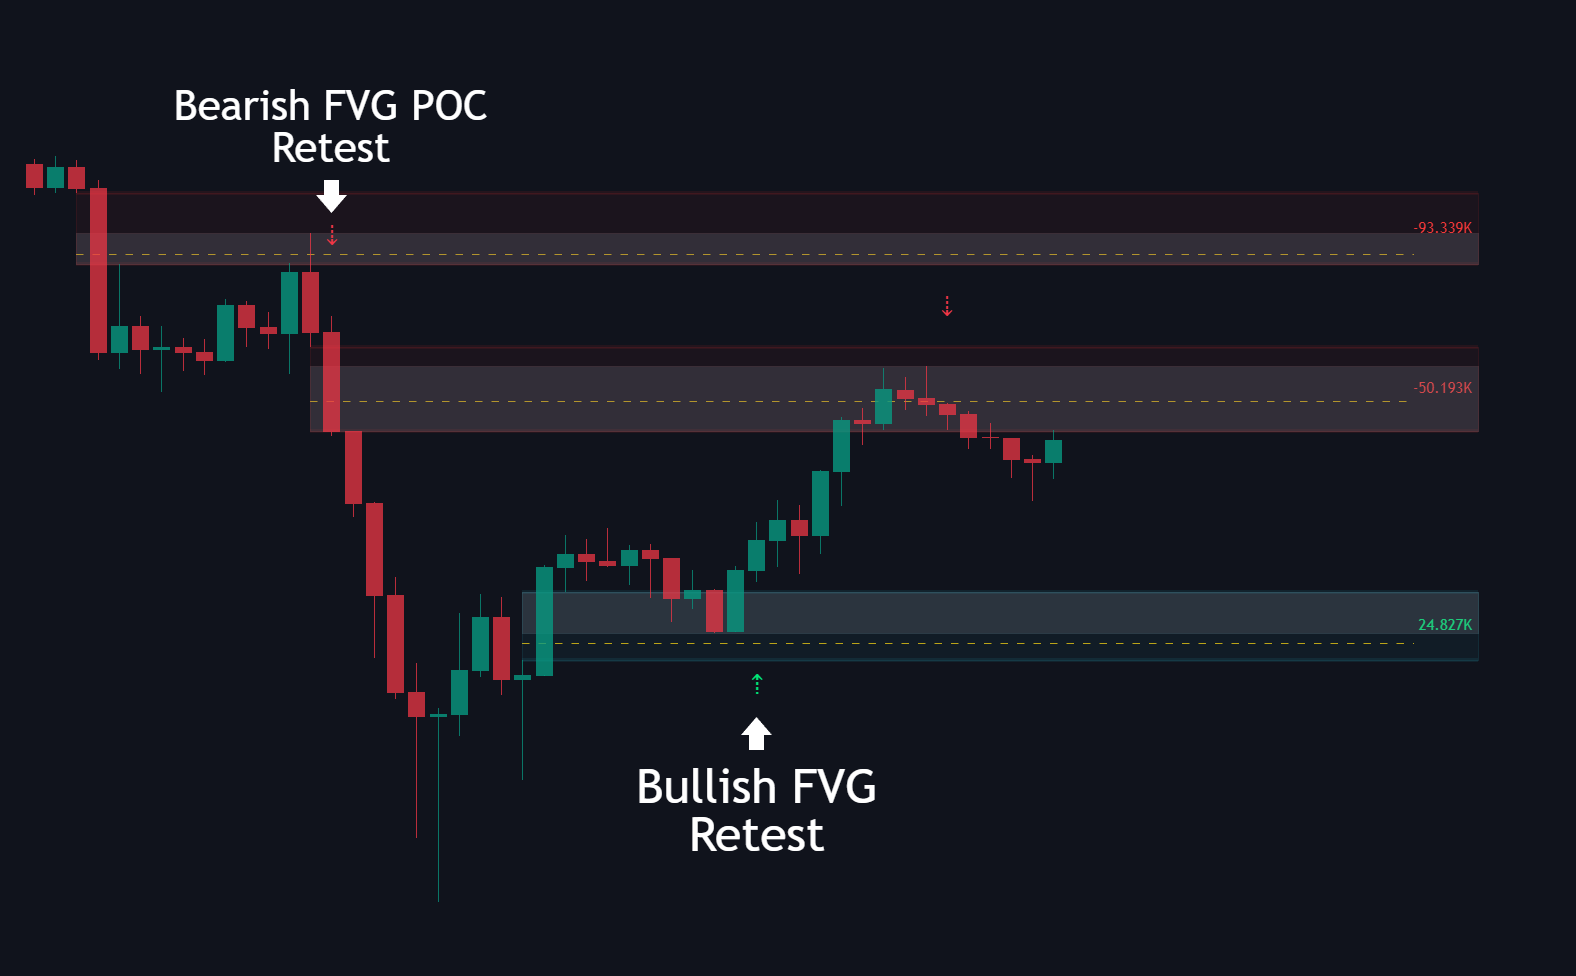
Retest: Triggers when price wicks back into the FVG’s POC or touches any FVG edge, highlighting potential reaction or continuation points.
How to use
Use bullish FVGs as potential support zones.
Use bearish FVGs as resistance during pullbacks or breakdowns.
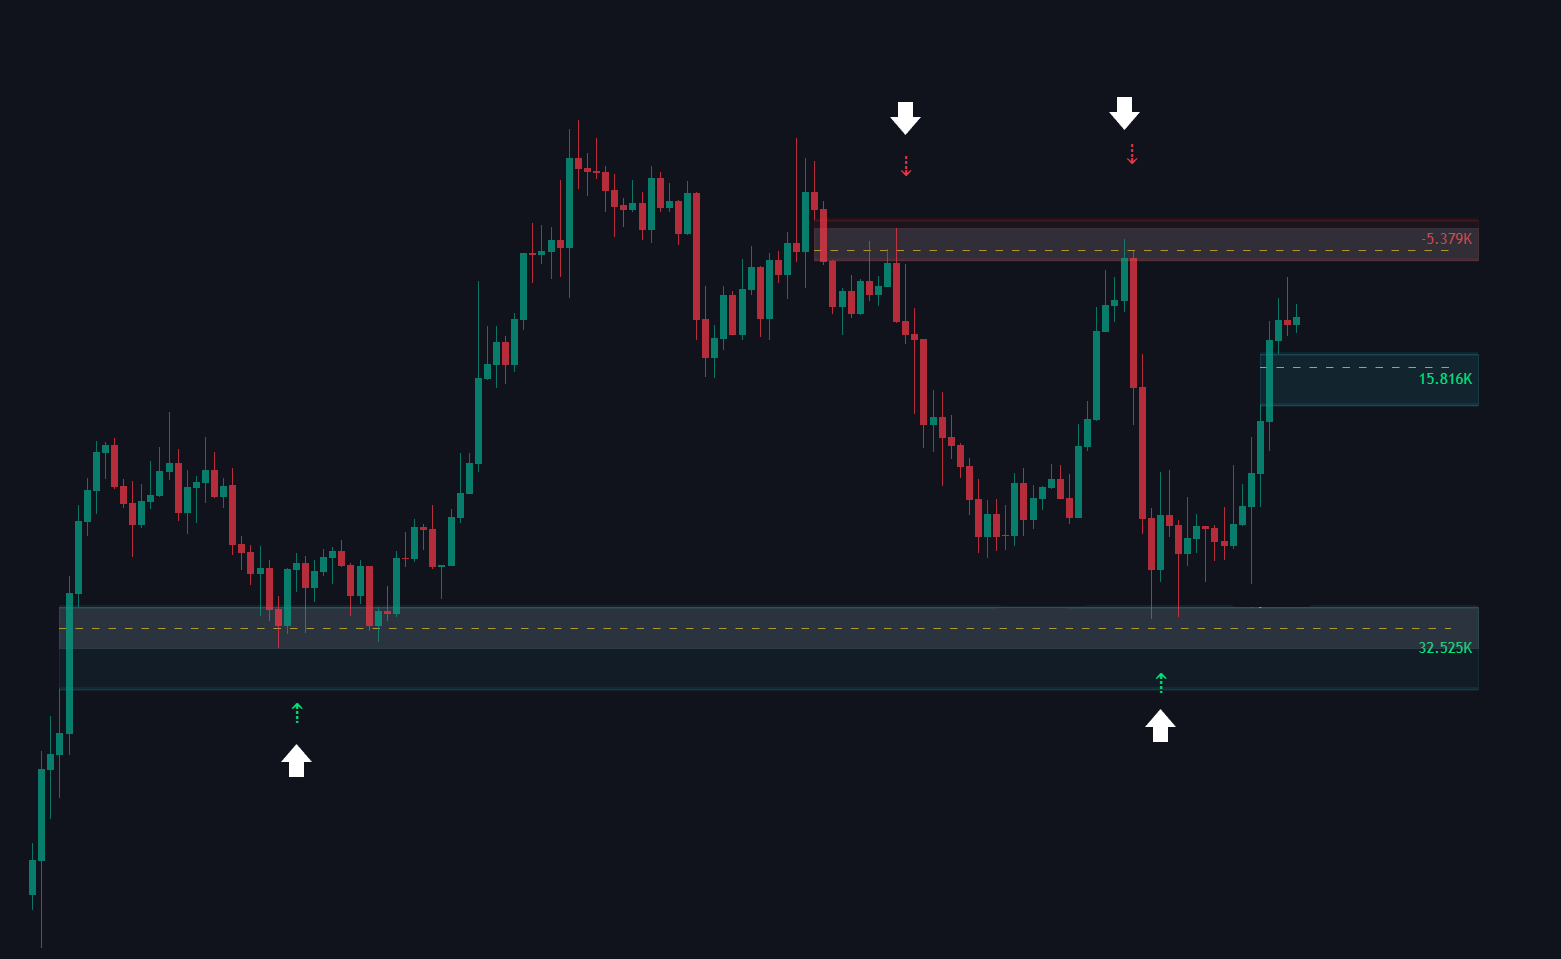
Pay attention to volume to gauge the importance of each gap.
Use higher timeframe mode for stronger context zones.
Adjust threshold to focus on only significant gaps.
Settings
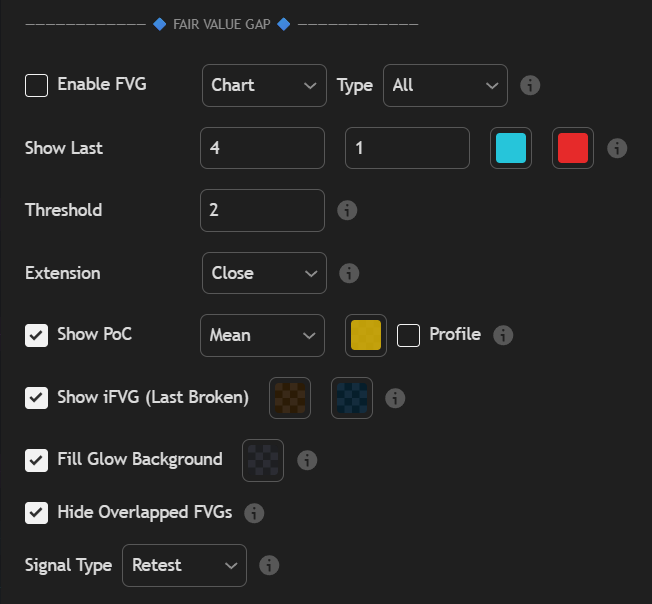
| Setting | Description |
|---|---|
|
|
| Show Last | Controls how many recent bullish and bearish FVGs are displayed on the chart. |
| Threshold | Sets the minimum imbalance size required for an FVG to be drawn, filtering out noise. |
| Extension | Controls how far the FVG box extends to the right to visualize open gaps. |
| Show PoC (Point of Control) | Adds a POC line inside each FVG. Can be set to Highest Volume or Mean. The color box customizes the POC color. The Profile option displays a volume profile inside the FVG. |
| Show iFVG (Last Broken) | Enables Inversion FVGs. When an FVG is breached by a candle body, the zone "flips" and changes color to signal a trend reversal. |
| Fill Glow BackGround | Adds a soft glow with % filled to the FVG area for better visibility of filled gap zone. |
| Hide Overlapped FVG | Removes overlapping gaps to keep the chart clean and display only distinct zones. |
| FVG Signals | Provides alerts for Created (new gap formed) or Retest (price touches the gap or POC). |
