

 X
 Discord
 Instagram
 YouTube
 ChatGPT
Liquidity Voids
Liquidity voids are the extreme imbalances left behind when price moves so fast that little or no trading takes place.
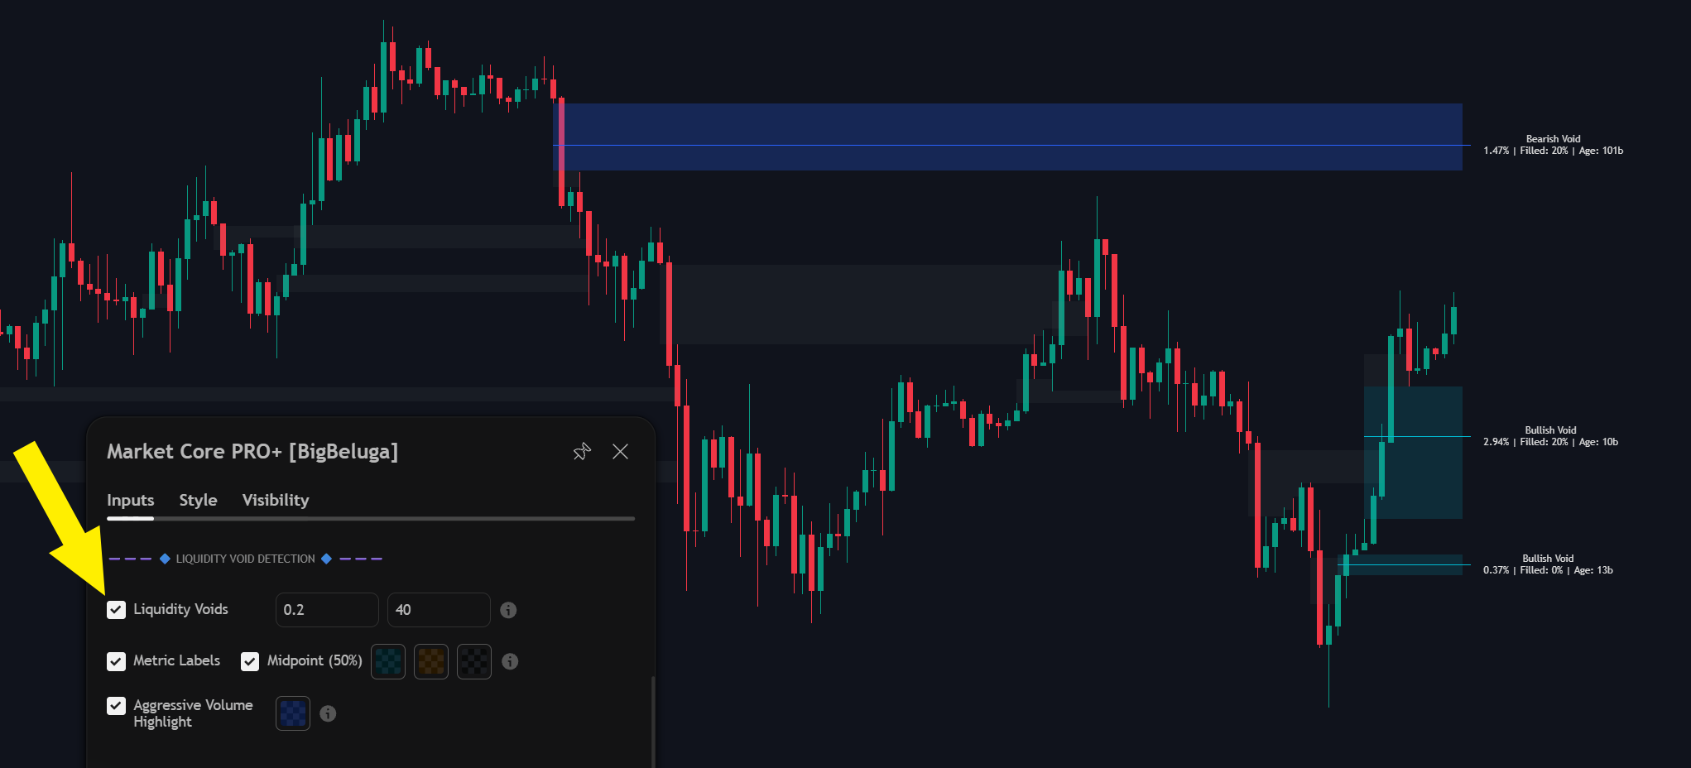
Because almost no contracts changed hands inside them, voids behave like magnets: price tends to return and rebalance the area before continuing, which turns an empty space on the chart into a price target.
Only gaps that clear a minimum imbalance size are plotted. That threshold is measured against average volatility, so it adapts to the instrument — raise it to keep only the violent gaps, lower it to catch the smaller intraday ones. Up to 40 active zones stay on the chart at once, so the map never grows into noise.
Zone labels
Each void prints its own metrics on the right edge of the chart:
- Size — how large the imbalance is as a percentage of price.
- Filled — how much of the zone price has already rebalanced.
- Age — how many bars ago the void was created.
The optional midpoint line marks the 50% consequent encroachment of the zone, which is the level price most often reacts to first when it returns.
Mitigation tracking
Voids are tracked in real time. As price trades back into a zone, the filled portion is repainted with
the mitigation colour and the Filled value in the label climbs.
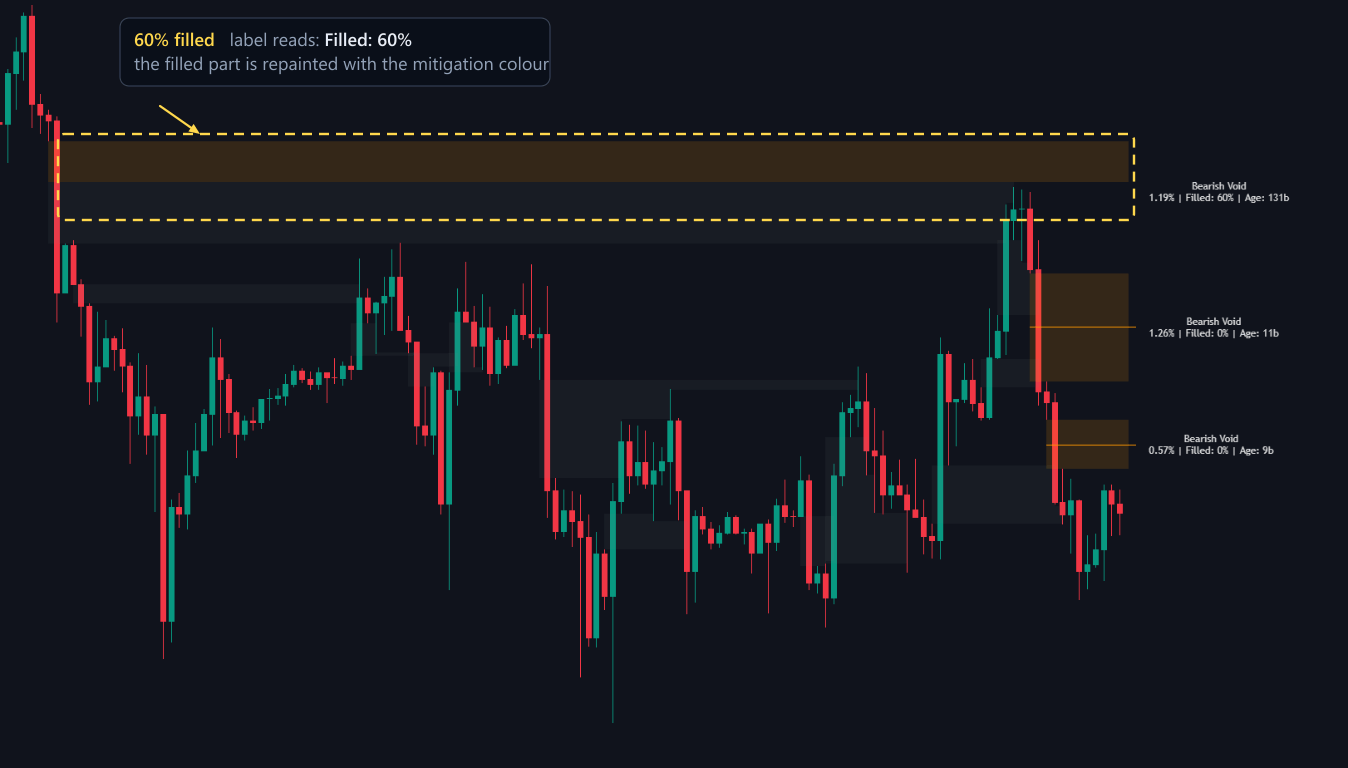
In the example above the top bearish void is 60% filled. The lower part of the zone has already been rebalanced and only the remaining 40% still behaves as an untested area, so a partially mitigated void stays useful as a reference while a fully filled one can be ignored.
Aggressive volume voids
Gaps that formed with at least 1.5x the average volume are painted with the aggressive volume colour.
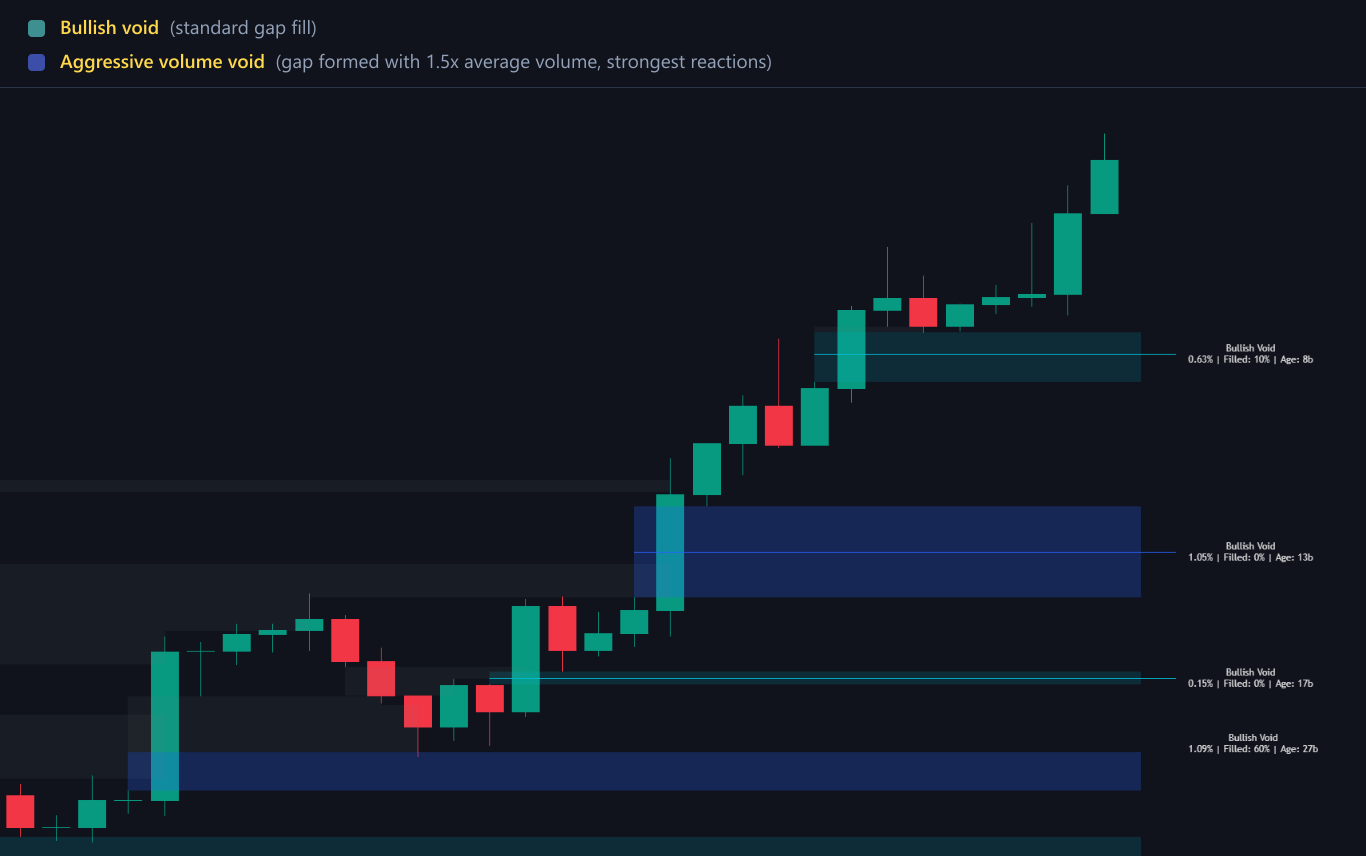
Those are the gaps created by real institutional aggression rather than by a quiet drift, and they produce the strongest reaction when price returns to them.
Settings
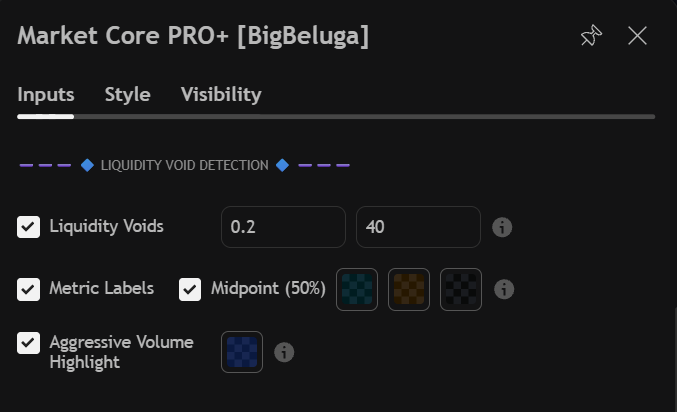
| Settings | Description |
|---|---|
| Liquidity Voids | Enable the void detector. |
| Imbalance threshold | Minimum imbalance size, measured against average volatility. Raise it for fewer, stronger voids. |
| Max zones | Maximum number of active void zones kept on the chart (up to 50). |
| Metric Labels | Show size, fill percentage and age next to each void. |
| Midpoint (50%) | Draw the 50% consequent encroachment line through the middle of each void. |
| Zone colours | Bullish gap, bearish gap and mitigated segment colours. |
| Aggressive Volume Highlight | Paint gaps created with 1.5x average volume. |
| High volume colour | Colour used for those aggressive gaps. |
