

 X
 Discord
 Instagram
 YouTube
 ChatGPT
Trend/Volatility Score Visualizer
The whole watchlist in one meter.
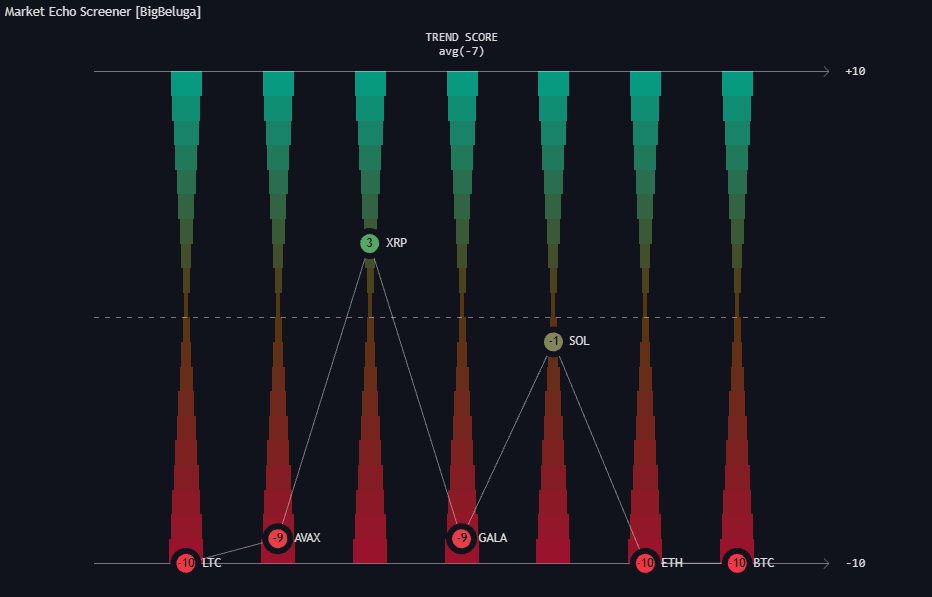
Next to the table, the screener draws a small gauge for every tracked symbol. Instead of reading rows one by one, you see the balance of the watchlist at a glance.
What it shows
- One vertical bar per symbol, from -10 at the bottom to +10 at the top, red to teal.
- A marker on each bar with the ticker and its current reading.
- A dashed zero line across the middle.
- The average of the enabled symbols in the header, e.g.
TREND SCOREavg(-7).
How to read it
- Above the line = positive reading, below = negative. The further from zero, the stronger.
- All markers high = broad strength; all low = broad weakness.
- The average is the tone of the watchlist. Compare it across sessions to see if the market is improving.
- Bars follow the symbol slots, so the same position is always the same market.
Modes
The default. Shows trend strength and direction — the mode to use for conviction.
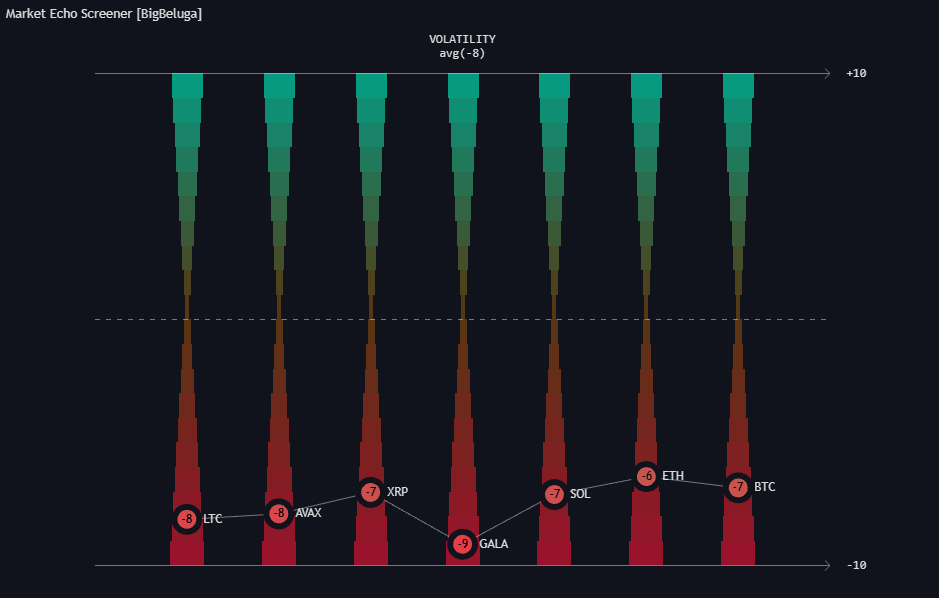
Plots volatility instead of trend score. Use it to see which markets are quiet and which are expanding: quiet suits range trading, expanding suits momentum. It says how much a market moves, not where it is going.
Settings
- Display Chart — shows or hides the visualizer.
- Chart type — Trend Score or Volatility.
