
 X
X Facebook
 Discord
 Instagram
 YouTube
 ChatGPT
Money Flow Profile
The best profile out there for trading and analyzing real market volume.
The Volume Profile with Money Flow Profile provides a detailed look at trading activity across price levels, combining traditional volume analysis with money flow data.
Volume and Money Flow Analysis:
Displays both traded delta volume and money flow at each individual price level, allowing traders to clearly see where aggressive buying or selling is concentrated inside the range.
On the left side, the chart displays Money Flow (in dollar value), showing the capital intensity behind each level.
On the right side, it shows Volume delta, helping you understand whether that money was primarily buying or selling.
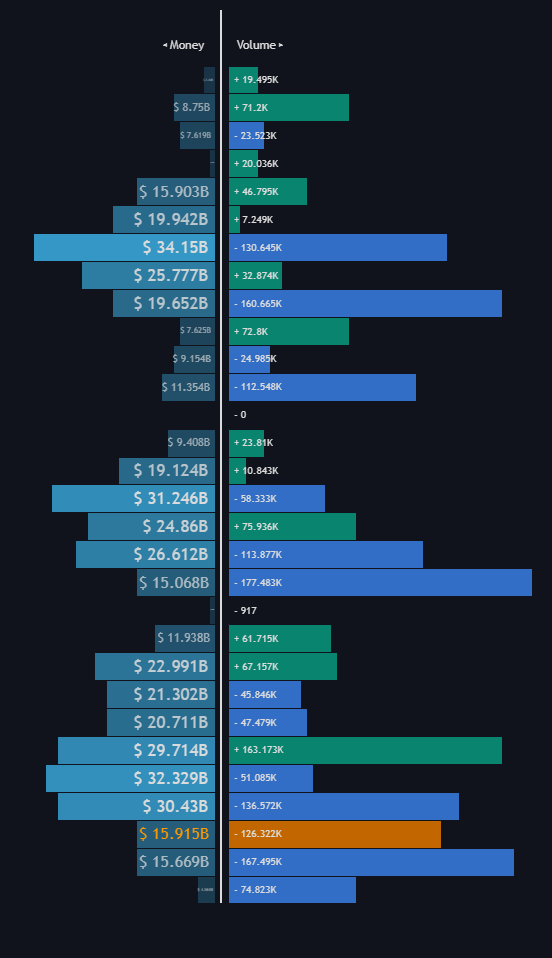
Each horizontal row represents a price bin, where activity is aggregated and separated by direction:
- Green bars → Bullish delta bins
These show price levels where buy volume exceeds sell volume.
Strong green bars highlight aggressive buyers stepping in and absorbing offers. - Blue bars → Bearish delta bins
These represent levels where sell volume exceeds buy volume.
Large blue bars indicate dominant selling pressure and potential distribution.

- Orange bar → Currently filling bin
This highlights the active price level where volume is still accumulating in real time.
It allows traders to monitor live order flow shifts as the candle develops.

This structure helps you:
- Detect absorption zones
- Identify imbalance clusters
- Spot potential support/resistance built from real participation
- Track real-time shifts in order flow
The combination of volume + capital flow provides deeper insight than traditional volume profile alone, revealing who is in control at each price level and how strong that control really is.
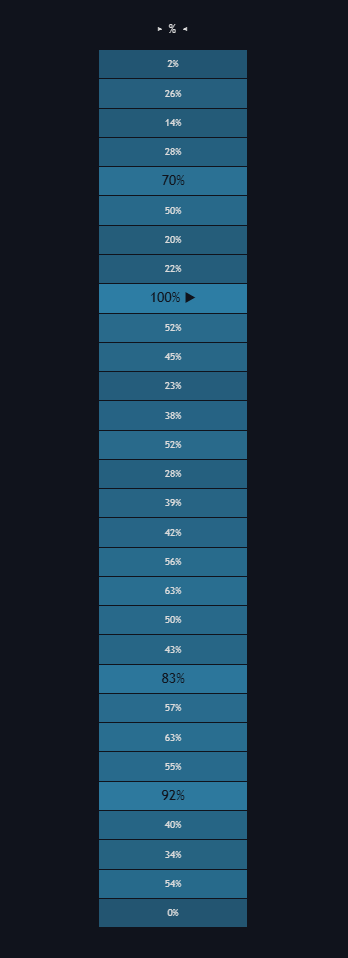
Level Strength (%):
The left column shows strength percentages, indicating which levels have the highest influence on price.
Points of Control (POC):
Highlights key POCs, showing dominant levels for money flow, delta (positive and negative), volume, and level strength.
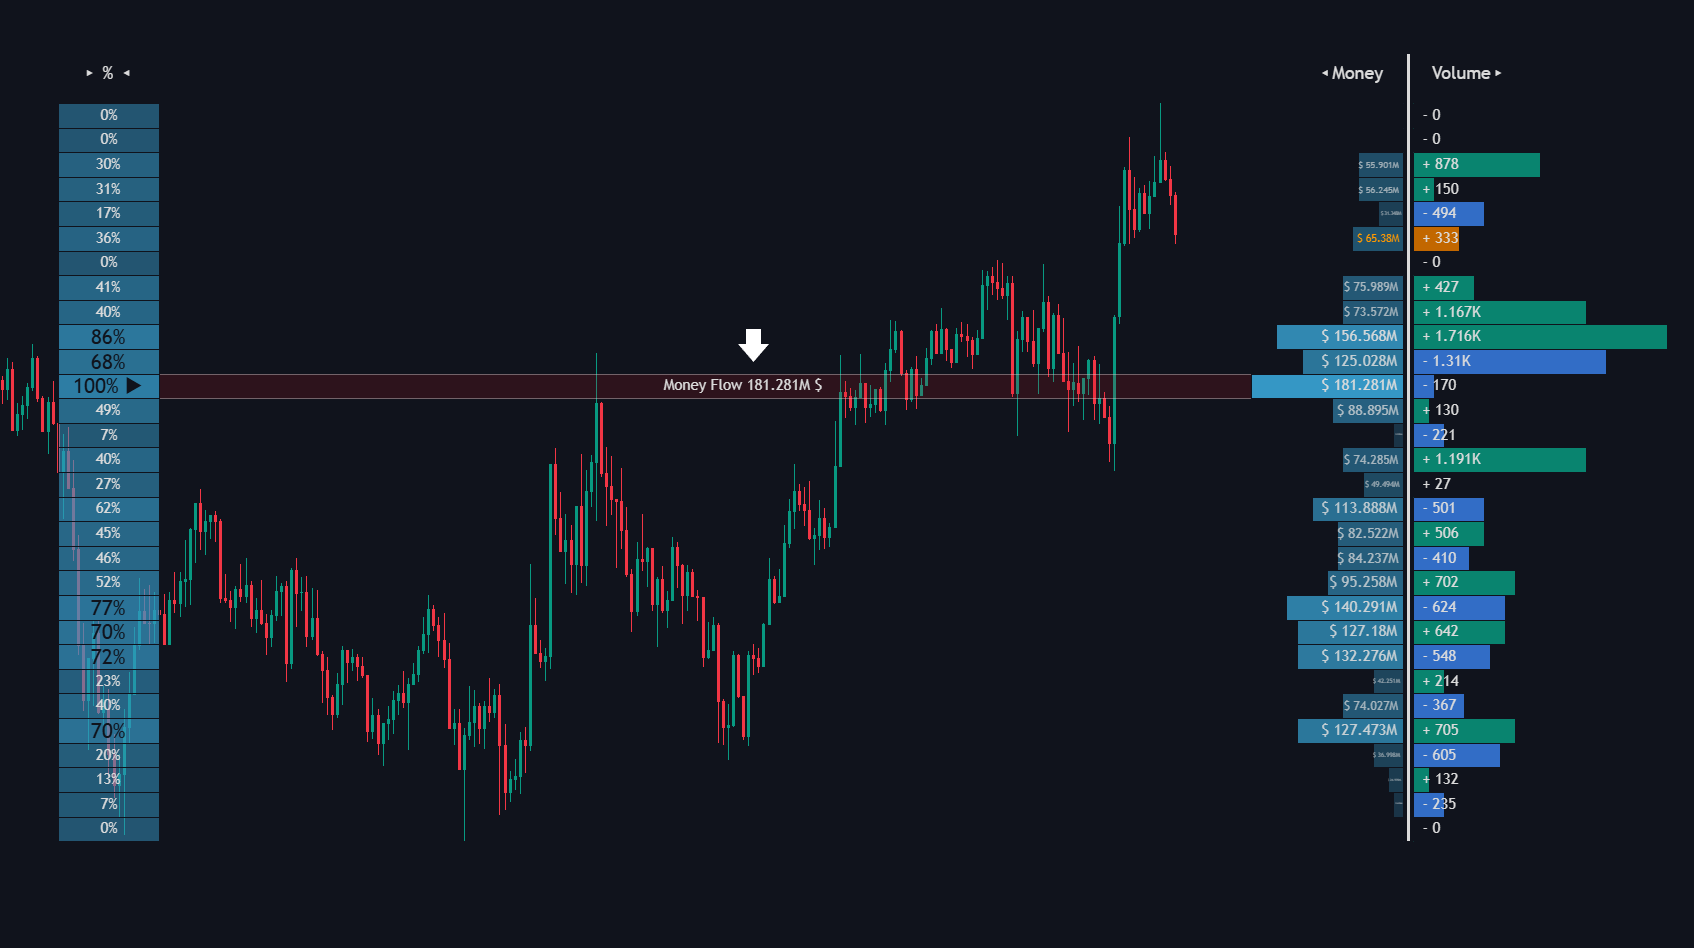
The Money Flow POC
shows the level with the highest concentration of capital flow.
Delta +
point of control suggests strong buying interest at that level and shows the highest volume level.
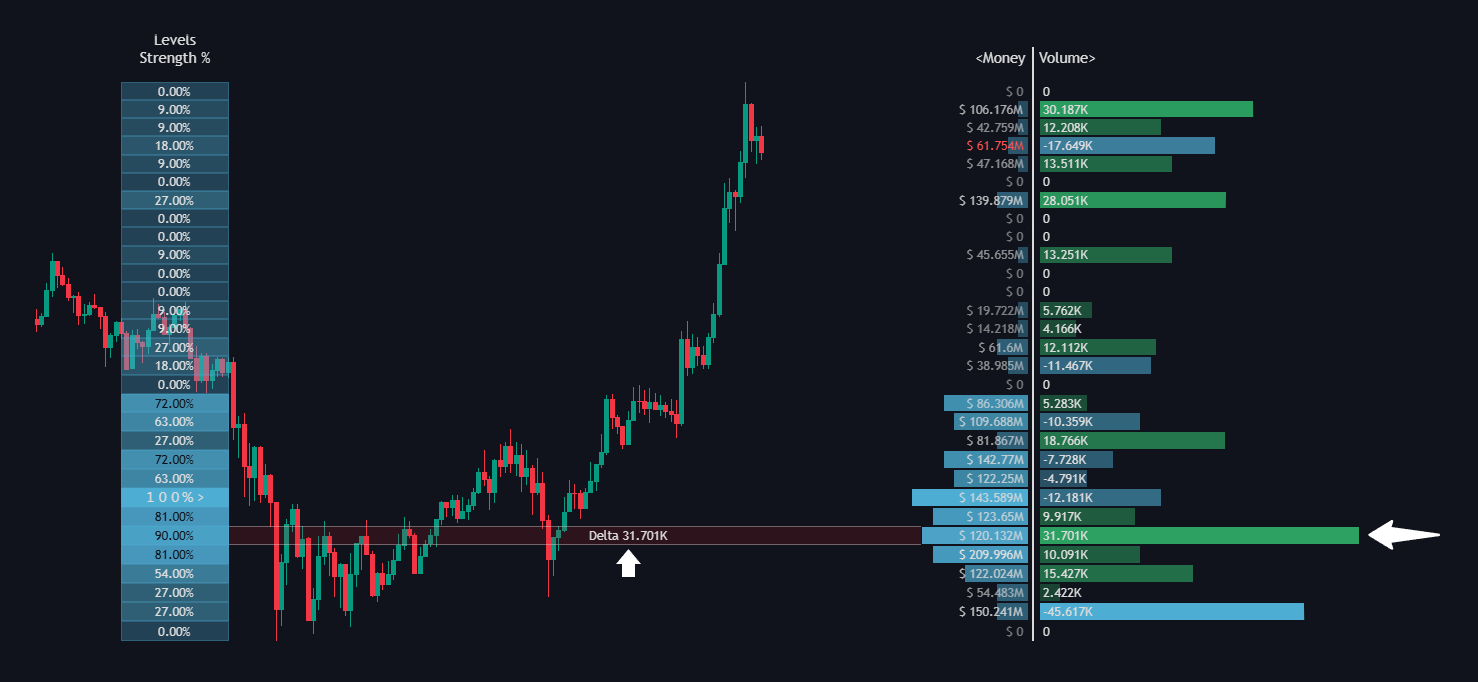
Delta +
Delta -
point of control indicates strong selling interest and shows the lowest volume level.
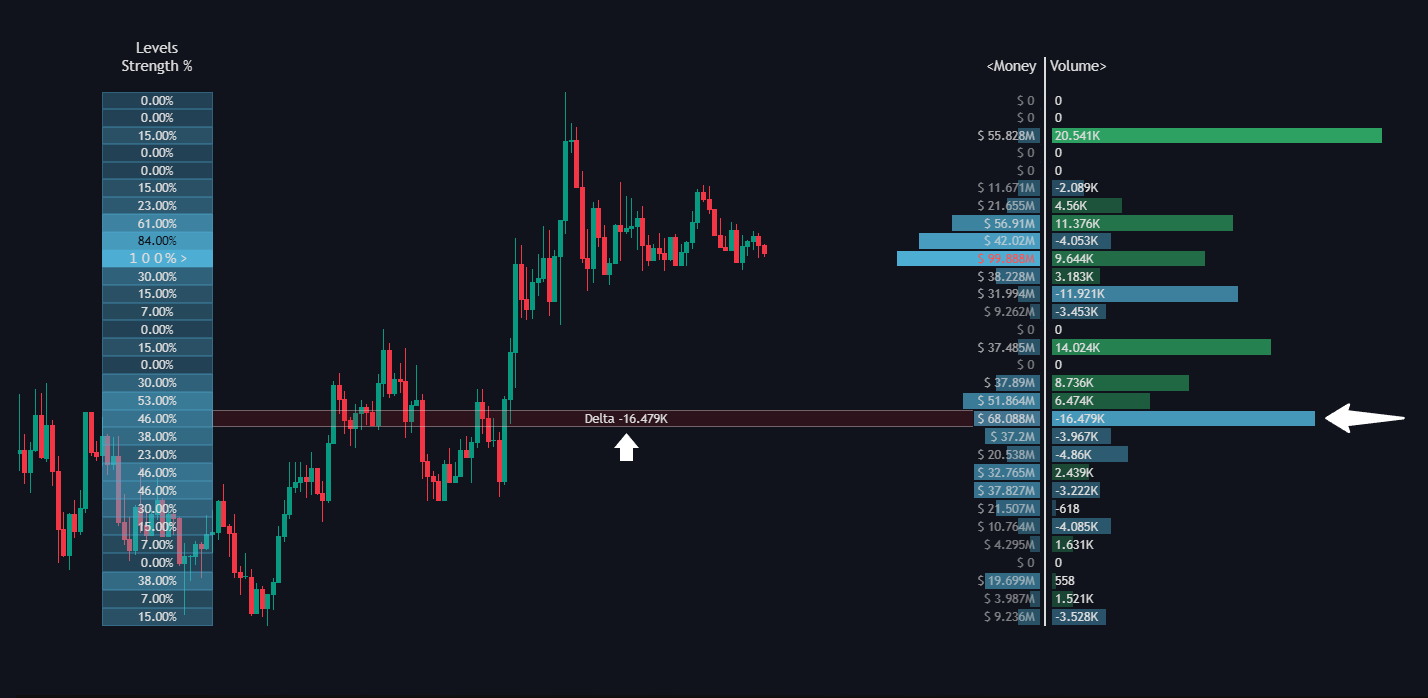
Delta -
Level 100%
highlights the level with the highest strength percentage based on trading activity.
This metric combines factors like volume, delta, and money flow, emphasizing the most dominant level within the range.
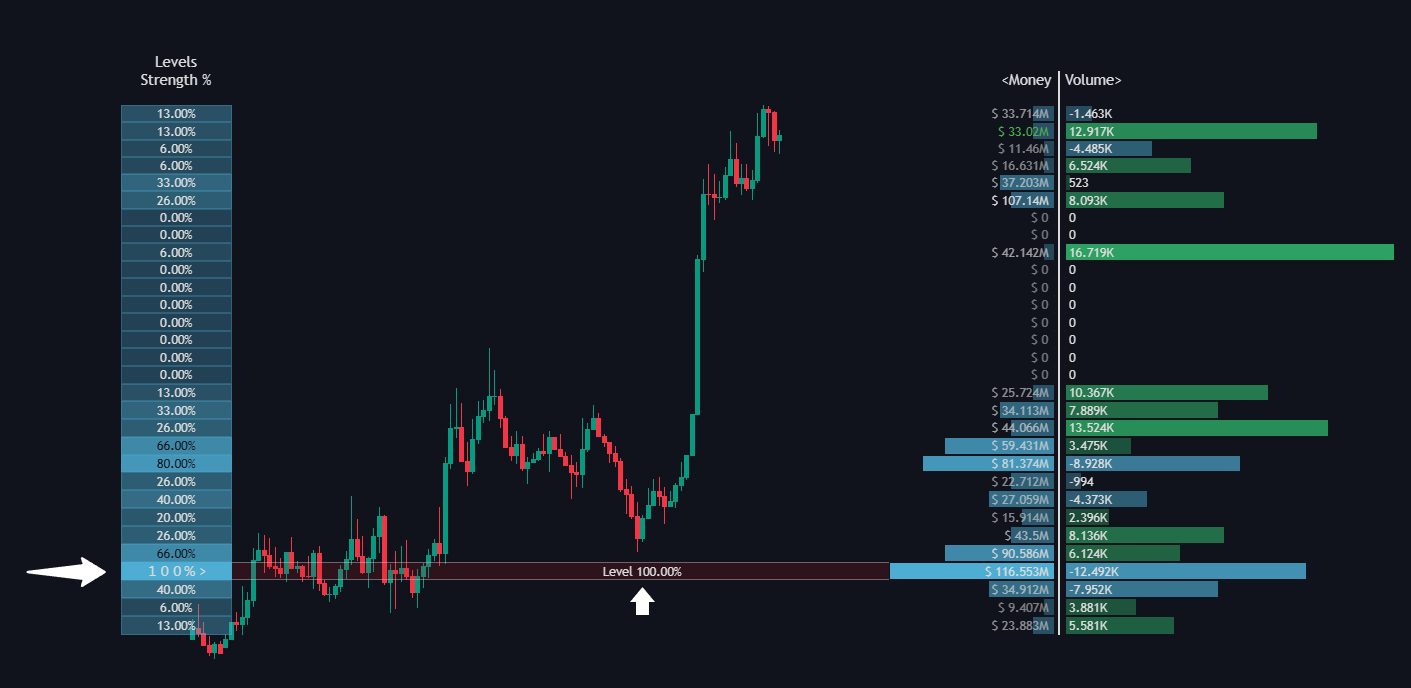
Level 100%
Volume Profile – VaH & VaL Added
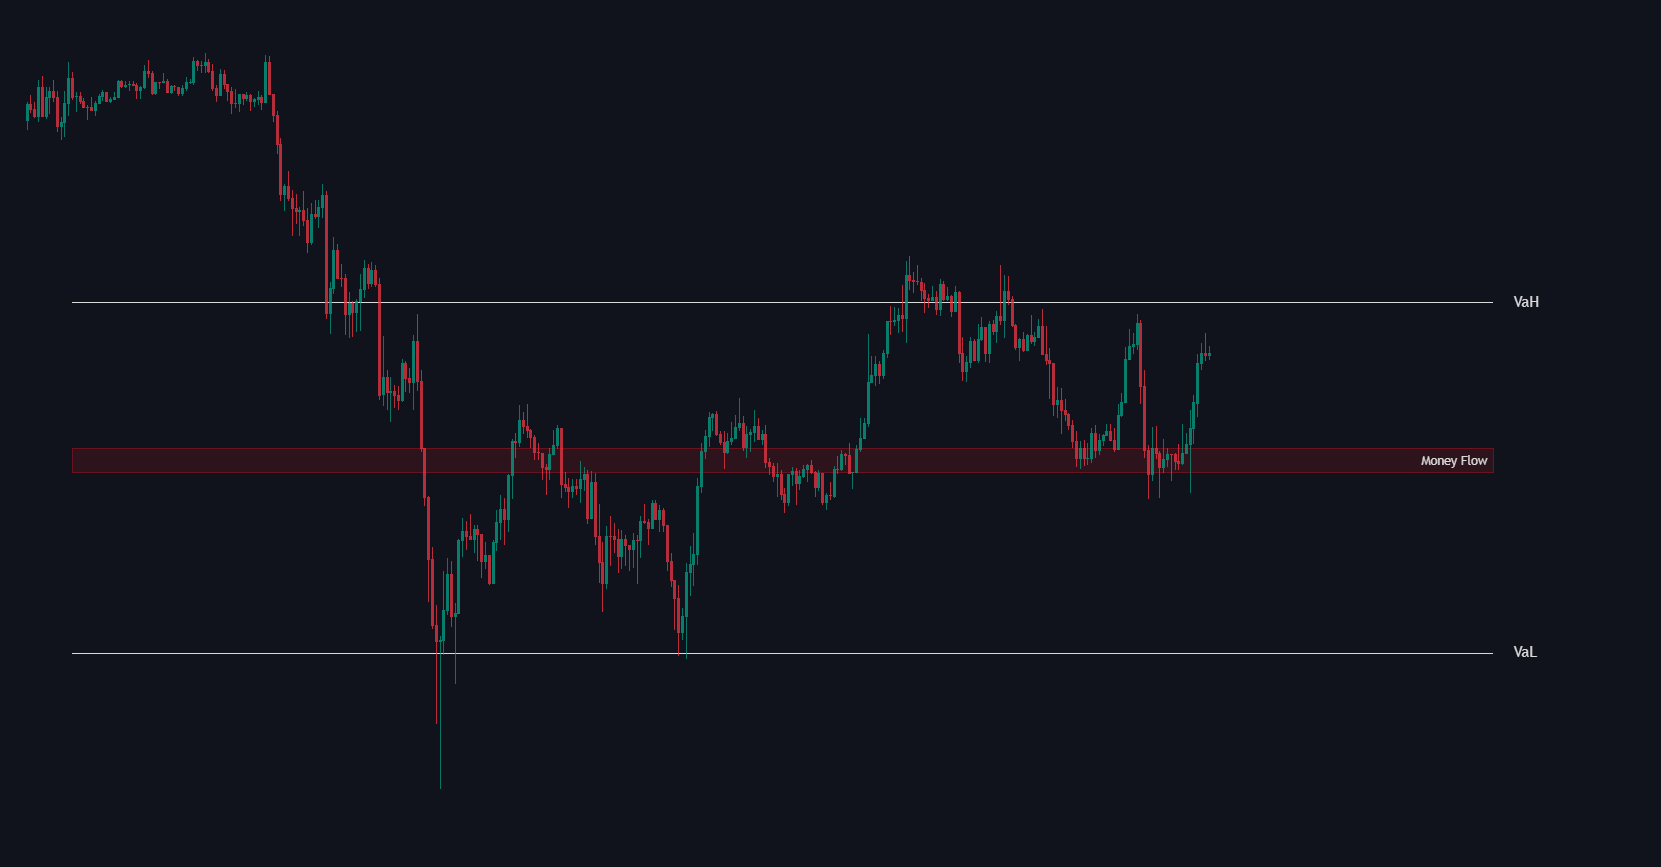
The volume profiler automatically calculates and plots the Value Area High (VaH) and Value Area Low (VaL) based on the selected Value Area percentage (default 70%).
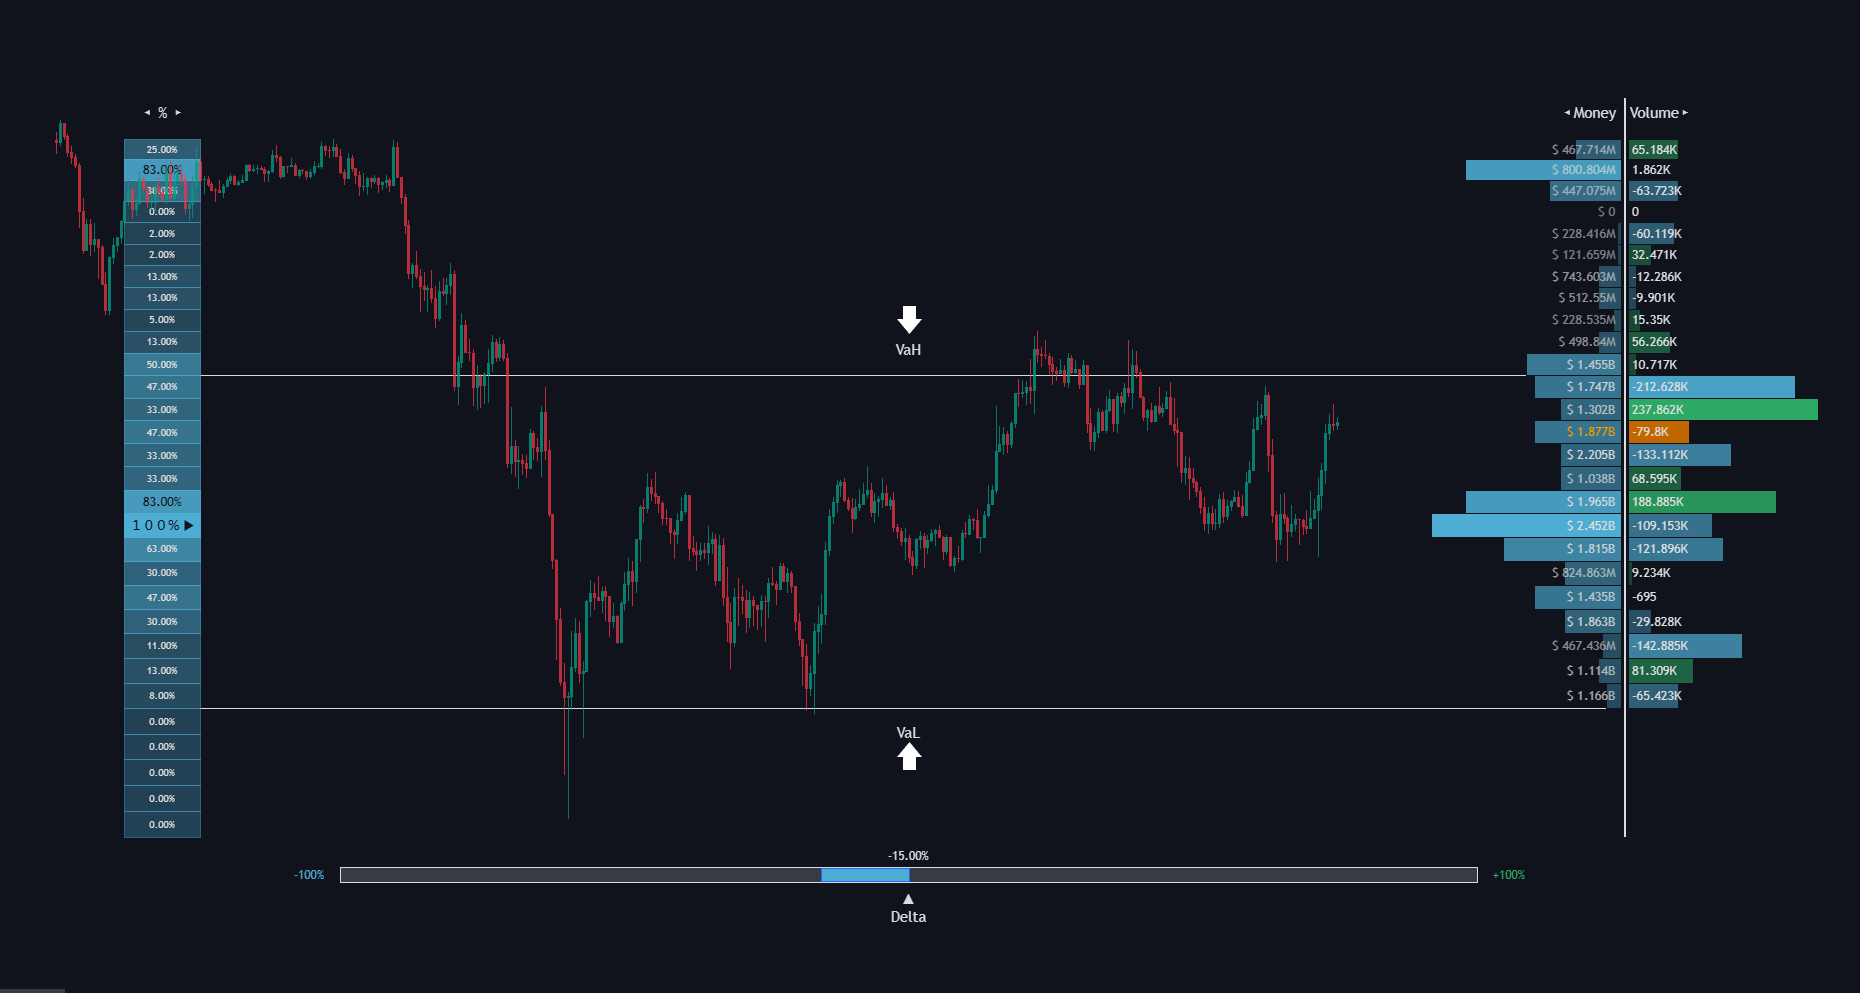
VaH marks the upper boundary of the value area where the majority of trading activity occurred, acting as a potential resistance or rejection zone.
VaL marks the lower boundary of the value area and often behaves as a support or reaction level.
Heat Map
Uses the strength percentage column as a heat map to visually emphasize high-importance levels.
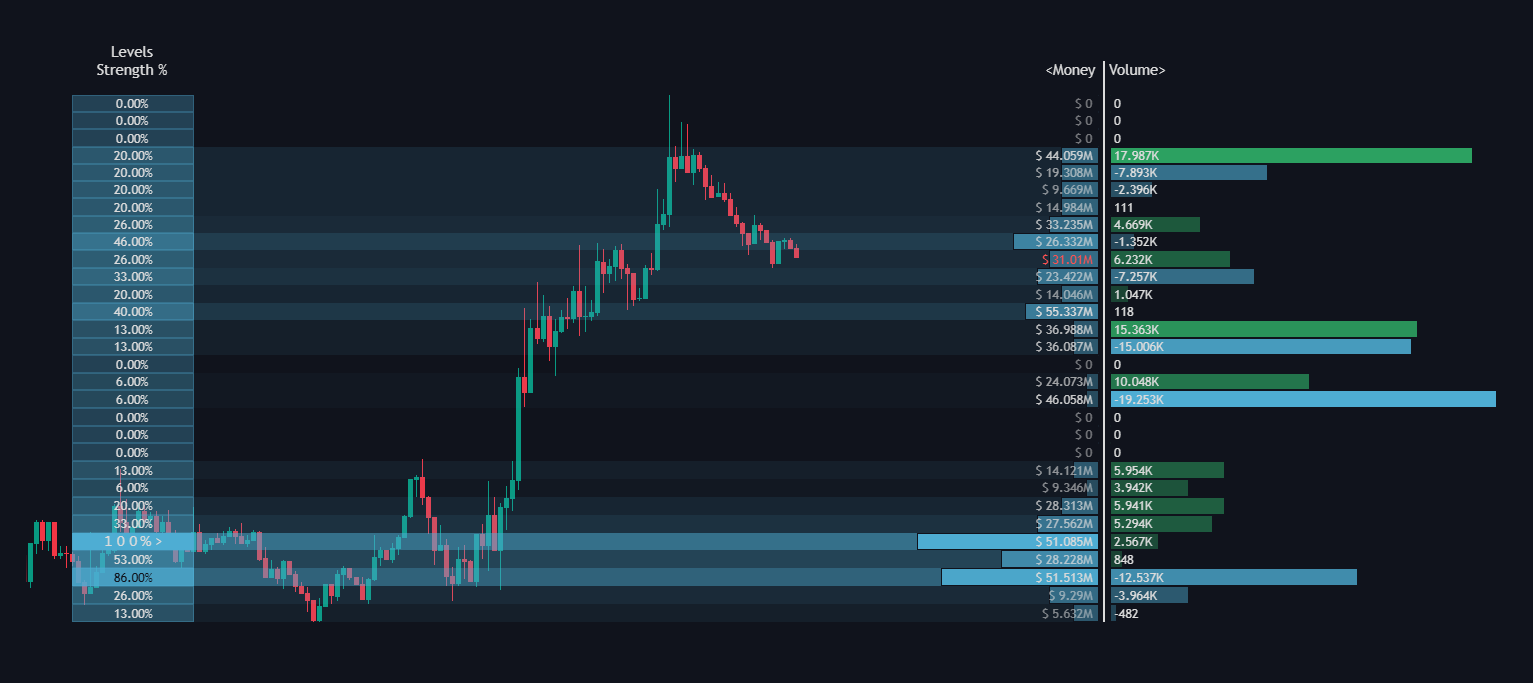
Heat Map
Delta Volume Gauge
Located at the bottom

this gauge shows the overall delta (difference between buying and selling volume), indicating macro trend direction—positive for an uptrend
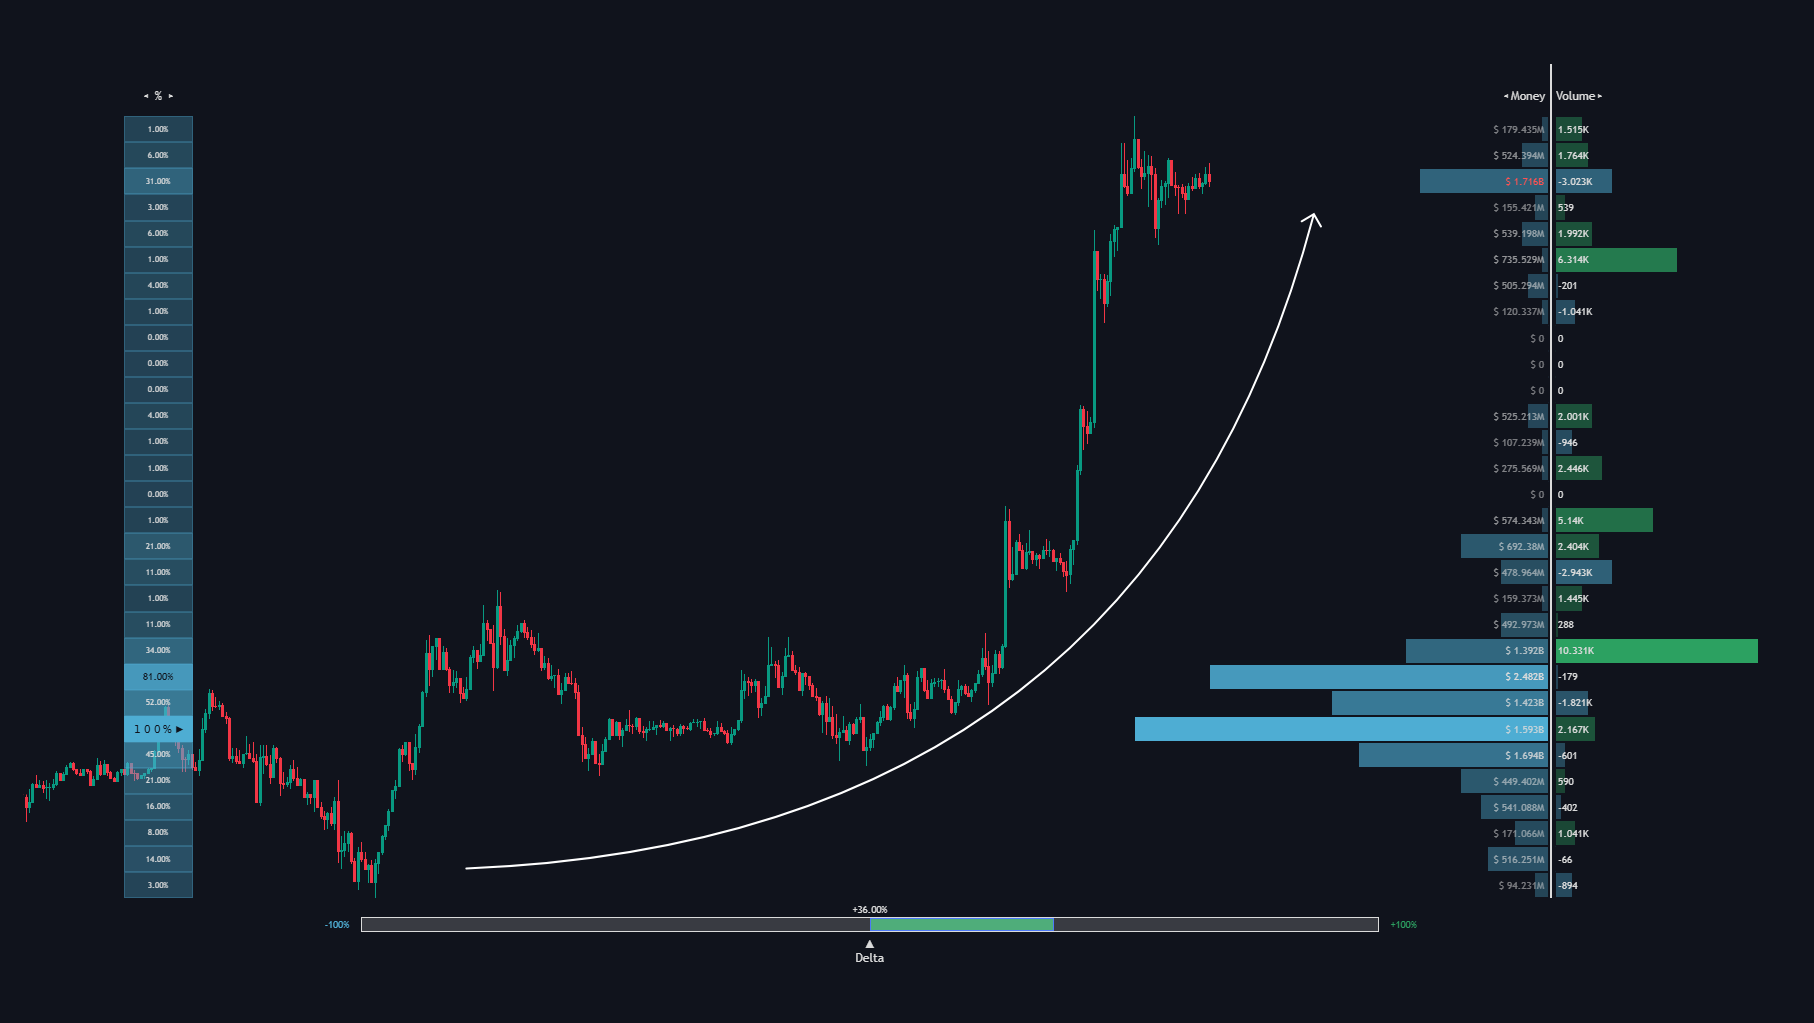
and negative for a downtrend
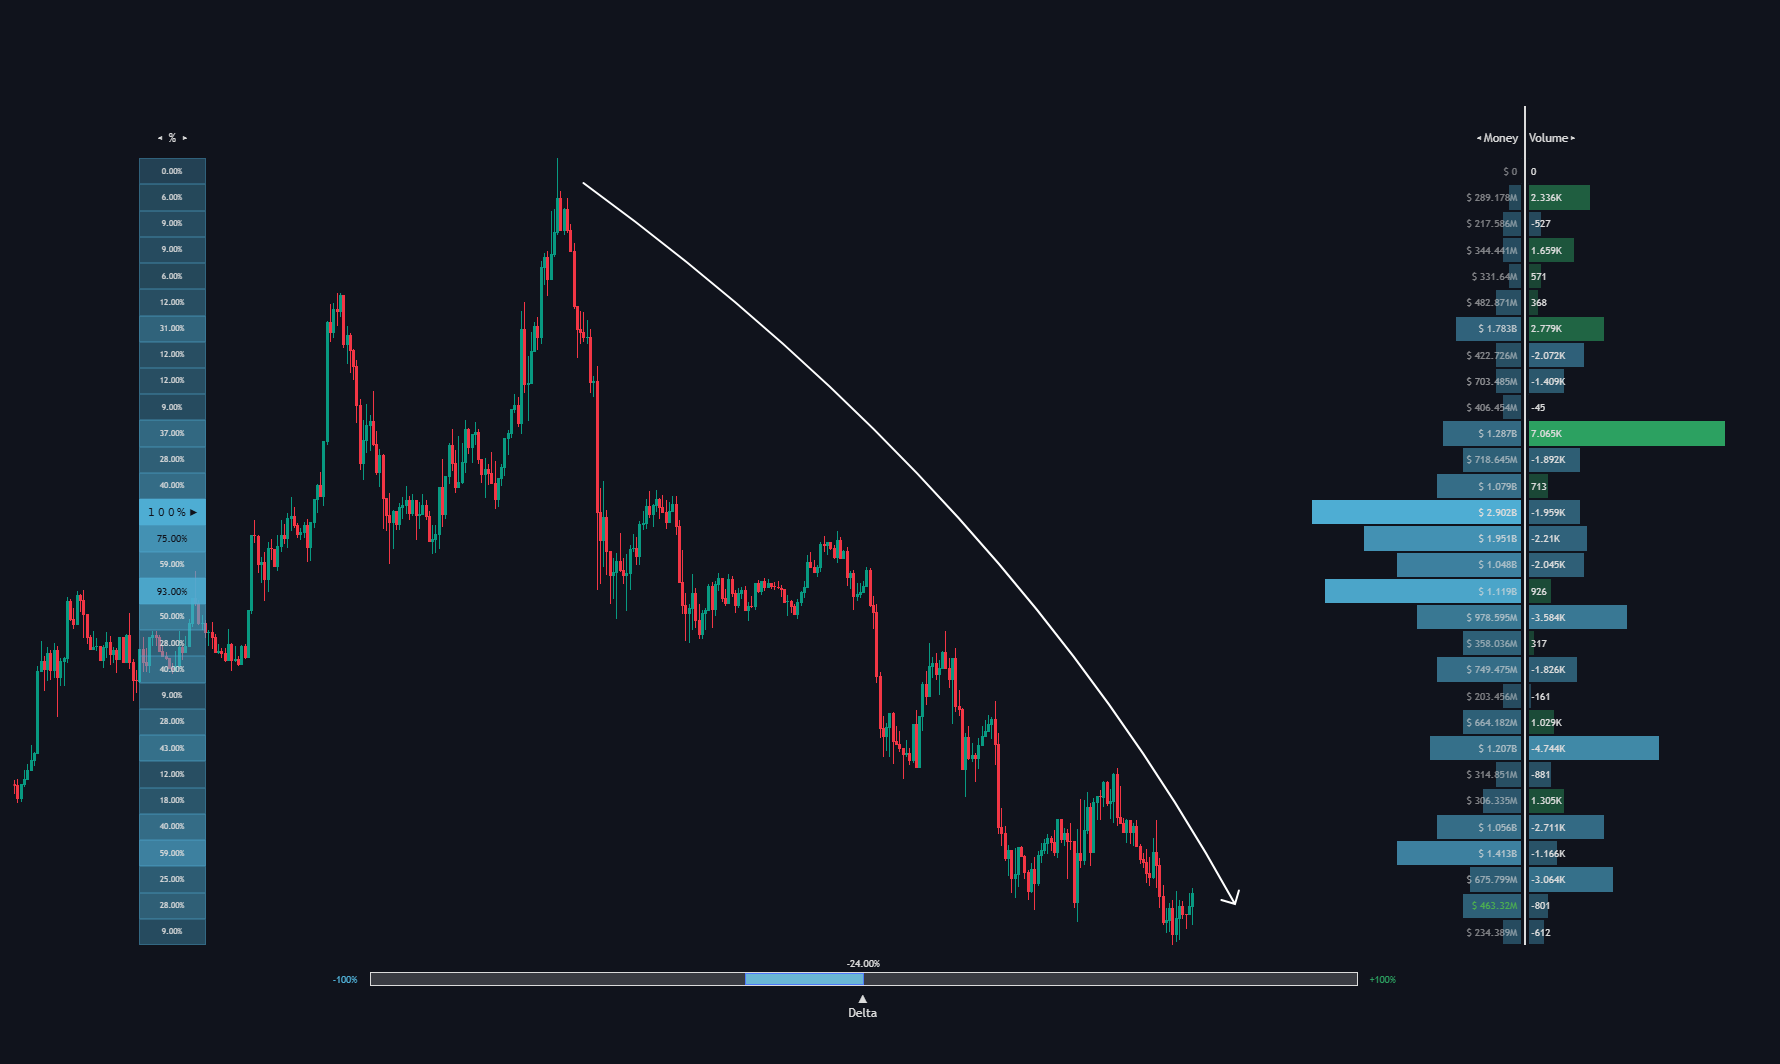
How to use
All of these elements work in concert, creating a symphony of market information. They empower you to:
- Spot key price levels with uncanny precision
- Foresee potential market turns before they happen
- Grasp the quality and strength of price moves
- Adjust your strategy on the fly as market conditions shift
- Make informed decisions backed by a clear view of the overall market trend
Settings
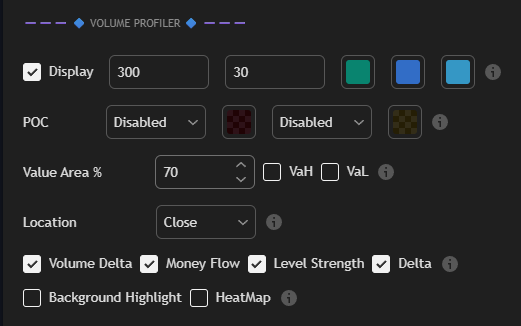
| Setting | Description |
|---|---|
|
|
| POC |
|
| Value Area% |
|
| Location | Positions the profile on the chart (Very Close, Close, Middle, Far). |
|
|
|
|
