

 X
 Discord
 Instagram
 YouTube
 ChatGPT
Consolidation Breakouts
Most breakouts fail because they are taken without a defined target, a defined risk, or any evidence of which side was in control inside the range.
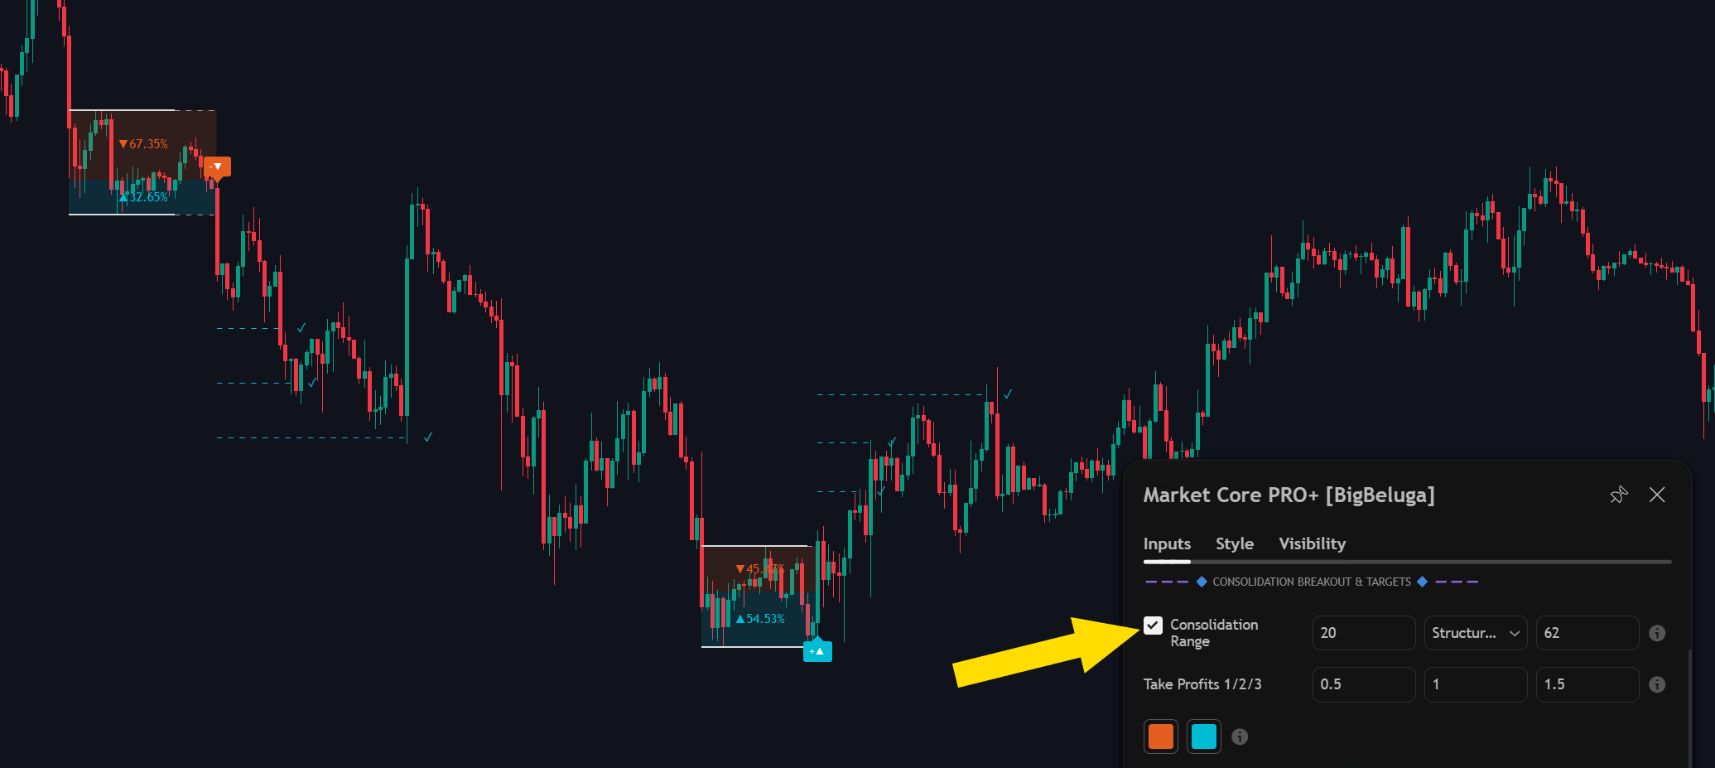
The breakout engine finds periods of compression, plots the levels where expansion becomes imminent, scores the balance of buying and selling inside the range, and then defines the trade on the other side of the break — three take profit levels plus a stop loss.
Detecting the compression
A range only qualifies when it is genuinely compressed. Three calculation modes decide what counts as compression:
- Volatility Contraction — the range has to narrow relative to recent volatility.
- Directional Efficiency — price has to move side to side instead of trending.
- Structural Density — the boundaries have to be tested repeatedly.
The range length sets how many bars are measured, and the buffer keeps consecutive channels apart so two overlapping ranges never draw on top of each other.
Take profit and stop loss
When price breaks a channel boundary, the engine plots three take profit levels derived from the height of the channel, using the TP 1 / 2 / 3 multipliers, and a stop loss on the opposite side of the range.
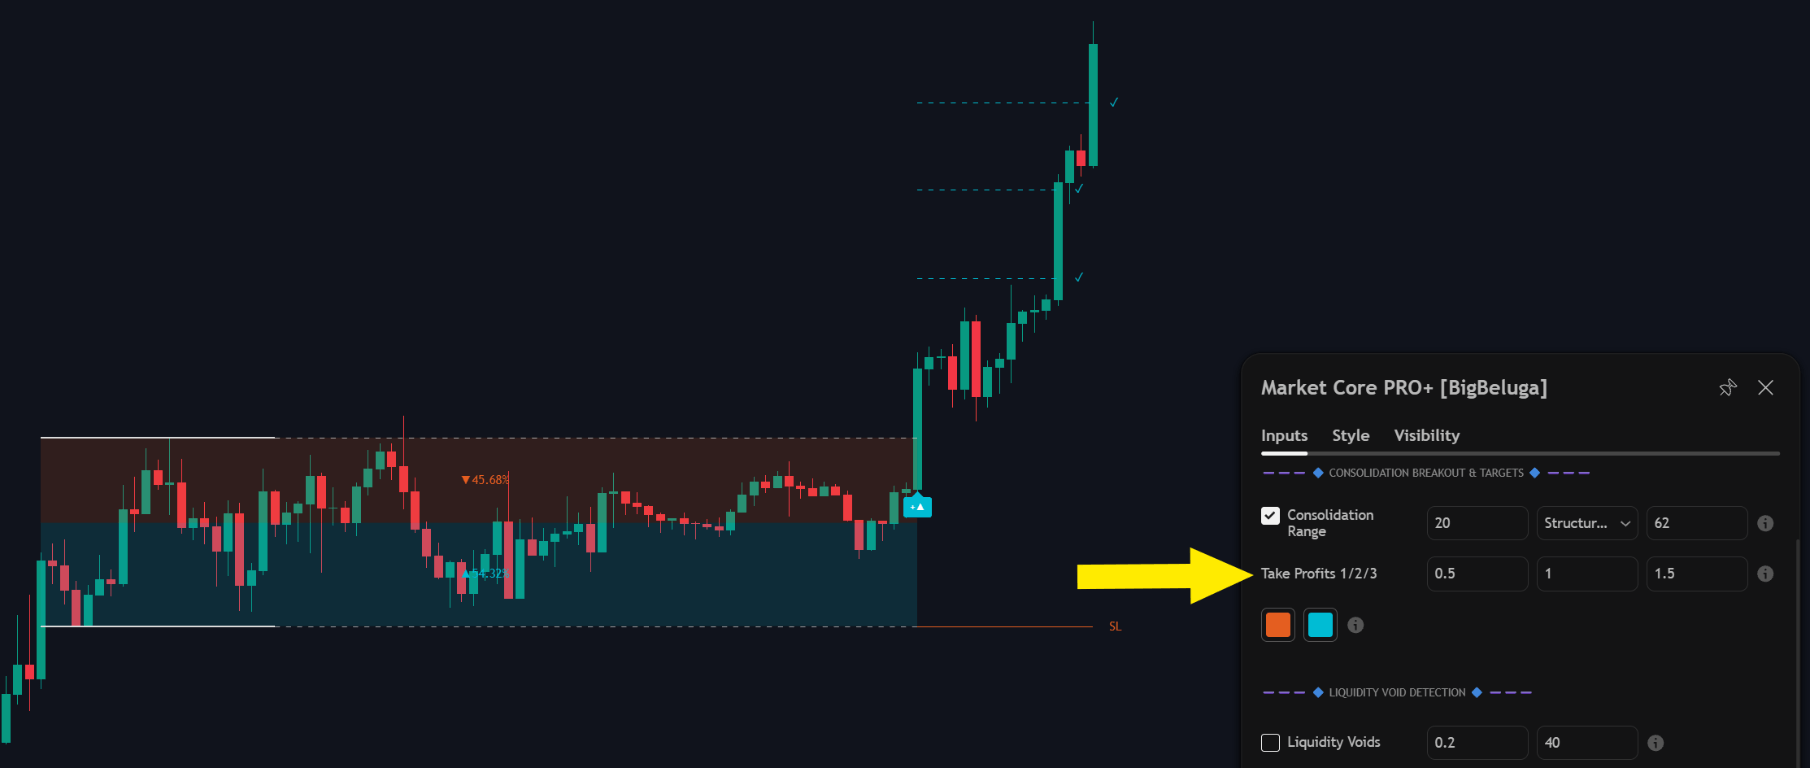
Each target turns into a tick once price reaches it, so a trade can be managed against the chart without watching the numbers by hand. Take profit lines and labels use the TP colour, the stop uses the SL colour — both are adjustable.
Volume delta grading
Every consolidation also carries the balance of aggressive buying (▲) and selling (▼) that happened inside it, and the box is coloured by the side that dominated.
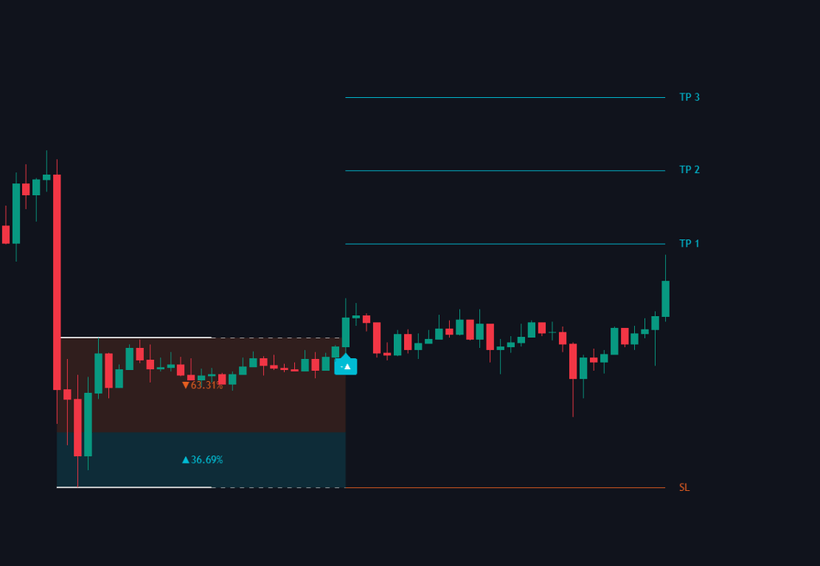
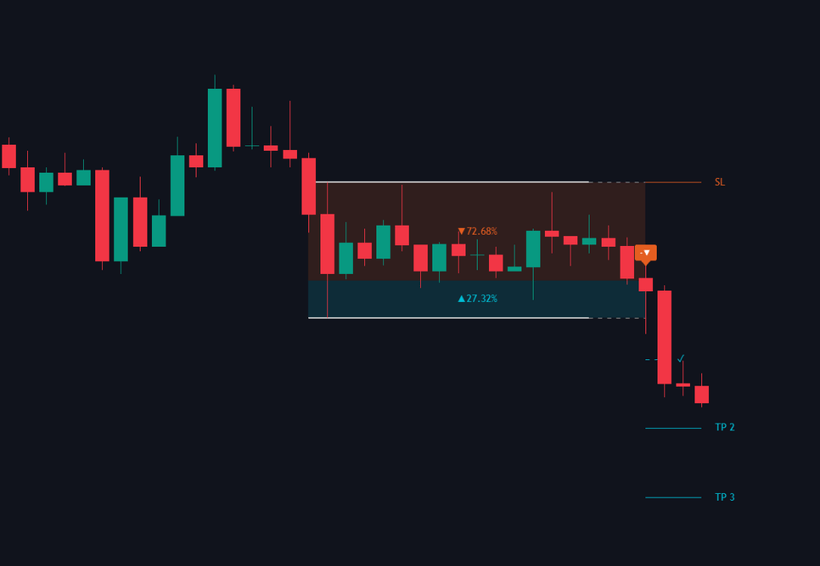
That split is the grading. A breakout that leaves in the direction of the dominant flow of the range is a different trade from one that fights it, and the two captures above show the same logic on a bullish and on a bearish break.
Take profit and stop loss hits from these setups are also available as signals for the Strategy Builder PRO+, which is how the breakout module becomes an automated rule.
Settings
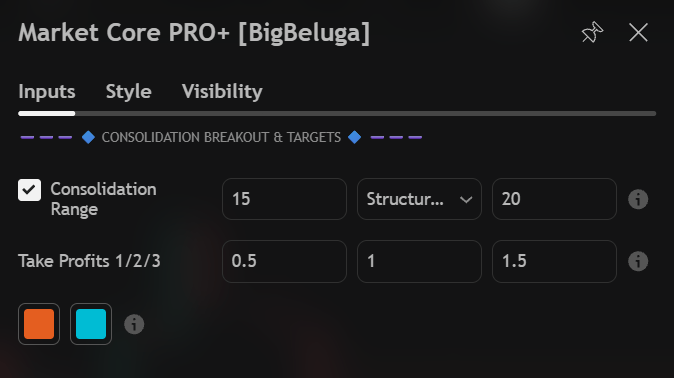
| Settings | Description |
|---|---|
| Consolidation Range | Enable or disable consolidation breakout detection. |
| Length | Range calculation length in bars. |
| Mode | How compression is qualified: Volatility Contraction, Directional Efficiency or Structural Density. |
| Buffer | Minimum number of bars between two channels, so overlapping ranges never stack. |
| Take Profits 1 / 2 / 3 | Channel-height multipliers for TP1, TP2 and TP3 (0.5 / 1.0 / 1.5 by default). |
| TP colour | Colour of the take profit lines and labels. |
| SL colour | Colour of the stop loss line and label. |
