
 X
X Facebook
 Discord
 Instagram
 YouTube
 ChatGPT
Long/Short Ratio
The Long/Short Ratio tool in BigBeluga Sonar gives traders a real-time snapshot of market sentiment by comparing the number of traders and volume positioned long versus short. It helps you understand crowd positioning and identify potential contrarian setups.

⚠ This feature supports only the following timeframes: 15m, 30m, 45m, 1h, and 1d. Make sure you're on one of these intervals to view accurate data.
What it shows
Long Ratio & Short Ratio (%)
Displays the percentage of accounts currently in long vs. short positions.

Long Volume & Short Volume
Shows the total trading volume placed on each side of the market.

Bar Chart Visualization
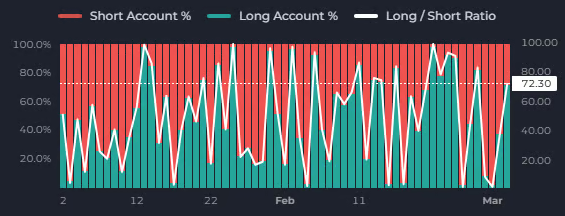
A dynamic chart comparing long and short account percentages over time. The blue bars represent long accounts, red bars show short accounts, and a white line tracks the long/short ratio.
How it helps
- Spot overly crowded positions that may signal upcoming reversals.
- Combine sentiment data with price action to confirm breakout or fake out scenarios.
- Monitor shifts in trader bias during consolidation or trend transitions.
Example use case
You notice a major resistance level being tested while the long/short ratio shows 85% of accounts are long. This heavy long bias could signal the risk of a flush or stop-hunt before any true breakout — giving you a chance to wait or even fade the move short-term.
