
 X
X Facebook
 Discord
 Instagram
 YouTube
 ChatGPT
Signals
The indicator uses a range of visual signals to highlight potential trading opportunities and momentum shifts:
SignalsBuy & Sell Signals
The Buy and Sell Signals Visualization with three-line markers identifies key reversal points of the Nautilus Oscillator
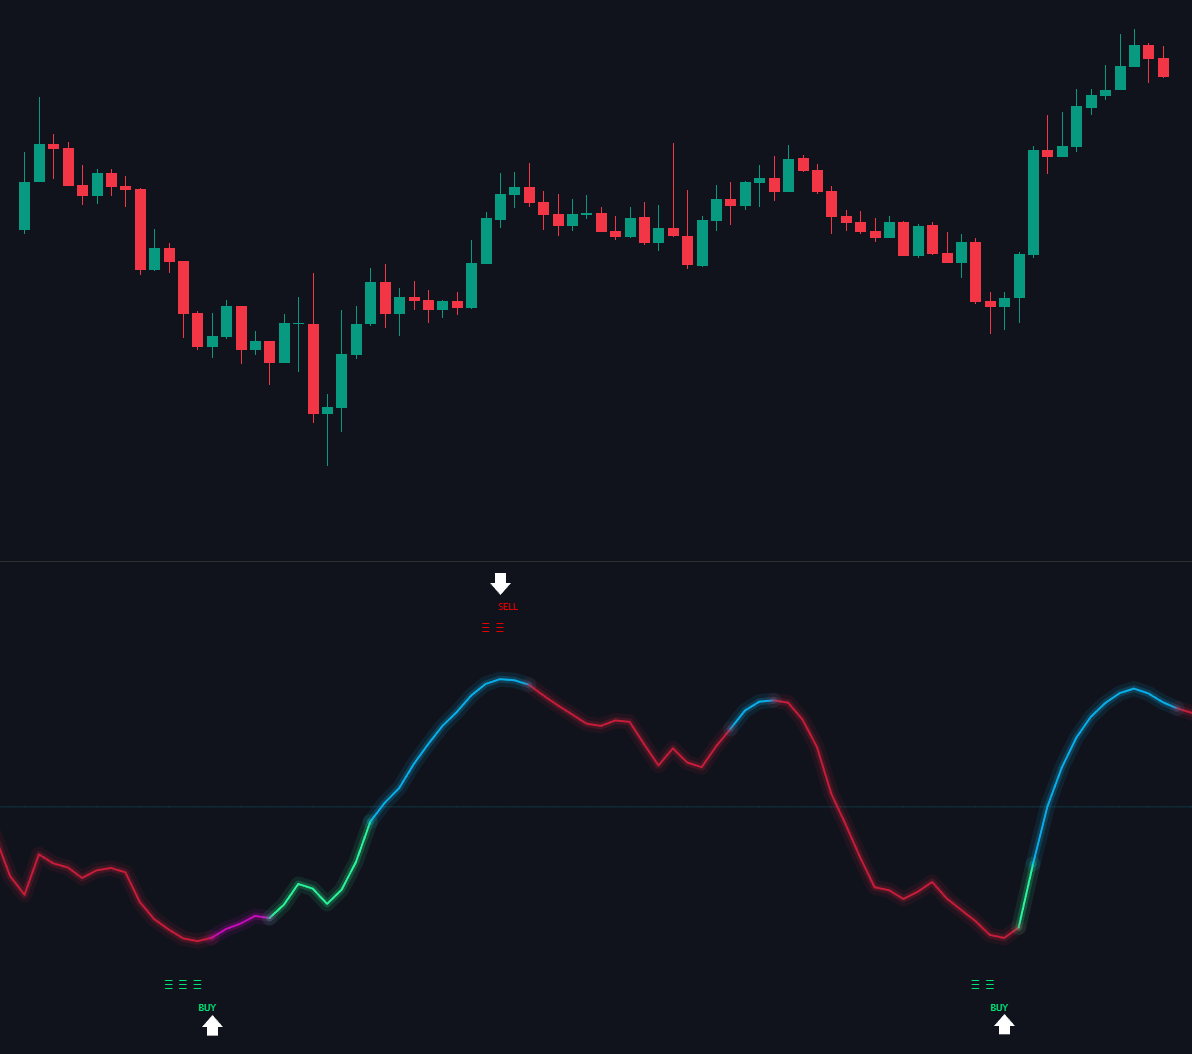
- Buy Signals: Marked by green triple lines below the oscillator, indicating potential upward reversals from oversold conditions or the start of a bullish momentum phase.
- Sell Signals: Marked by red triple lines above the oscillator, signaling potential downward reversals from overbought conditions or the end of bullish momentum.
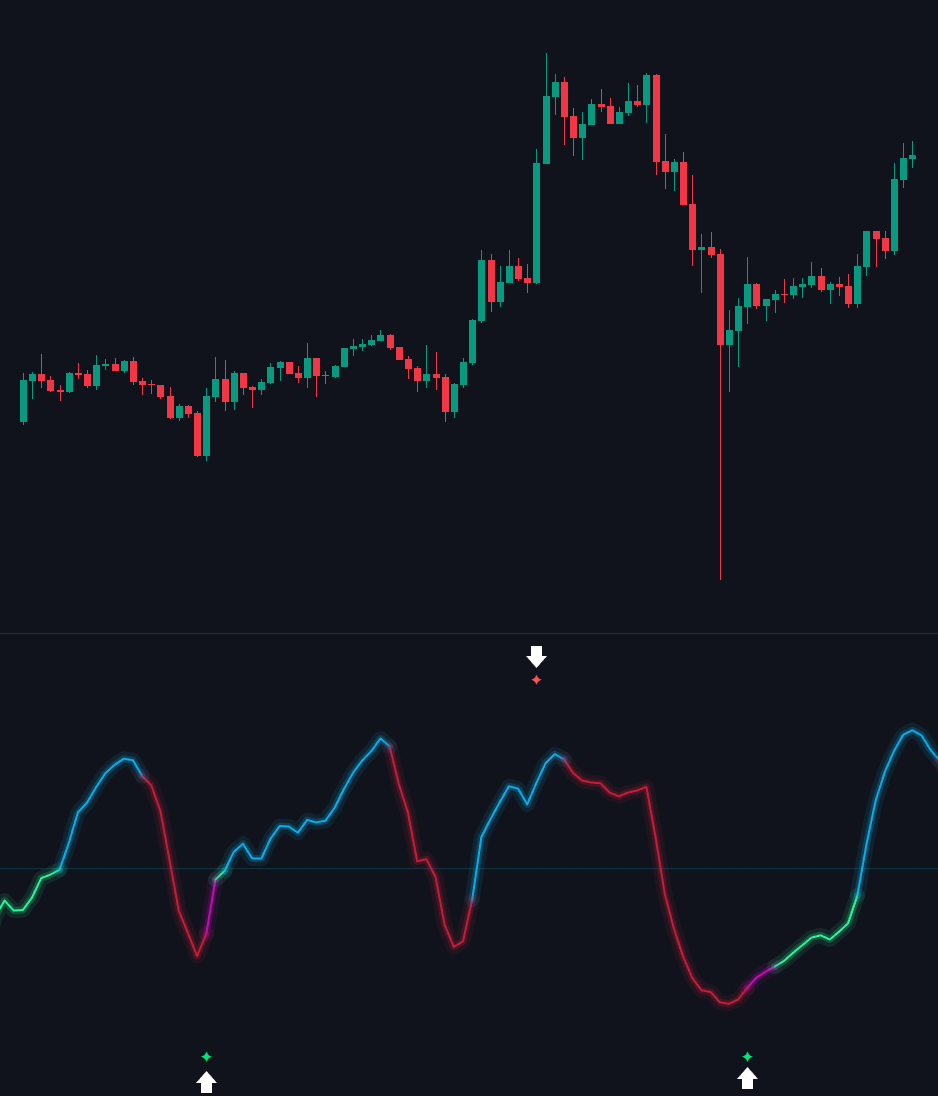
Diamonds (Bullish DipX and Bearish DipX)
These mark potential bullish or bearish reversal points, signaling that the current trend may be losing momentum and could reverse soon.
Bullish & Bearish Peaks
The Bullish and Bearish Peak Signals identify critical momentum peaks in the market:
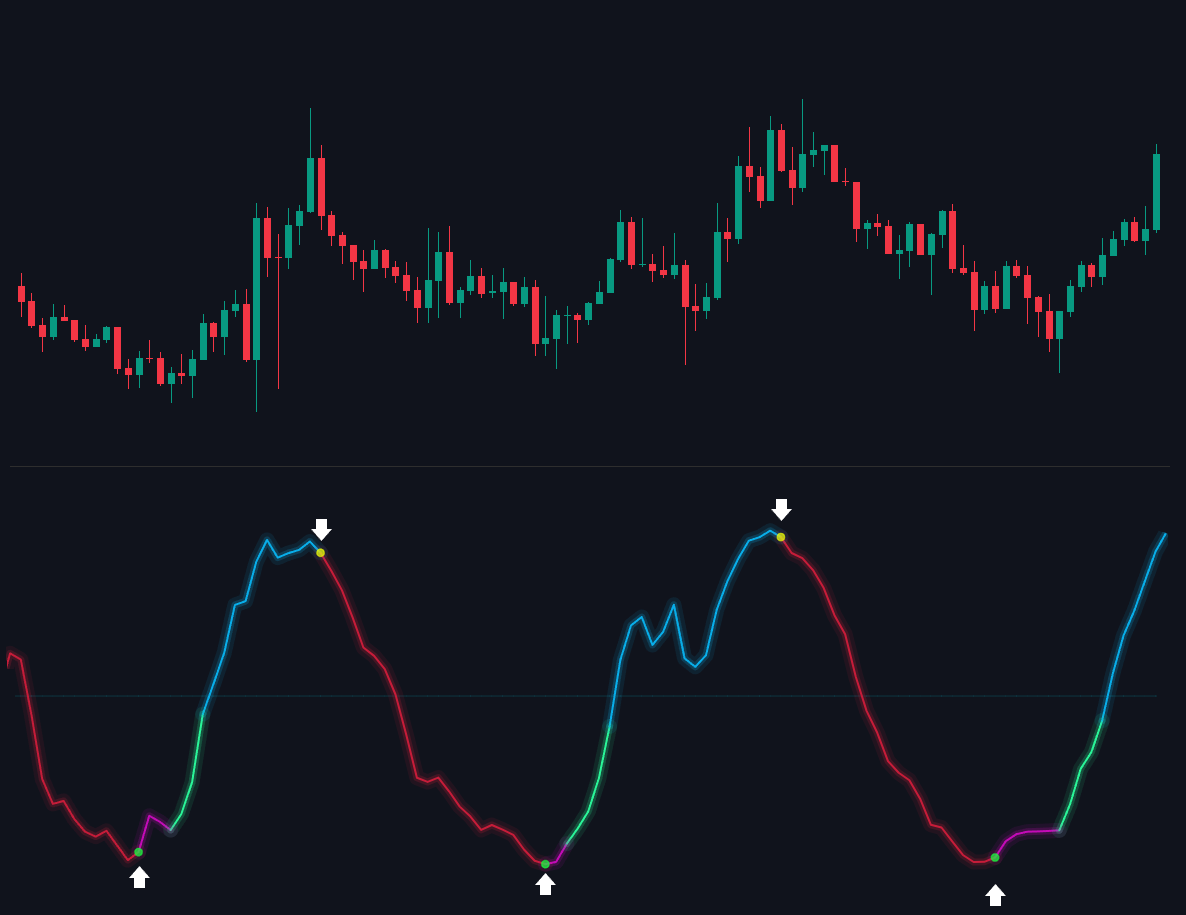
- Bullish Peak Signals: Indicated by green markers at the oscillator's lowest points, signaling a potential bullish reversal or a shift from oversold conditions to upward momentum.
- Bearish Peak Signals: Marked by yellow markers at the oscillator's highest points, indicating a potential bearish reversal or a shift from overbought conditions to downward momentum.
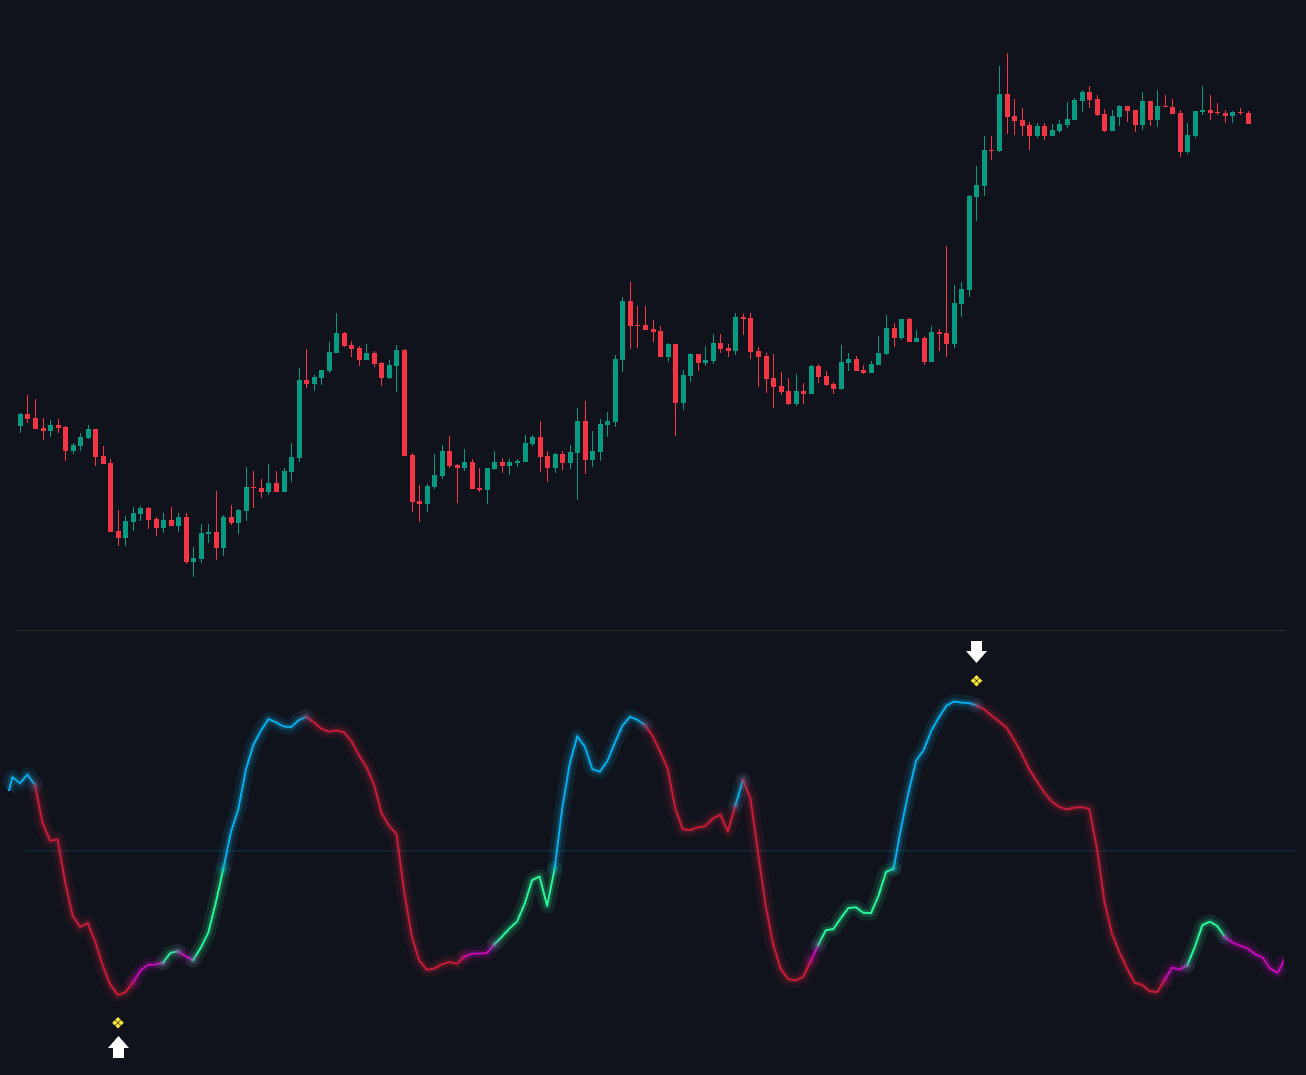
Yellow Diamonds (Overbought and Oversold)
These appear when the oscillator reaches overbought or oversold levels, alerting traders to potential exhaustion in the current price move.
Overbought conditions (at the top) suggest a possible downward correction, while oversold conditions (at the bottom) suggest a potential upward reversal.
Gapped Nautilus Signals
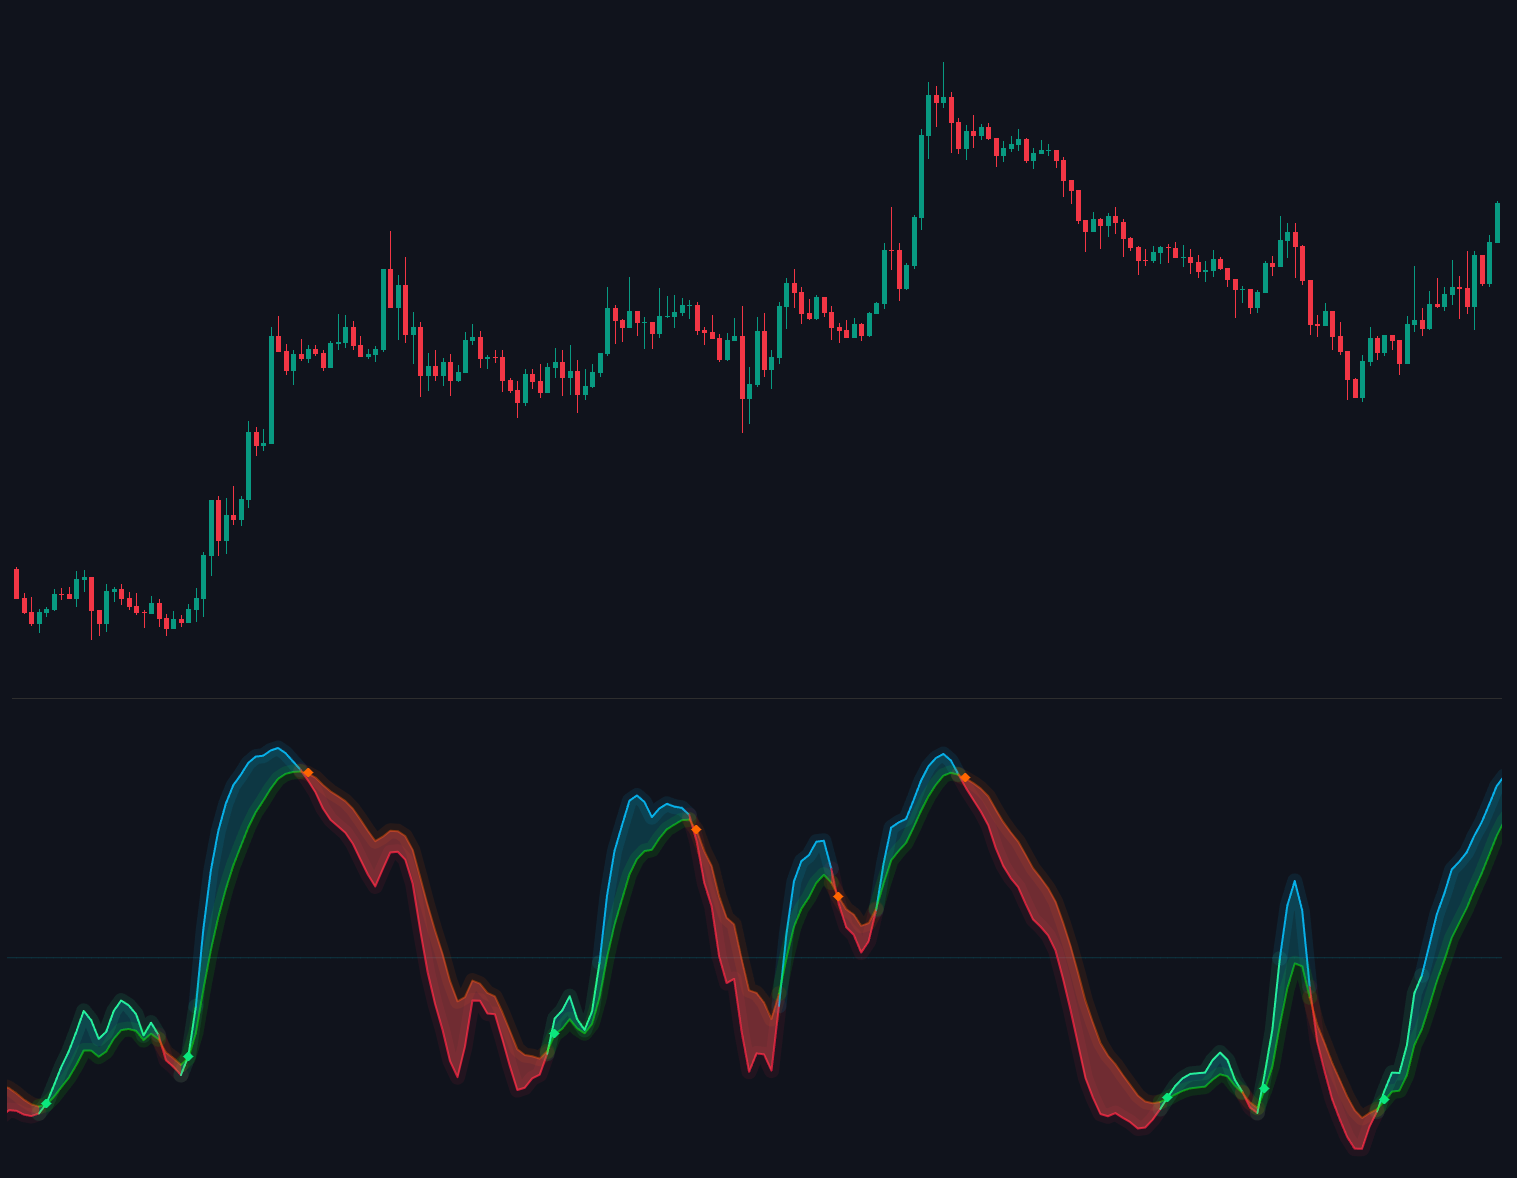
Gapped Nautilus alerts provide additional signals by tracking the interaction between the standard oscillator and the "Gapped" version of the script.
What are these signals?
These alerts appear when the normal Nautilus line crosses the Gapped Nautilus line. For a signal to be valid, this cross must happen within the Overbought (top) or Oversold (bottom) zones.
- Orange Diamond: Appears at the top (overbought zone) when the lines cross, signaling a potential downward move.
- Green Diamond: Appears at the bottom (oversold zone) when the lines cross, signaling a potential upward move.
How to enable them
These signals are hidden by default to keep the chart clean. To see them:
- Open the indicator Settings.
- Toggle the checkbox for Gapped Nautilus.

Once enabled, the diamonds will plot automatically whenever the crossing conditions are met in the extreme zones.
