

 X
 Discord
 Instagram
 YouTube
 ChatGPT
Relative Rotation Graph
The table tells you what fired. The graph tells you where each asset sits in the rotation. The Nautilus Mean Reversion Screener draws it beside the matrix, using the same assets and the same colours.
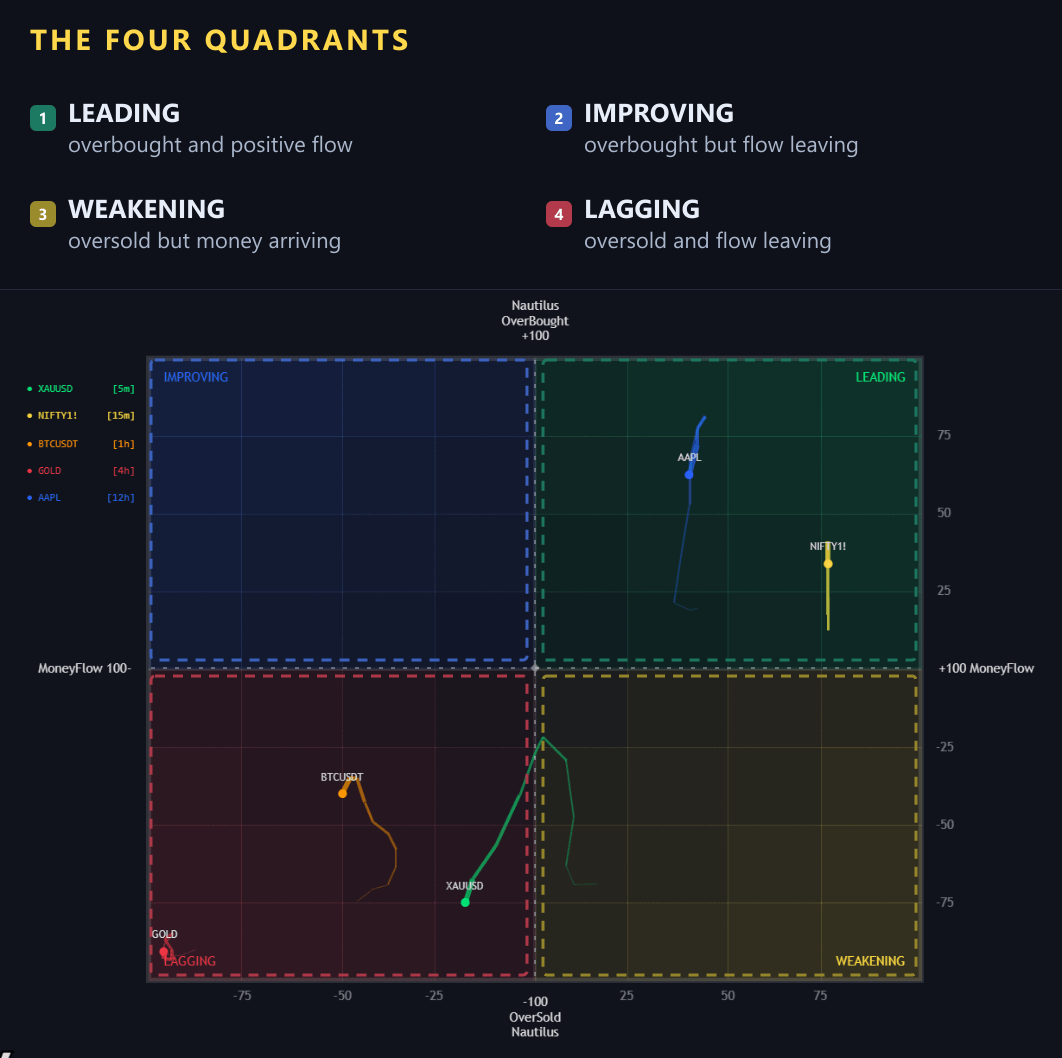
The two axes
- Vertical — the Nautilus oscillator, overbought at the top and oversold at the bottom
- Horizontal — money flow, negative on the left and positive on the right
An asset therefore plots as a point in a two-dimensional space: how stretched the oscillator is, and whether money is flowing in or out.
The four quadrants
| Quadrant | Where it sits | Meaning |
|---|---|---|
| Leading (green) | Overbought, positive flow | Stretched to the upside with money behind it |
| Improving (blue) | Overbought, negative flow | Stretched to the upside but flow is still leaving |
| Weakening (yellow) | Oversold, positive flow | Washed out but money has started to arrive |
| Lagging (red) | Oversold, negative flow | Washed out with money still leaving |
Each quadrant is labelled on the chart with the combination of oscillator and money-flow state that puts an asset there, so you never have to reverse-engineer the axes.
Trails
Every asset leaves a sweeping tail behind it. The dot is where it is now; the trail is the path it took to get there — usually a curve through two or three quadrants over the last stretch of bars.
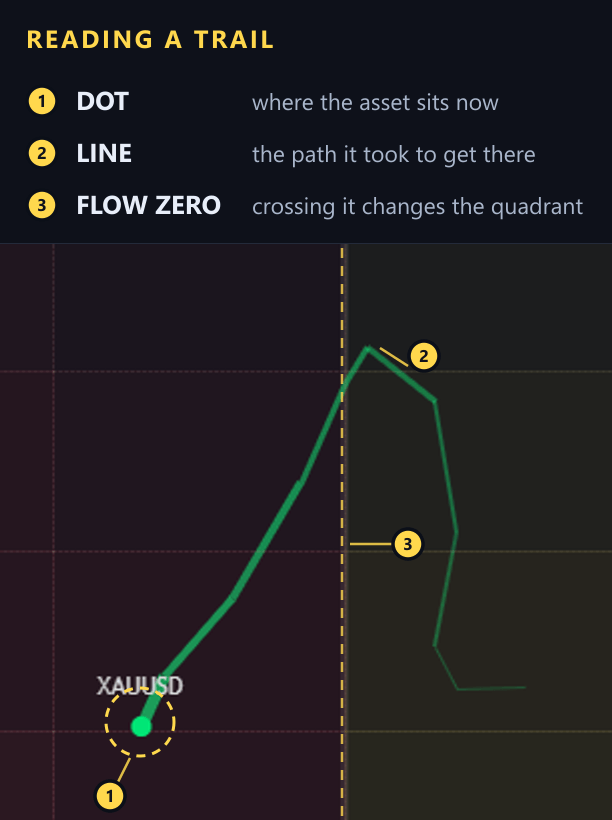
Read the line from its far end to the dot: that is the route the asset took, drawn bar by bar. XAUUSD here finishes on the left of the money-flow zero line, while the far end of its trail sits on the right — the quadrant it is in now is not the one it came from.
The trail is what turns the graph from a snapshot into a story. An asset sitting in Improving with a trail that came from Lagging is a turn in progress. The same asset in Improving with a flat trail has been there a while and the move may already be old.
The legend
Top left of the panel is the legend: each tracked asset with its timeframe and the colour used for its dot and trail. The colours follow the symbol slots, so you can match the graph back to the matrix columns in one glance.
Reading it with the table
The two panels answer different halves of the same question, and the useful patterns come from combining them:
- Improving quadrant, fresh Buy signal in the table — the rotation and the trigger agree, the strongest version of the setup
- Leading quadrant, Extreme (OB/OS) trigger — a strong asset that has run out of room, a pullback warning
- Lagging quadrant, Hidden Div — a downtrend that is still intact, so a counter-trend buy there is fighting both panels
- Weakening quadrant, MFI Divergence — flow leaving before price does, the earliest warning the graph can give
