

 X
 Discord
 Instagram
 YouTube
 ChatGPT
Mini Charts
Four markets, drawn on the chart.
The screener can draw up to four mini charts on the price axis. Each is a small candle chart of a tracked symbol with its gaps and structure lines, so you can confirm a row without changing the main chart.
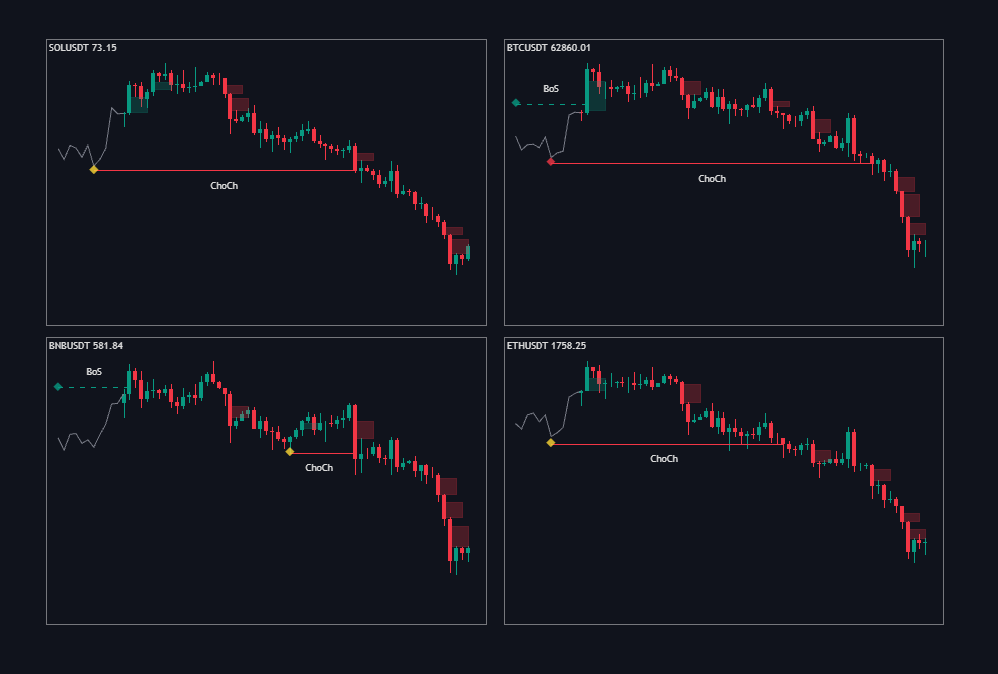
What each panel shows
- The symbol and latest price in the corner.
- Candles for that symbol.
- Fair value gaps as shaded boxes — green bullish, red bearish.
- The structure line, with
BoSandChoChlabels where events printed.
An open gap is a box price has not reached yet. When price trades into it, it becomes the retest the FVG column reports.
How to read it
- Use it as a second opinion. A
ChoChat the top of an advance is not the same as one in the middle of a range. - Follow the line, not the candles. The stepped line is what the screener reacts to.
- Check gap position. A gap below price and a gap above price mean two different trades.
Settings
- Four slots in Select Assets choose which symbols are drawn.
- Charts Offset moves the panels along the time axis.
- Two colour swatches set their bullish and bearish colours.
