

 X
 Discord
 Instagram
 YouTube
 ChatGPT
Nautilus Mean Reversion Screener
Six markets of exhaustion in one table.
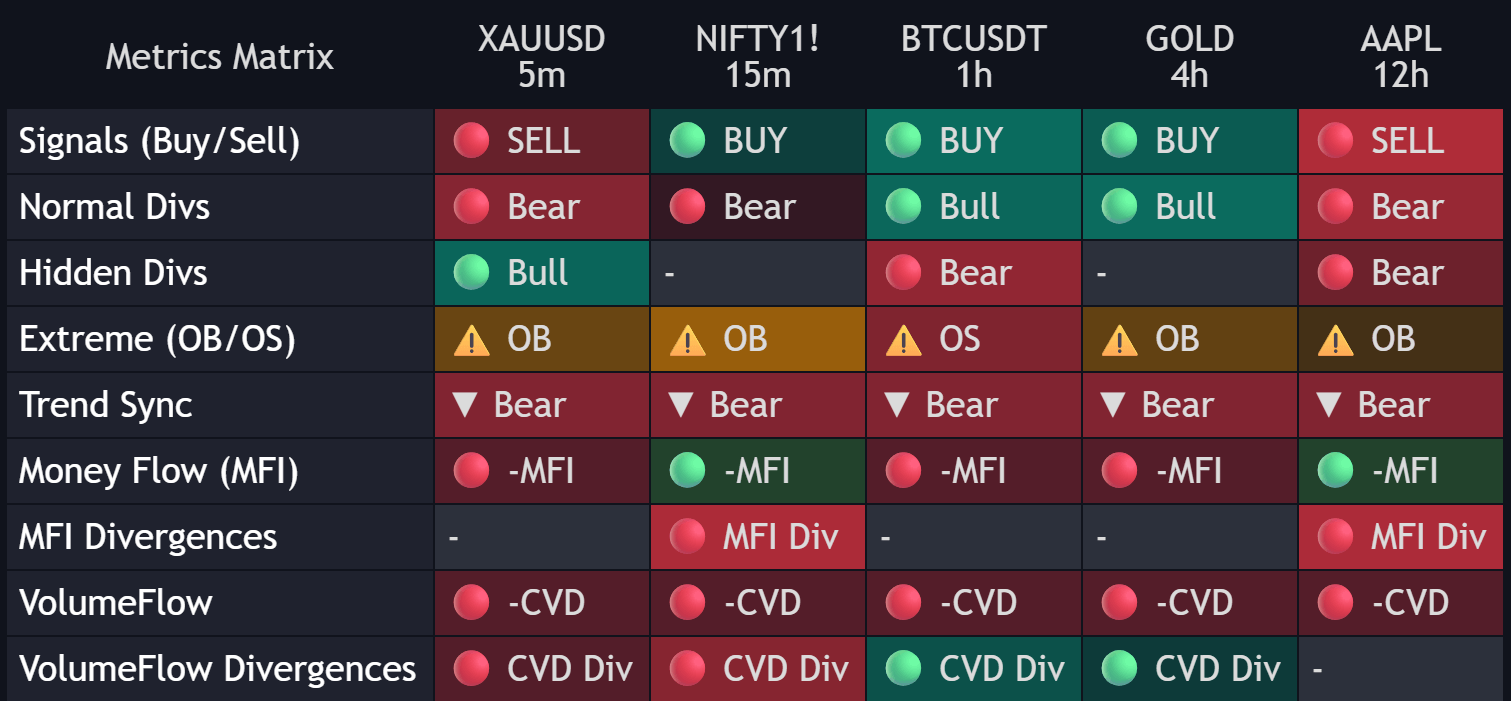
The Nautilus Mean Reversion Screener watches up to six symbols and timeframes at once. Every column is one asset; every row is one reading of how stretched that asset is — signals, divergences, extremes, trend agreement, money flow and volume delta.
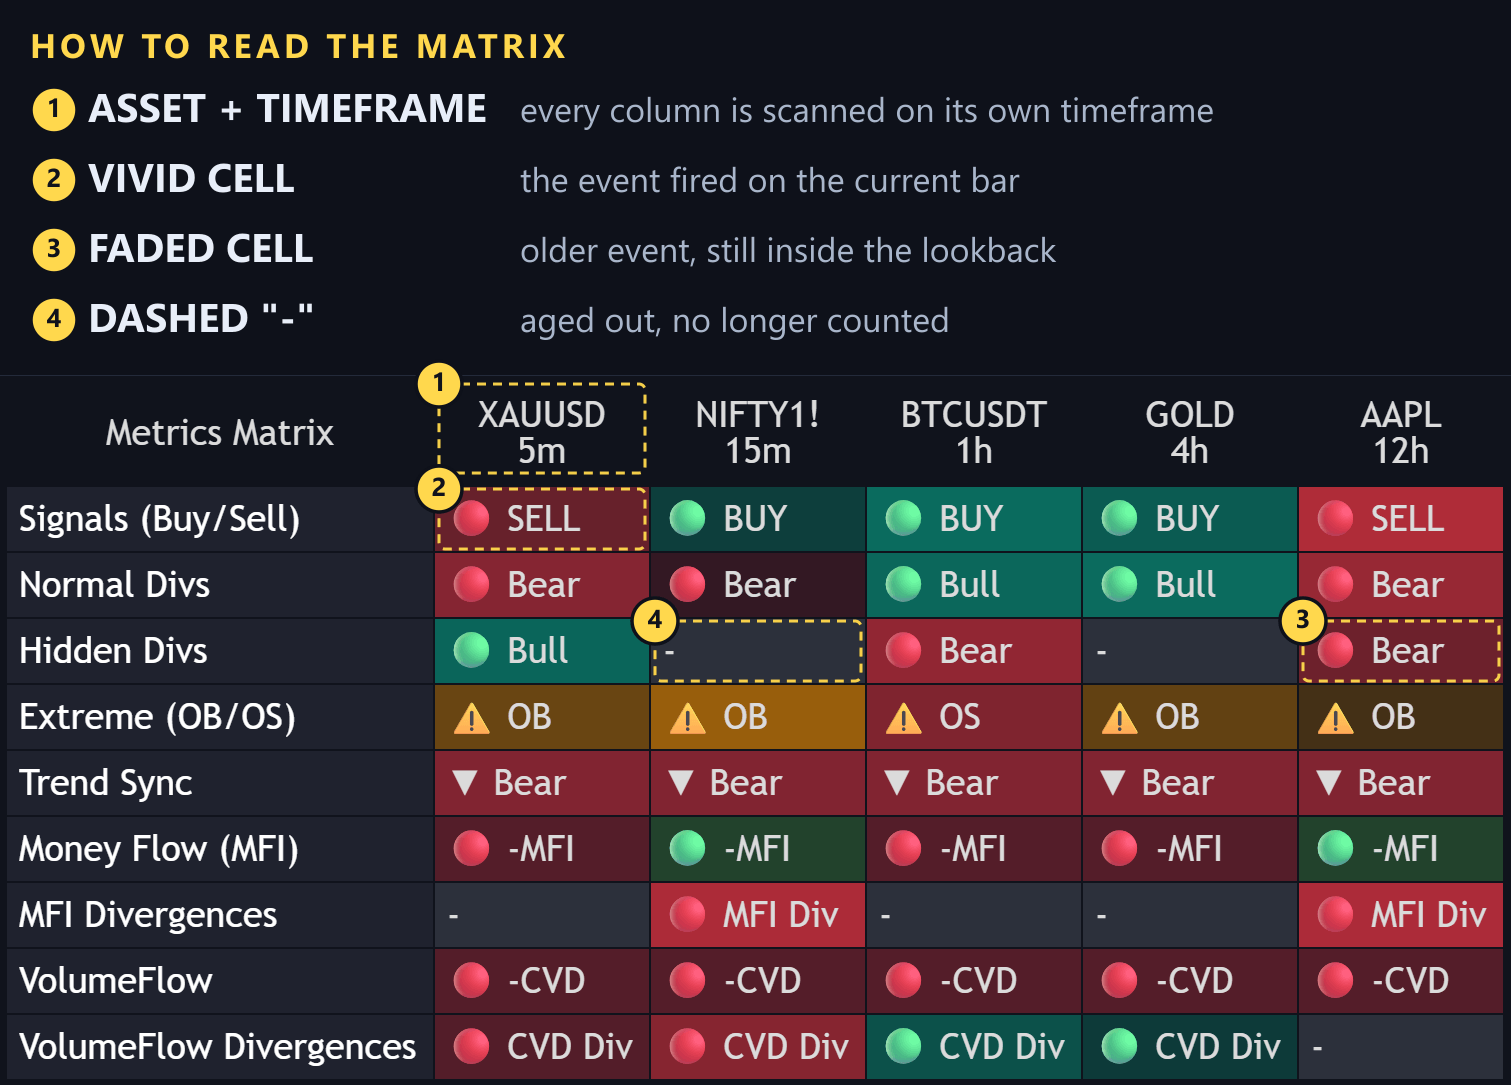
Nothing here is a price chart. The screener answers one question over and over: where is the market overextended right now, and how fresh is that reading.
Two panels, one scan
- Metrics matrix — a table of assets against metrics, colour-coded, with the age of every signal in bars. It is documented below.
- Relative Rotation Graph — the same assets plotted by oscillator stretch and money flow, with a trail showing where each one came from.
The table tells you what fired. The graph tells you where in the rotation the asset sits. Reading them together is the point.
The matrix
Each column is one asset, with its ticker and timeframe in the header. Each row is one metric, evaluated independently for every column — a one-day chart and a five-minute chart sit side by side without interfering.
The columns
Because the header shows the timeframe, a 1 day column and a 5 minutes column never get confused — the same signal means something different on each. A column disappears entirely when its symbol slot is disabled.
The rows
| Row | Shows |
|---|---|
| Signals (Buy/Sell) | The core mean reversion trigger for the selected preset |
| Normal Divs | A classic divergence between price and the oscillator |
| Hidden Divs | A continuation divergence inside a trend |
| Extreme (OB/OS) | The oscillator leaving overbought or oversold |
| Trend Sync | Whether the broader structural bias agrees |
| Money Flow (MFI) | Inflow or outflow, with a + or - for expanding or cooling |
| MFI Divergences | Price and money flow disagreeing |
| VolumeFlow | Cumulative volume delta, aggressive buyers against sellers |
| VolumeFlow Divergences | Price and delta disagreeing |
Every row can be switched off. See Settings.
Reading the colours
Vivid means fresh — the signal fired on the current bar (0 bars ago). As bars pass, the cell fades out, and when the age crosses the Signals Lookback it becomes -. Hovering a cell prints the exact bar count and the context, for example Sell Signal detected 57 bars ago.
So a bright column is a market that just moved. A faded column is history you can ignore.
Layout
Three inputs shape the panel: Display Screener shows or hides it, Position moves it, and Size changes the text size so more columns fit in view. If the table overlaps your candles, change the position rather than moving your chart.
How to use it
Hunt for confluence
Look for a column where several cells light up at once — a Buy signal, a bullish Normal Div and a positive MFI on the same asset. That is the highest-probability mean reversion setup the screener can show.
Watch the rotation
Open the Relative Rotation Graph and find the asset moving into Improving. Then check the table: if a fresh signal already fired on that asset, the turn is being confirmed rather than predicted.
Spot exhaustion inside strength
An Extreme (OB/OS) trigger on an asset sitting in Leading is a trend that has run out of room. That is a pullback warning, not a reversal call.
Let it scan
Tick the events in Alert Settings and step away. The alert fires on whichever asset trips first, and it carries the ticker, the timeframe and the price.
Setup
Add the screener
Add Nautilus Mean Reversion Screener [BigBeluga] to any chart.
Pick assets
Enable up to six slots and give each one a ticker and a timeframe. Mixing timeframes is encouraged — the screener handles them independently.
Choose a preset
Scalper, Day Trader or Swing Trader recalibrates every engine at once. See Settings.
Shape the panels
Position and size the table, and switch the Relative Rotation Graph on or off depending on how much room the chart has.
Add alerts
Tick the events you care about in Alert Settings, then create a normal TradingView alert on the indicator.
The Nautilus engines behind the rows are the same ones documented in the Nautilus PRO+ toolkit, so the concept pages there explain what each reading means.
