
 X
X Facebook
 Discord
 Instagram
 YouTube
 ChatGPT
Volume Flow
VolumeFlow (CVD) Histogram is a sub-pane technical indicator that visually maps the net institutional buying and selling pressure behind price action.
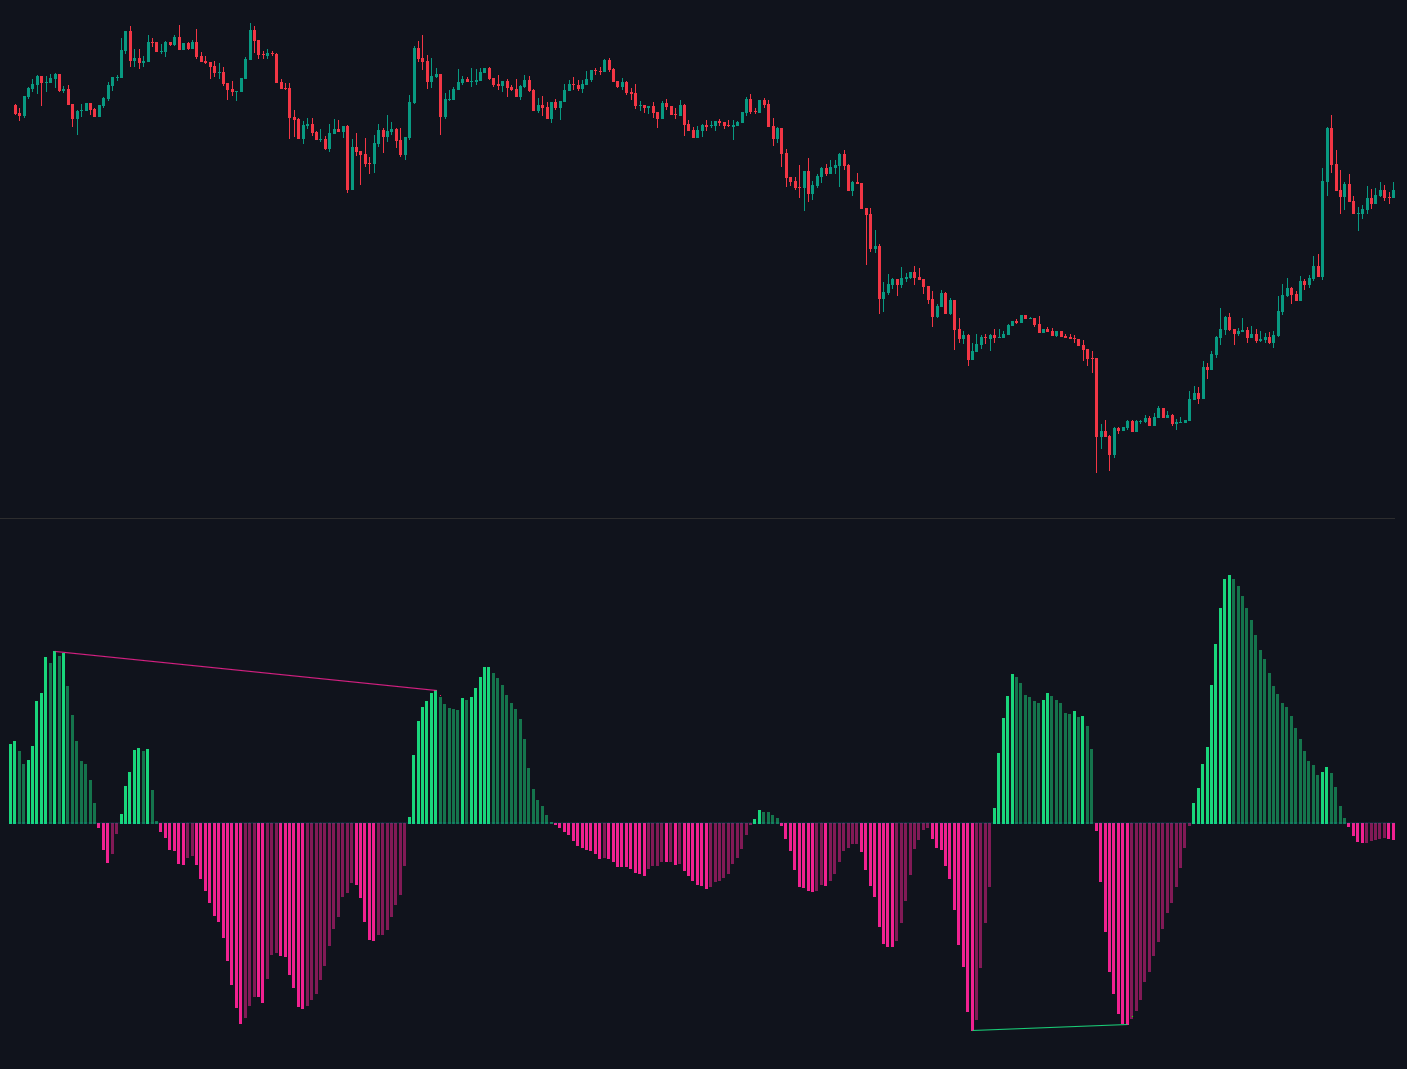
By converting raw Cumulative Volume Delta into a responsive oscillator, it reveals hidden accumulation and distribution phases that traditional volume bars completely miss.
How to Read VolumeFlow
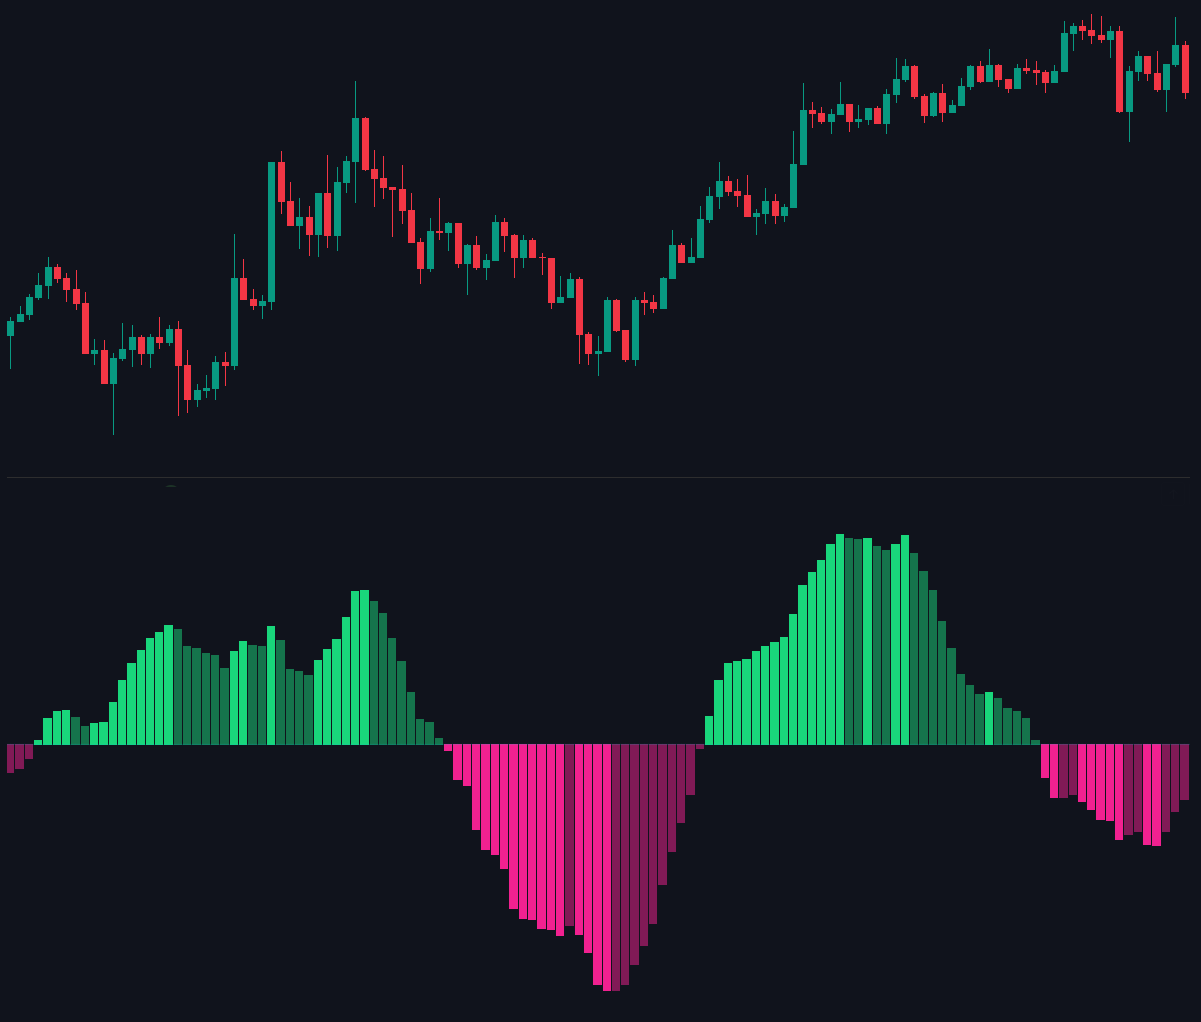
The indicator oscillates around a baseline, separating bullish and bearish control:
Above 0 Line (Green Waves): Dominant aggressive buying pressure.
- Bright Green: Fast volume expansion; strong bullish momentum.
- Dark Green: Buying pressure is cooling off.
Below 0 Line (Magenta Waves): Dominant aggressive selling pressure.
- Bright Magenta: Fast volume expansion; strong bearish momentum.
- Dark Magenta: Selling pressure is cooling off.
Divergence
The system detects both bullish and bearish divergences between price and the VolumeFlow oscillator. Divergences highlight weakening momentum and potential reversal points.
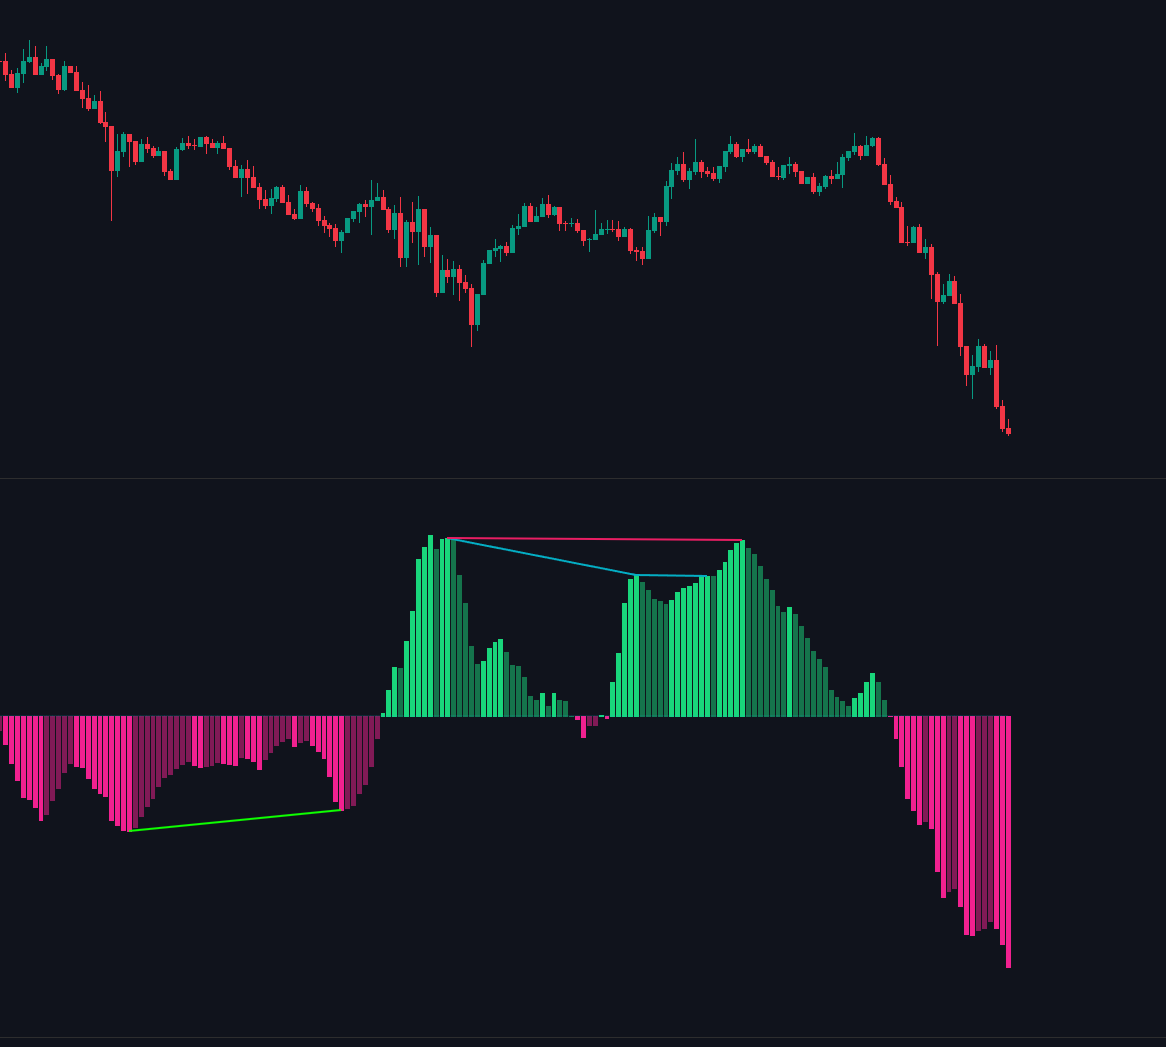
Bearish Divergence
Interpretation:
- Buying pressure is fading even as price pushes higher.
- Suggests distribution or weakening bullish momentum.
- Often appears before short-term tops or trend pullbacks.
Bullish Divergence
Interpretation:
- Selling pressure is fading even as price pushes lower.
- Suggests accumulation or weakening bearish momentum.
- Often appears before short-term bottoms or trend reversals.
