
 X
X Facebook
 Discord
 Instagram
 YouTube
 ChatGPT
Market Structure
The concept of market structure is crucial in price action trading, offering insights into market behavior through key patterns and transitions.
Market Structure
Break of Structure (BOS):
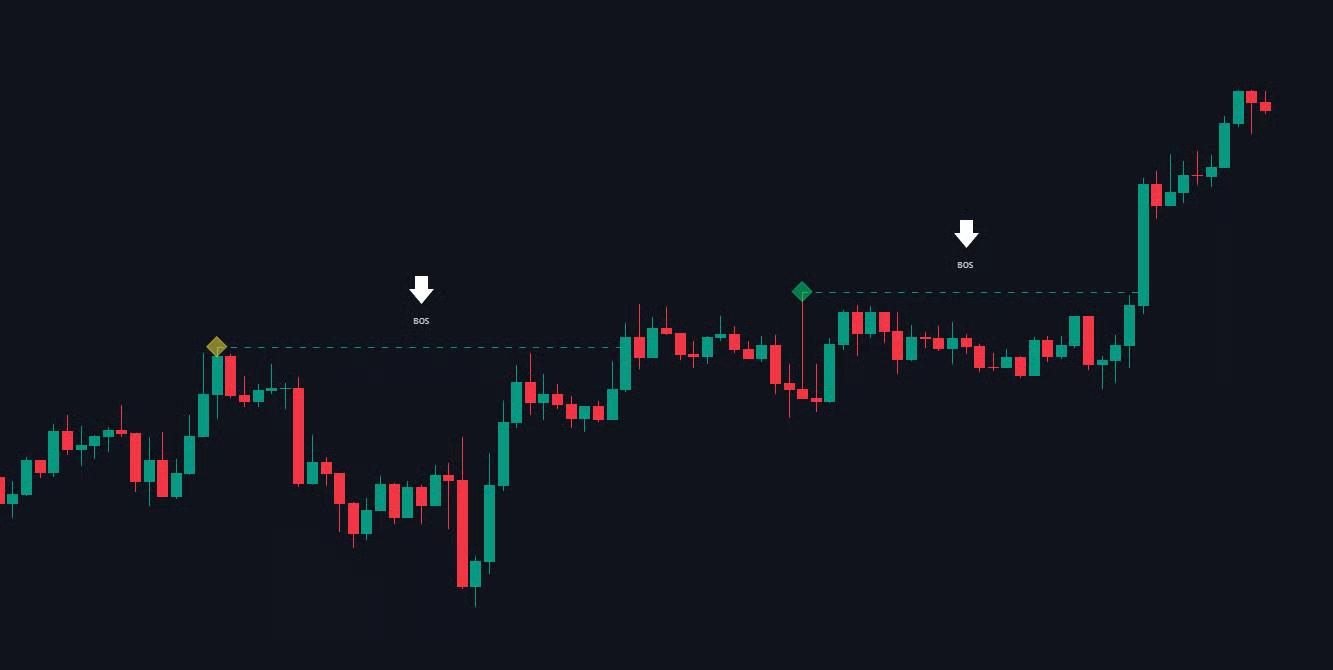
BoS
Change of Character (CHoCH):
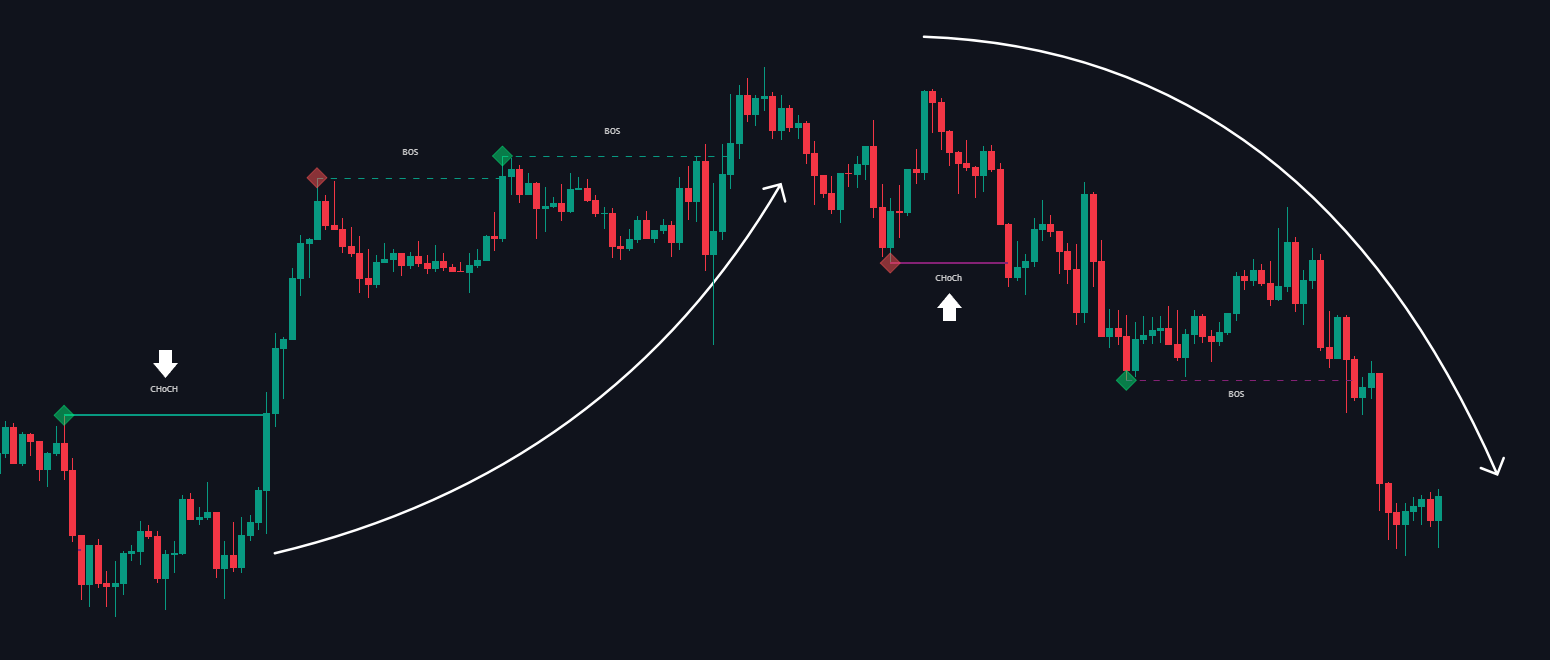
CHoCH
Delta Volume Diamonds
Instead of just showing price labels, the tool places colored diamonds on your swing points to reveal the exact volume momentum behind the move:
◆ Green Diamond
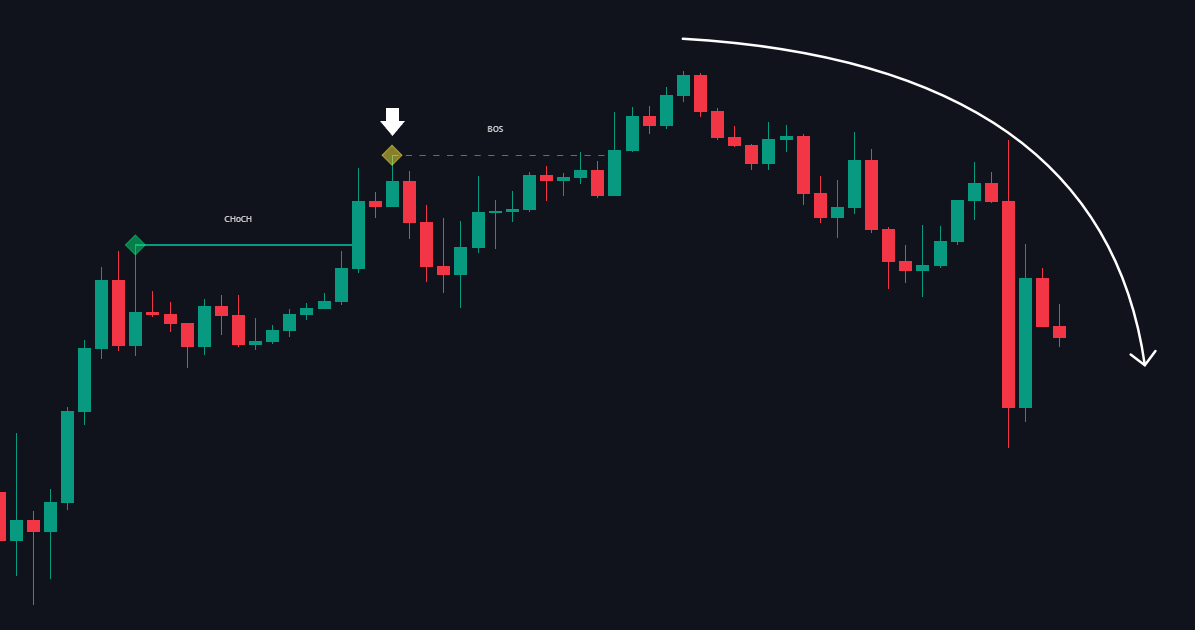
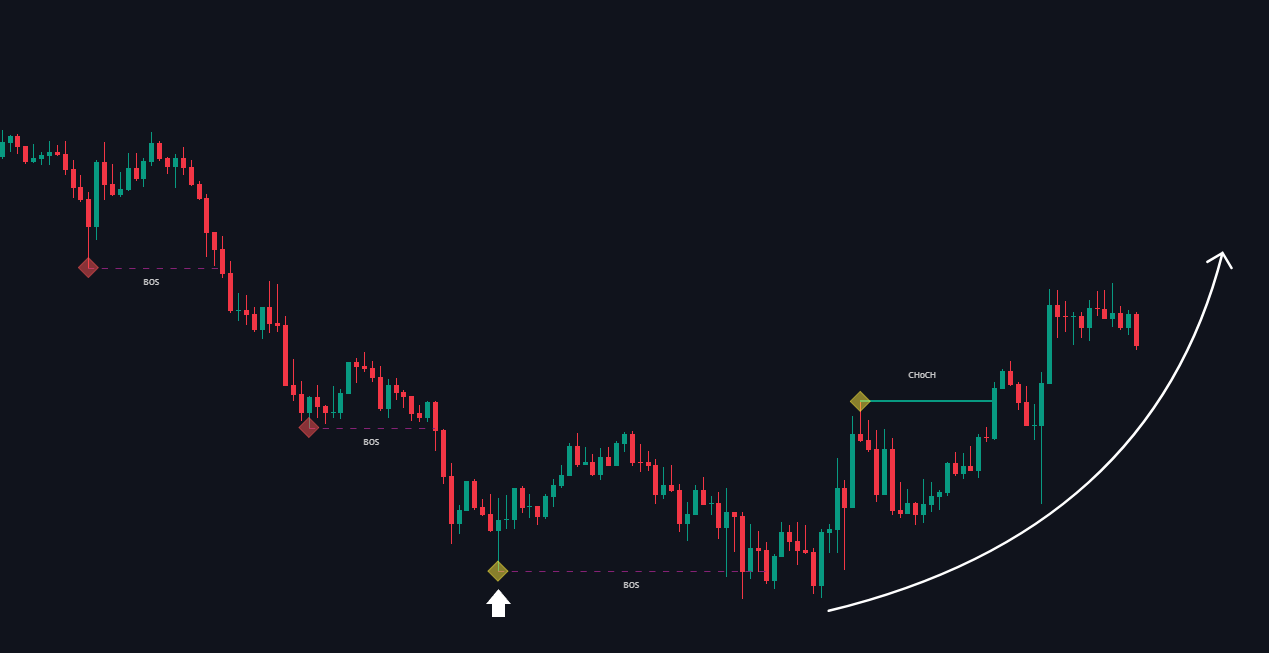
Strong buying delta volume. The trend is highly likely to continue upward.
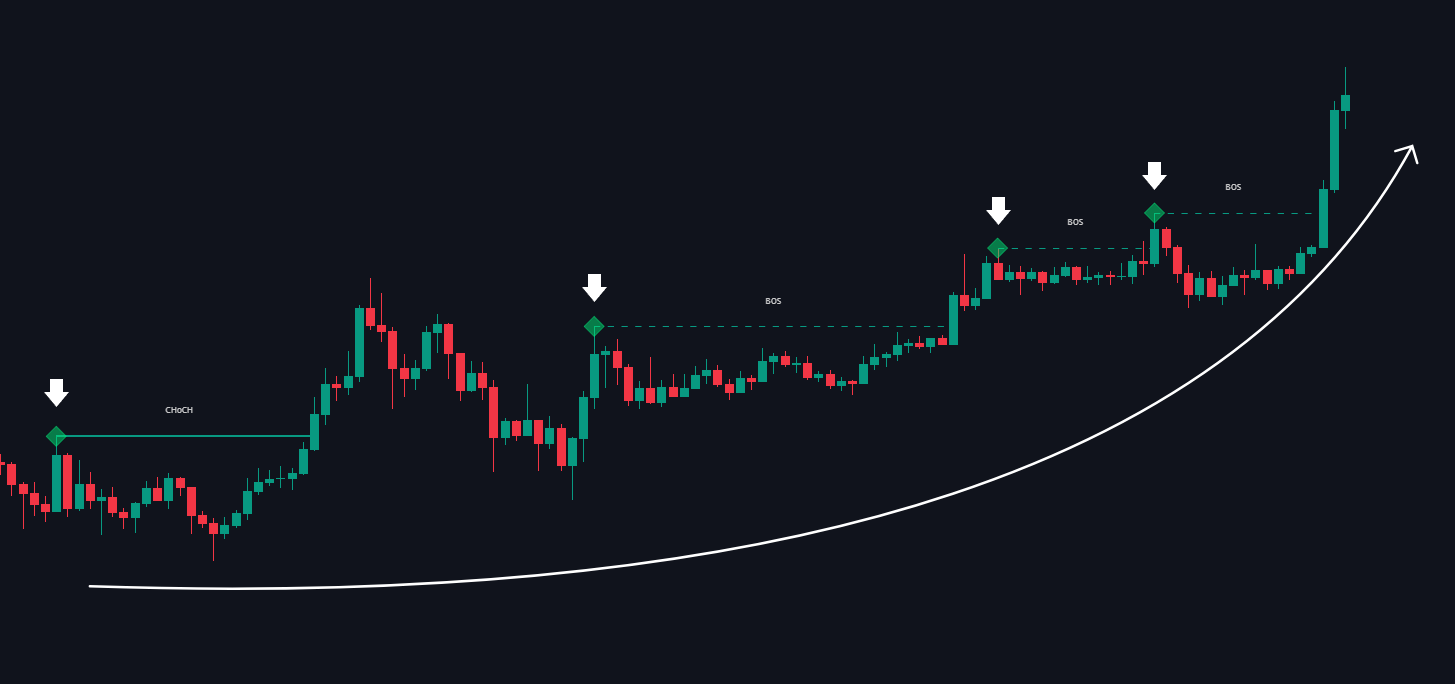
Bullish Delta Volume
◆ Red Diamond
Strong selling delta volume. The trend is highly likely to continue downward.
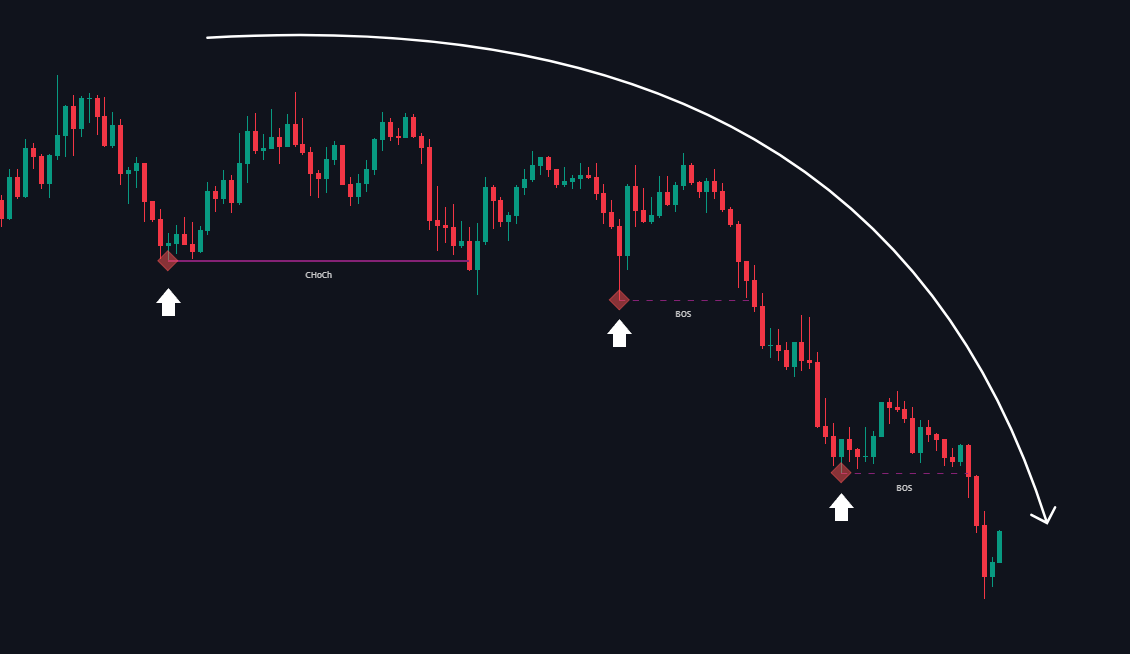
Bearish Delta Volume
◆ Yellow Diamond
Neutral/exhausted volume. Buyers and sellers are balanced, often signaling an impending trend reversal.
Market Structure Hover Label
Market Core now displays an MS Rating tooltip on every BOS and CHoCH event. When hovering over the diamond marker, a compact breakdown of the structure break is shown.
The hover label includes:
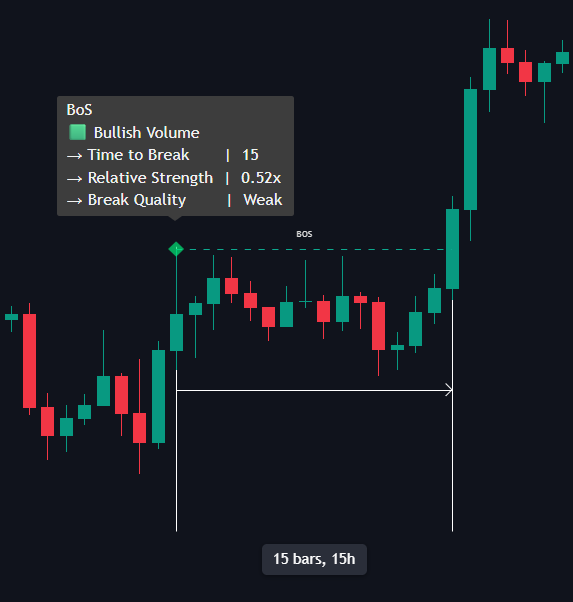
- Volume: Measures the cumulative net volume between the initial High/Low and the breakout point (ChoCh)
- Relative Strength
Shows the relative strength of the current structure break compared to the previous break. - Break Quality
Indicates how clean and decisive the structure break is (Weak , Moderate, Strong) - Time to Break
Displays how many bars it took for price to break the market structure level.
Market Structure Future Projection
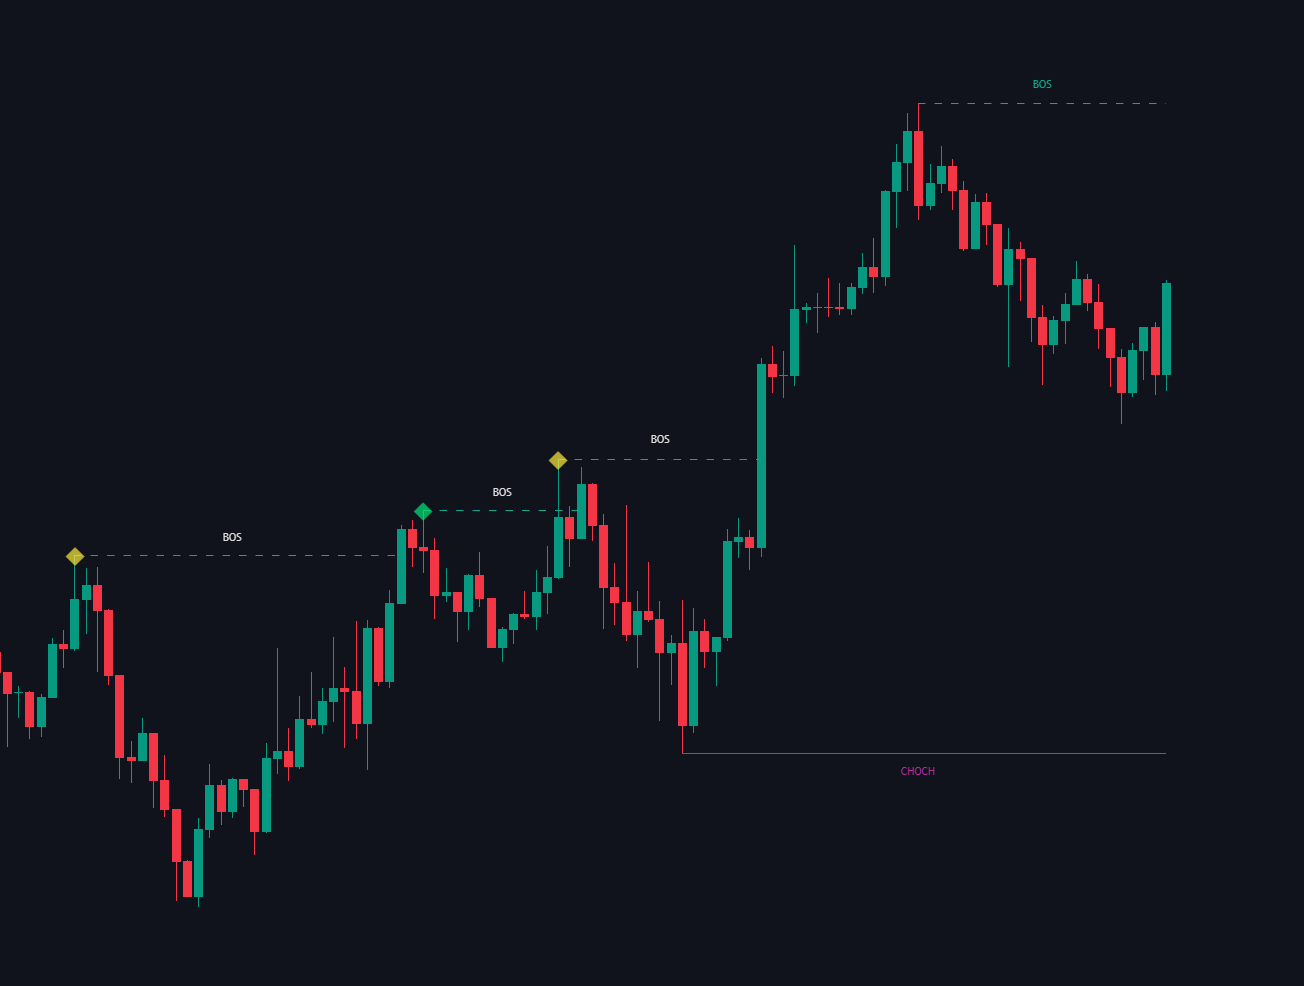
You don't need to guess where a key structure break will happen. The tool automatically projects active levels forward on your chart as horizontal lines:
Change in State of Delivery (CISD)
A Change in State of Delivery (CISD) identifies the exact moment institutional order delivery flips between buy-side and sell-side.
When a BOS or CHoCH fails and price aggressively reverses, the CISD toggle tracks these early structural failures before a full market structure shift confirms.
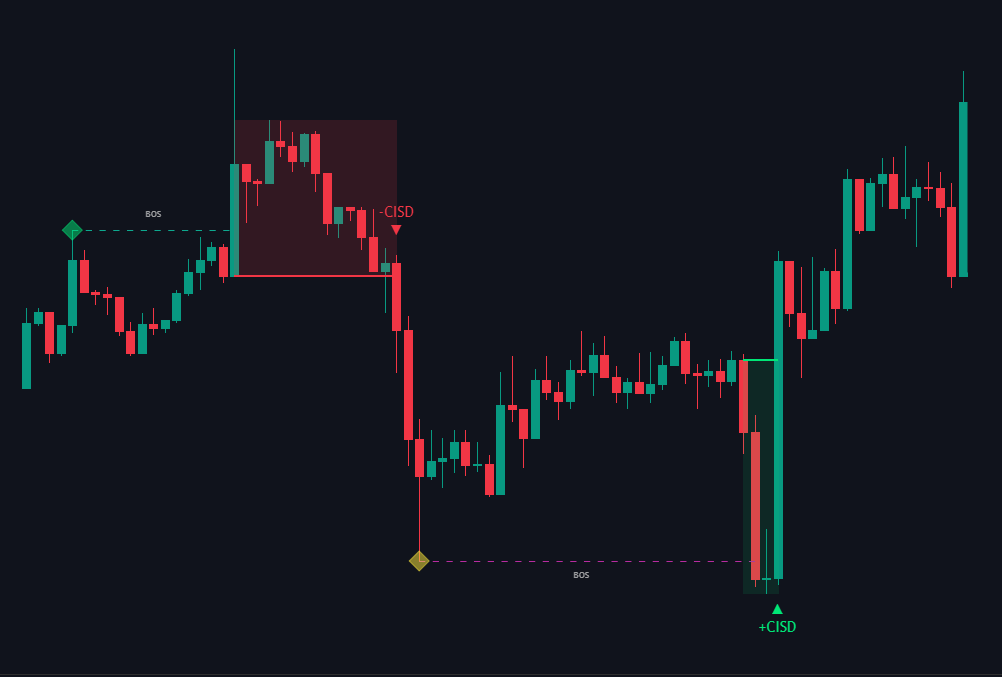
- Bullish CISD: Signals that sellers have lost control and institutions are aggressively buying. Look for upward reversals.
- Bearish CISD: Signals that buyers have lost control and institutions are aggressively selling. Look for downward reversals.
Market Structure MTF Screener
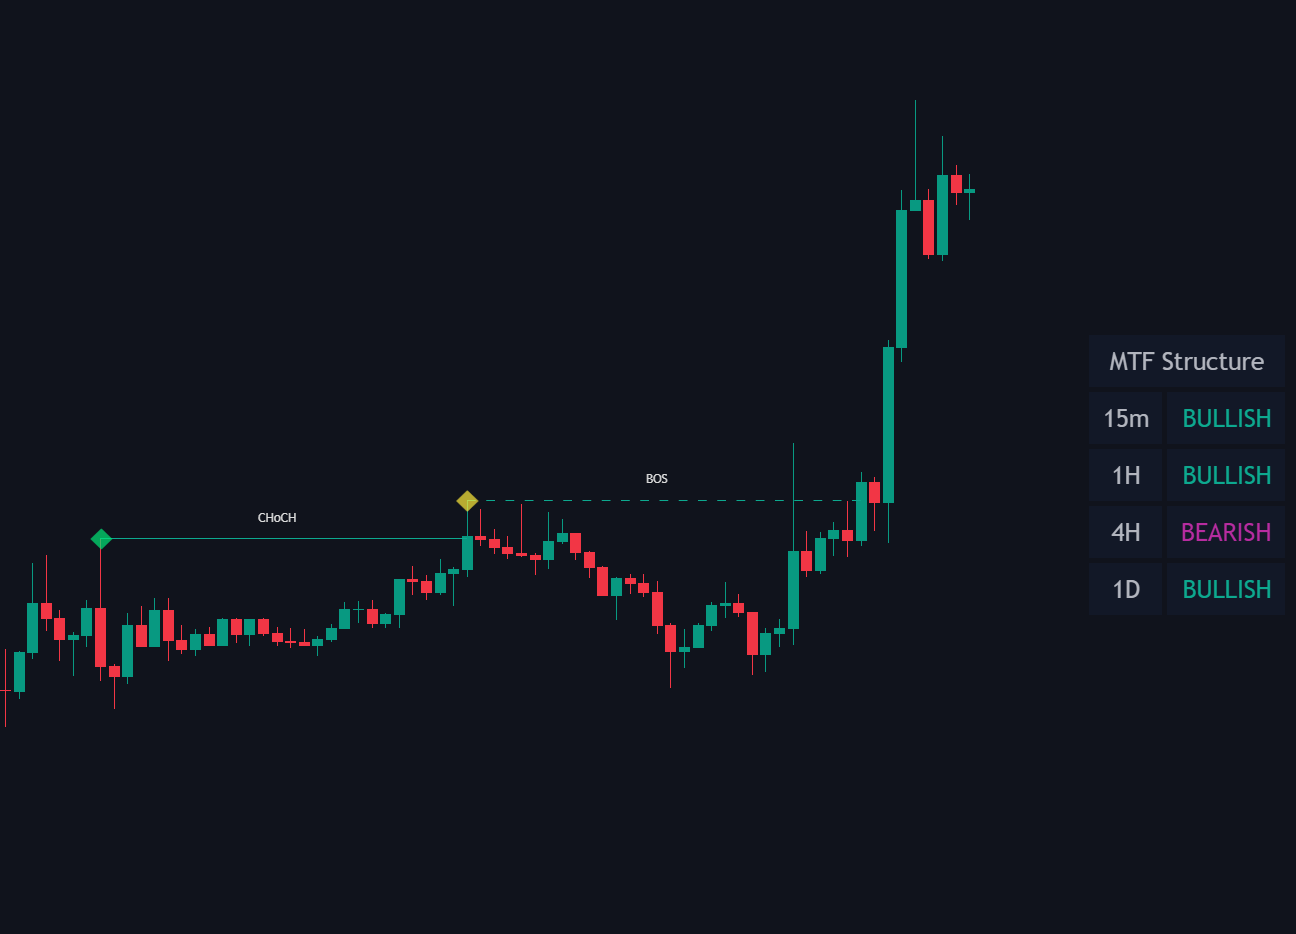
The Multi-Timeframe (MTF) Screener is a dashboard that lets you see the Market Structure trend direction of multiple timeframes at once, directly on your main chart.
Market Mapping
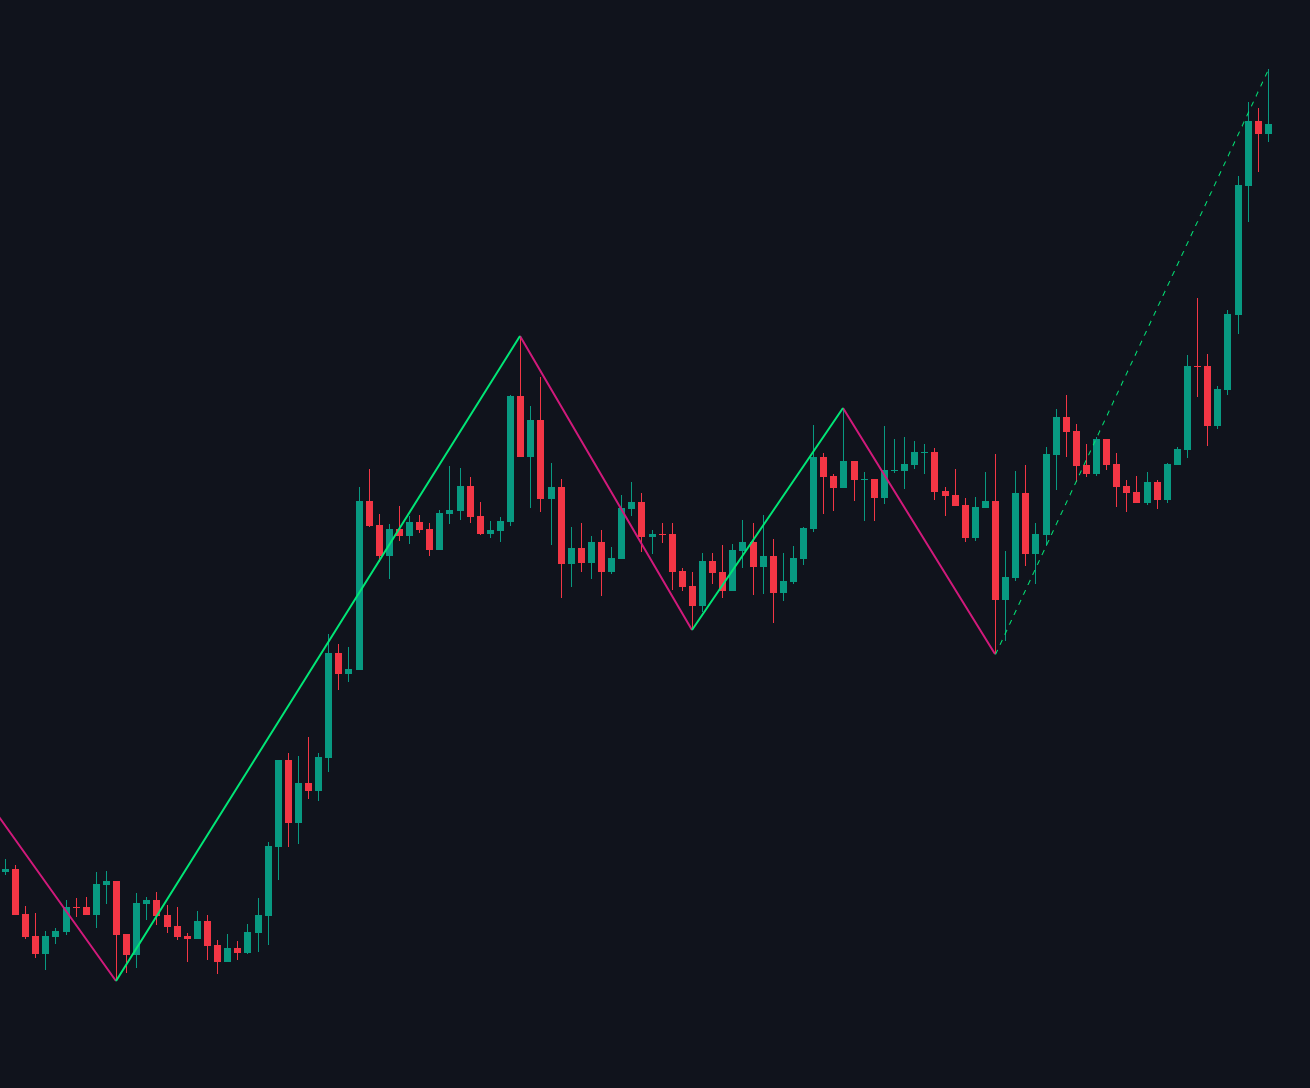
Market Mapping is a zigzag-based structure tool that outlines the market’s flow by marking key swing highs, swing lows, and trend shifts.
Strong/Weak High and Low
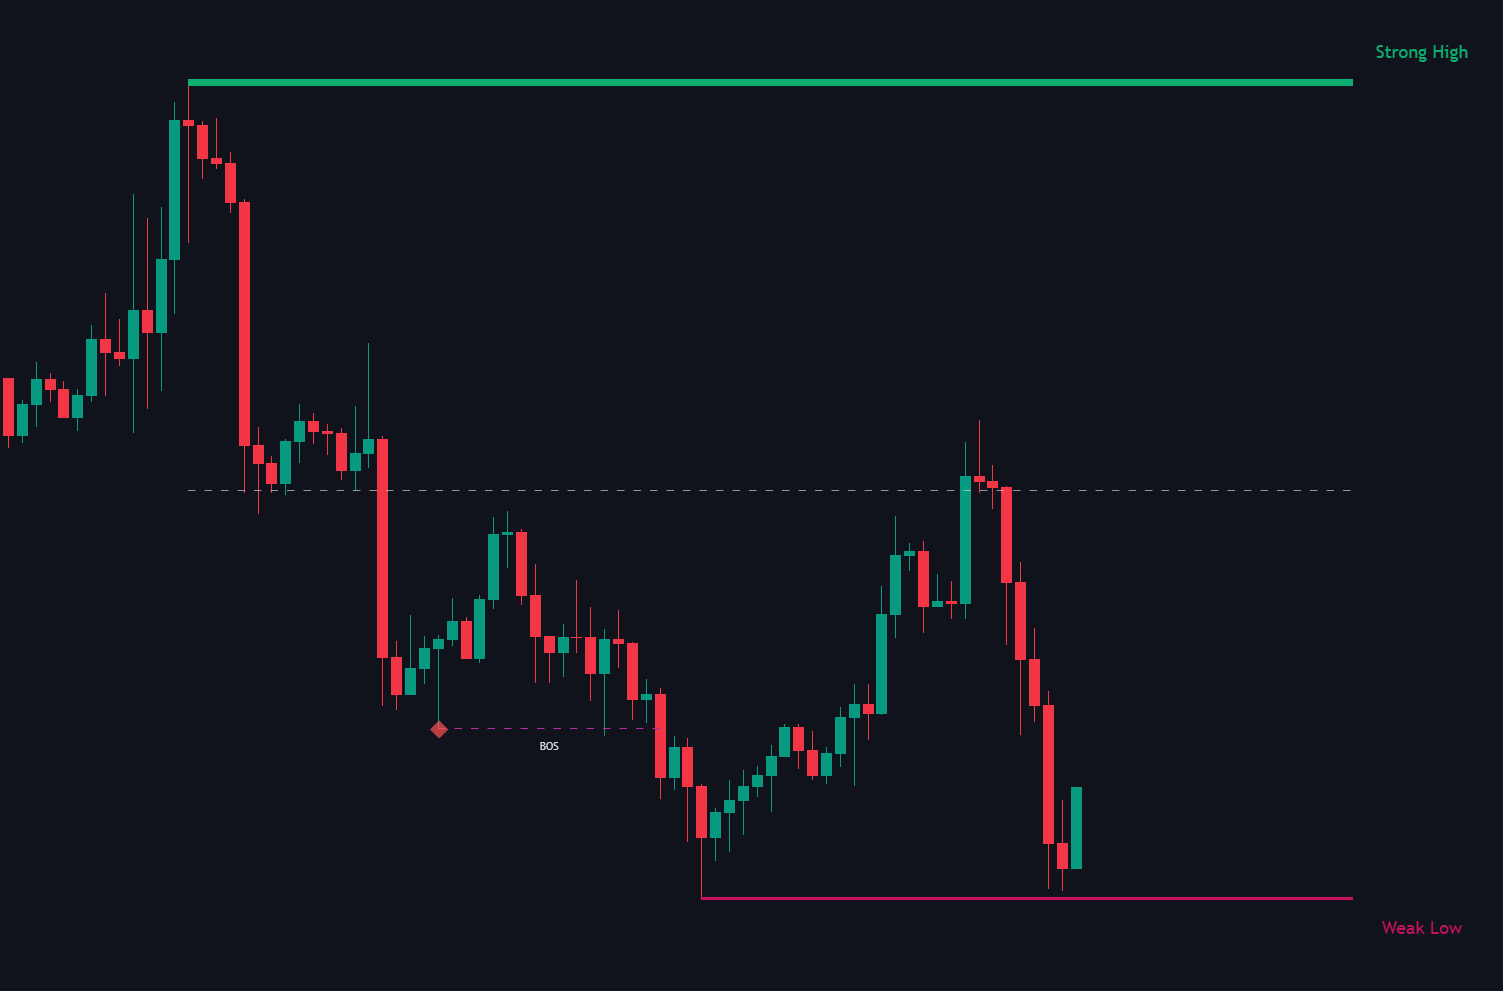
In trading and technical analysis, Strong vs. Weak Highs and Lows are structural points used to determine market trend direction, liquidity pools, and future price targets
- If the trend is upward, the low is considered strong, while the high is weak.
- Conversely, if the trend is downward, the high is strong, and the low is weak.
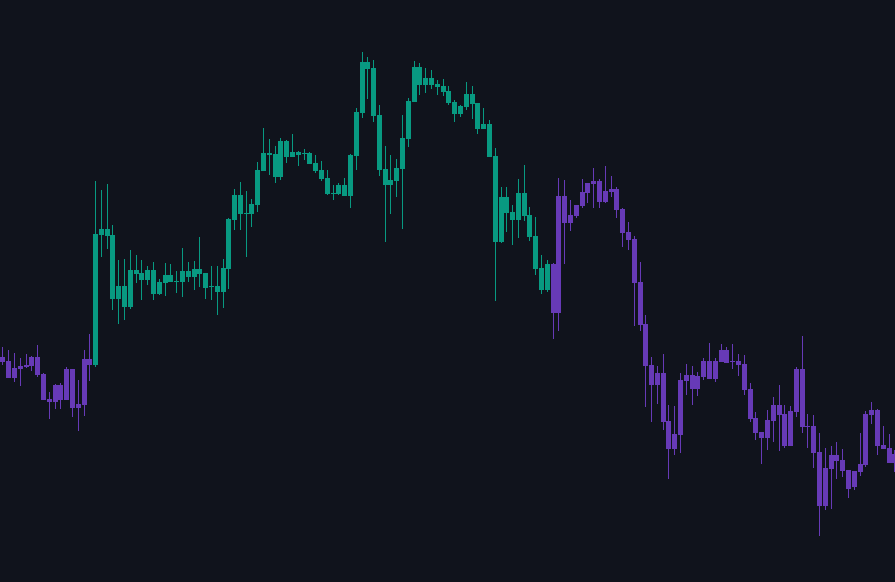
Structure Candles
Structure Candles change the color of the candlesticks on your chart based on the market structure trend. This gives you a clean, visual representation of who is currently in control of the market.
Structure Candles
Double Tops/Bottoms
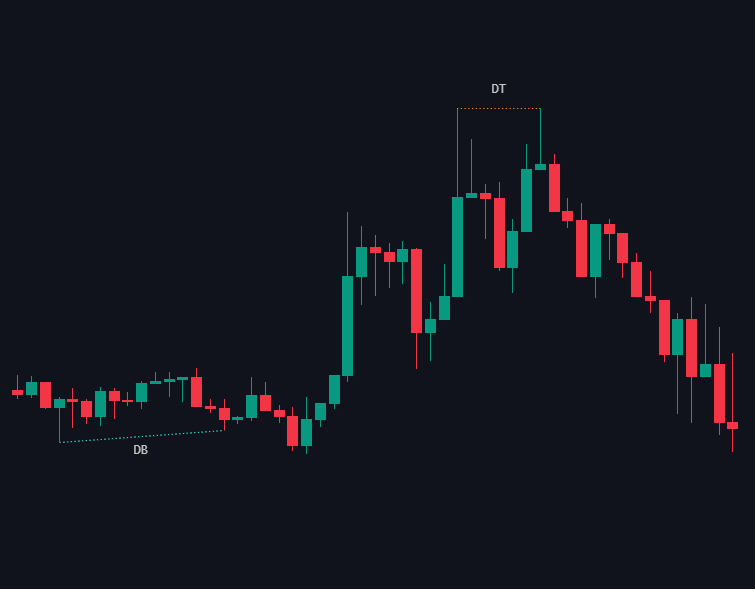
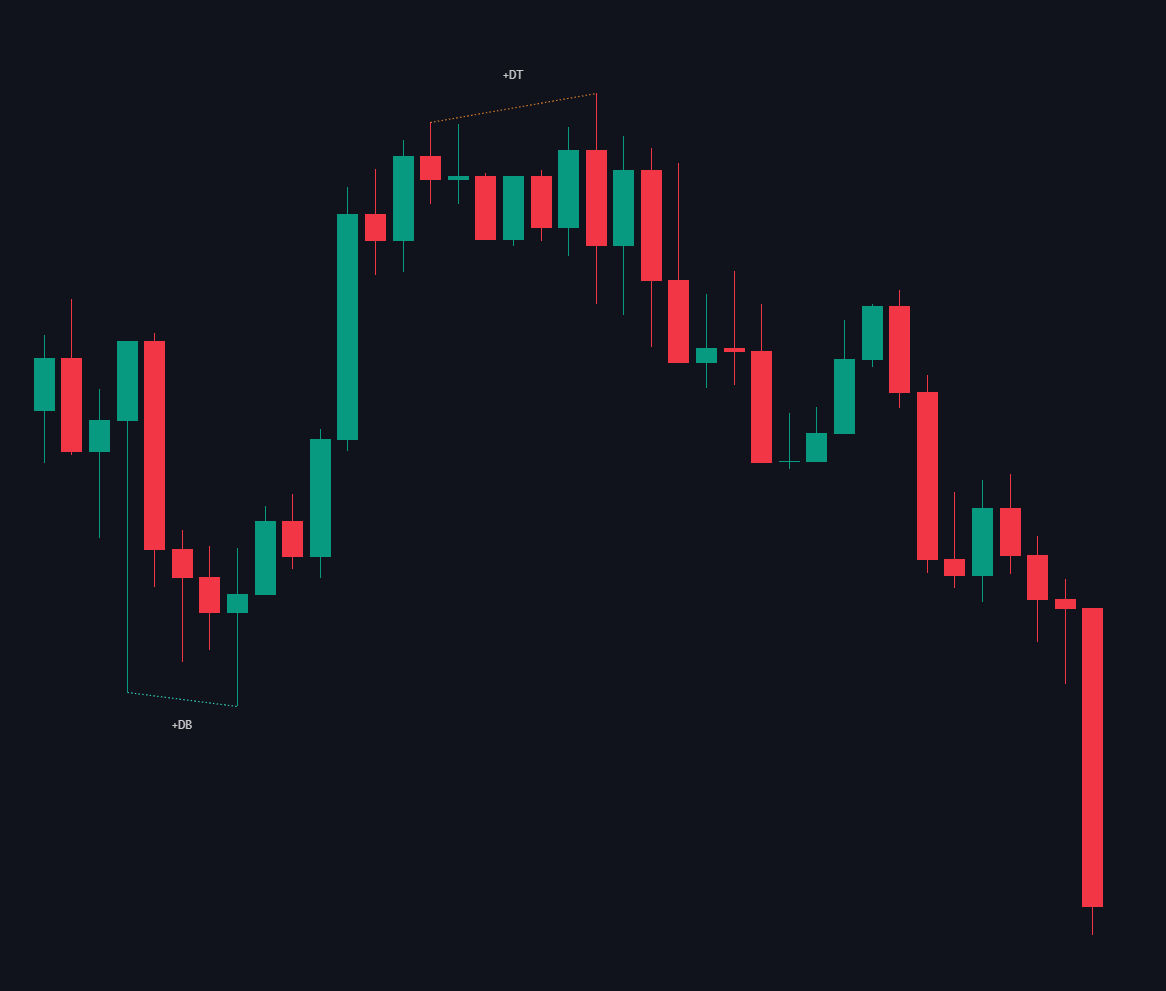
Double Bottoms (DB) and Double Tops (DT), which are key reversal patterns formed when the market tests a major price level twice and fails to break it. The indicator highlights both standard variations and enhanced "+" variations, which confirm immediate momentum shifts.
Standard Patterns (DB / DT)
- Standard Double Bottom (DB): The second floor drops lower than or equal to the first floor, but holds support as buyers step in to defend the level.
- Standard Double Top (DT): The second peak climbs higher than or equal to the first peak, but hits resistance as sellers step in to defend the ceiling.
Strong Patterns (+DB / +DT)
- Strong Double Bottom (+DB): The second low creates a lower low but fails to break down. Price quickly returns and completes on a bullish (green) candle, confirming strong buying pressure.
- Strong Double Top (+DT): The second peak creates a higher high but fails to break up. Price quickly returns and completes on a bearish (red) candle, confirming strong selling pressure.
Swing Data
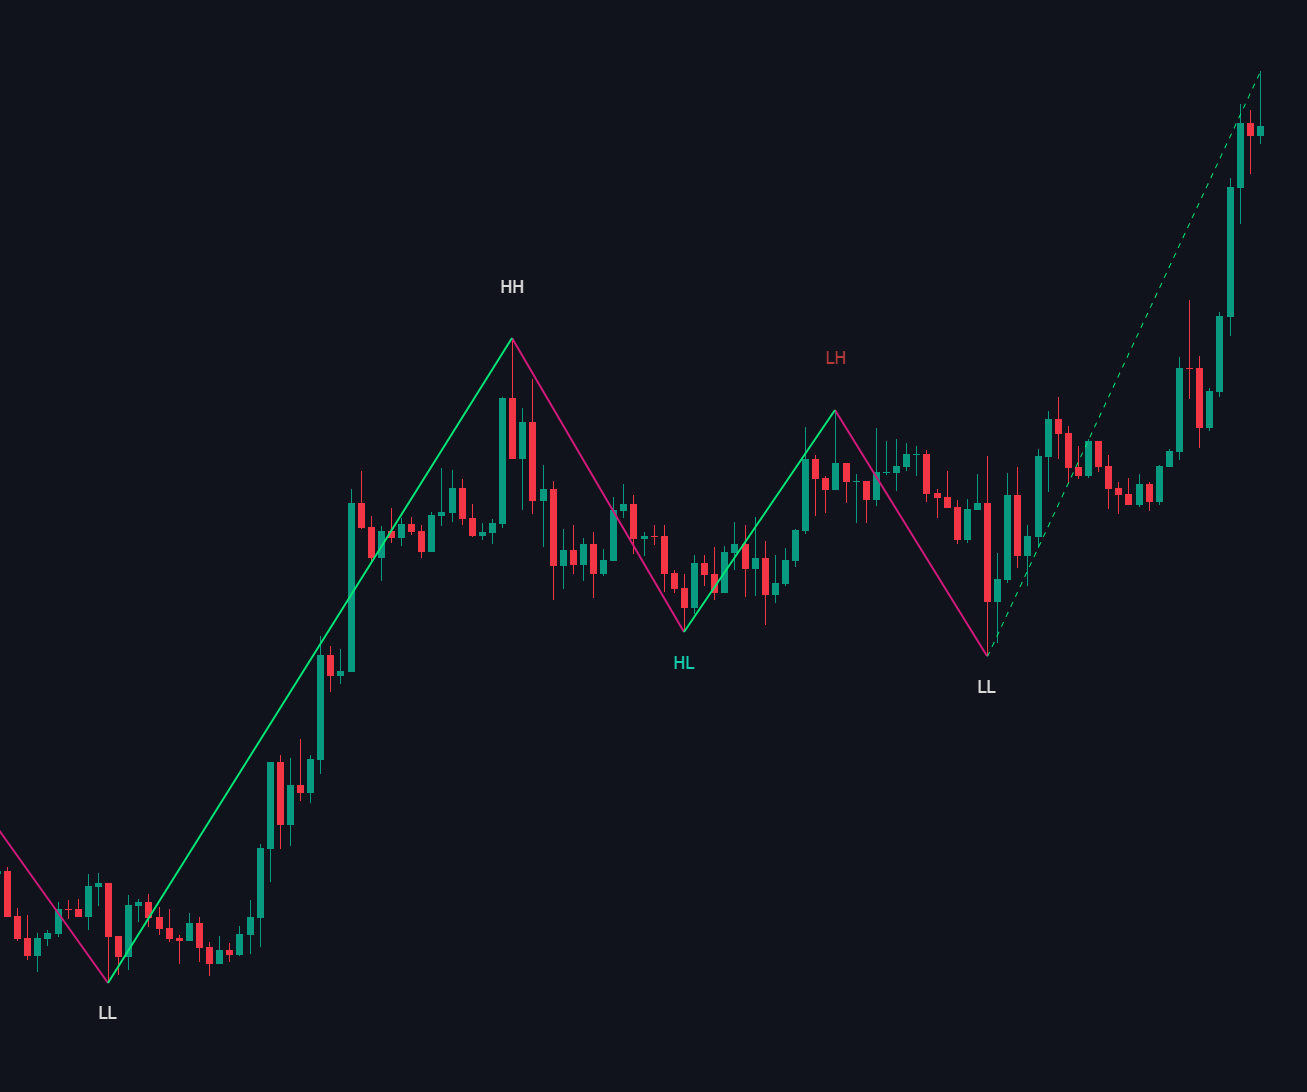
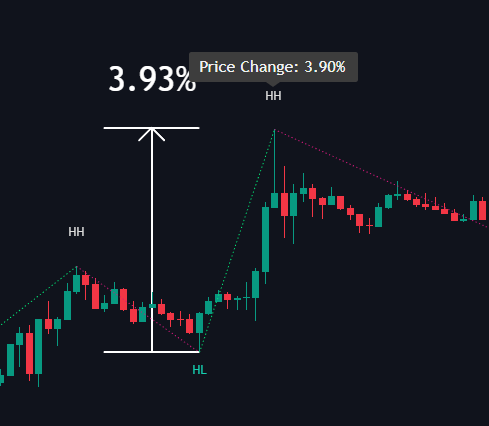
Each confirmed swing point is marked with a detailed label showing:
Structure Type:
HH, HL, LH, LL — identifying higher highs, higher lows, lower highs, and lower lows.
• Higher Lows are displayed in green. (Bullish)
• Lower Highs are displayed in red. (Bearish)
• Other HH and LL labels are displayed in white.
Price Change % (PC):
The percentage distance from the previous swing, helping traders instantly see the strength and size of each move.
Settings
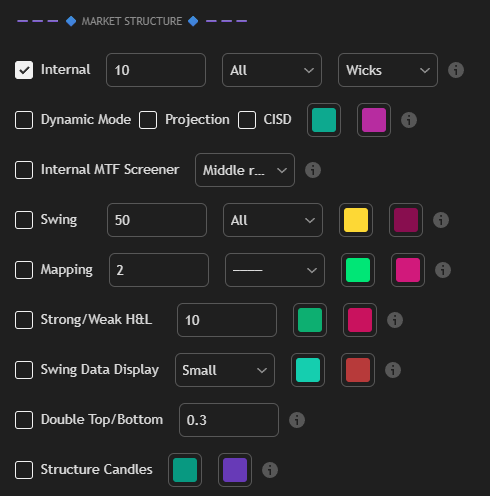
| Setting | Description |
|---|---|
| Internal & Dynamic Mode |
|
|
|
| Internal MTF Screener |
|
| Swing |
|
| Mapping |
|
| Strong/Weak H&L |
|
| Swing Data Display |
|
| Double Top/Bottom |
|
| Structure Candles |
|
