
 X
X Facebook
 Discord
 Instagram
 YouTube
 ChatGPT
Signals Dashboard
The Signals Dashboard is a powerful multi-timeframe panel that packs real-time data from the Nautilus core modules into a single, compact table.
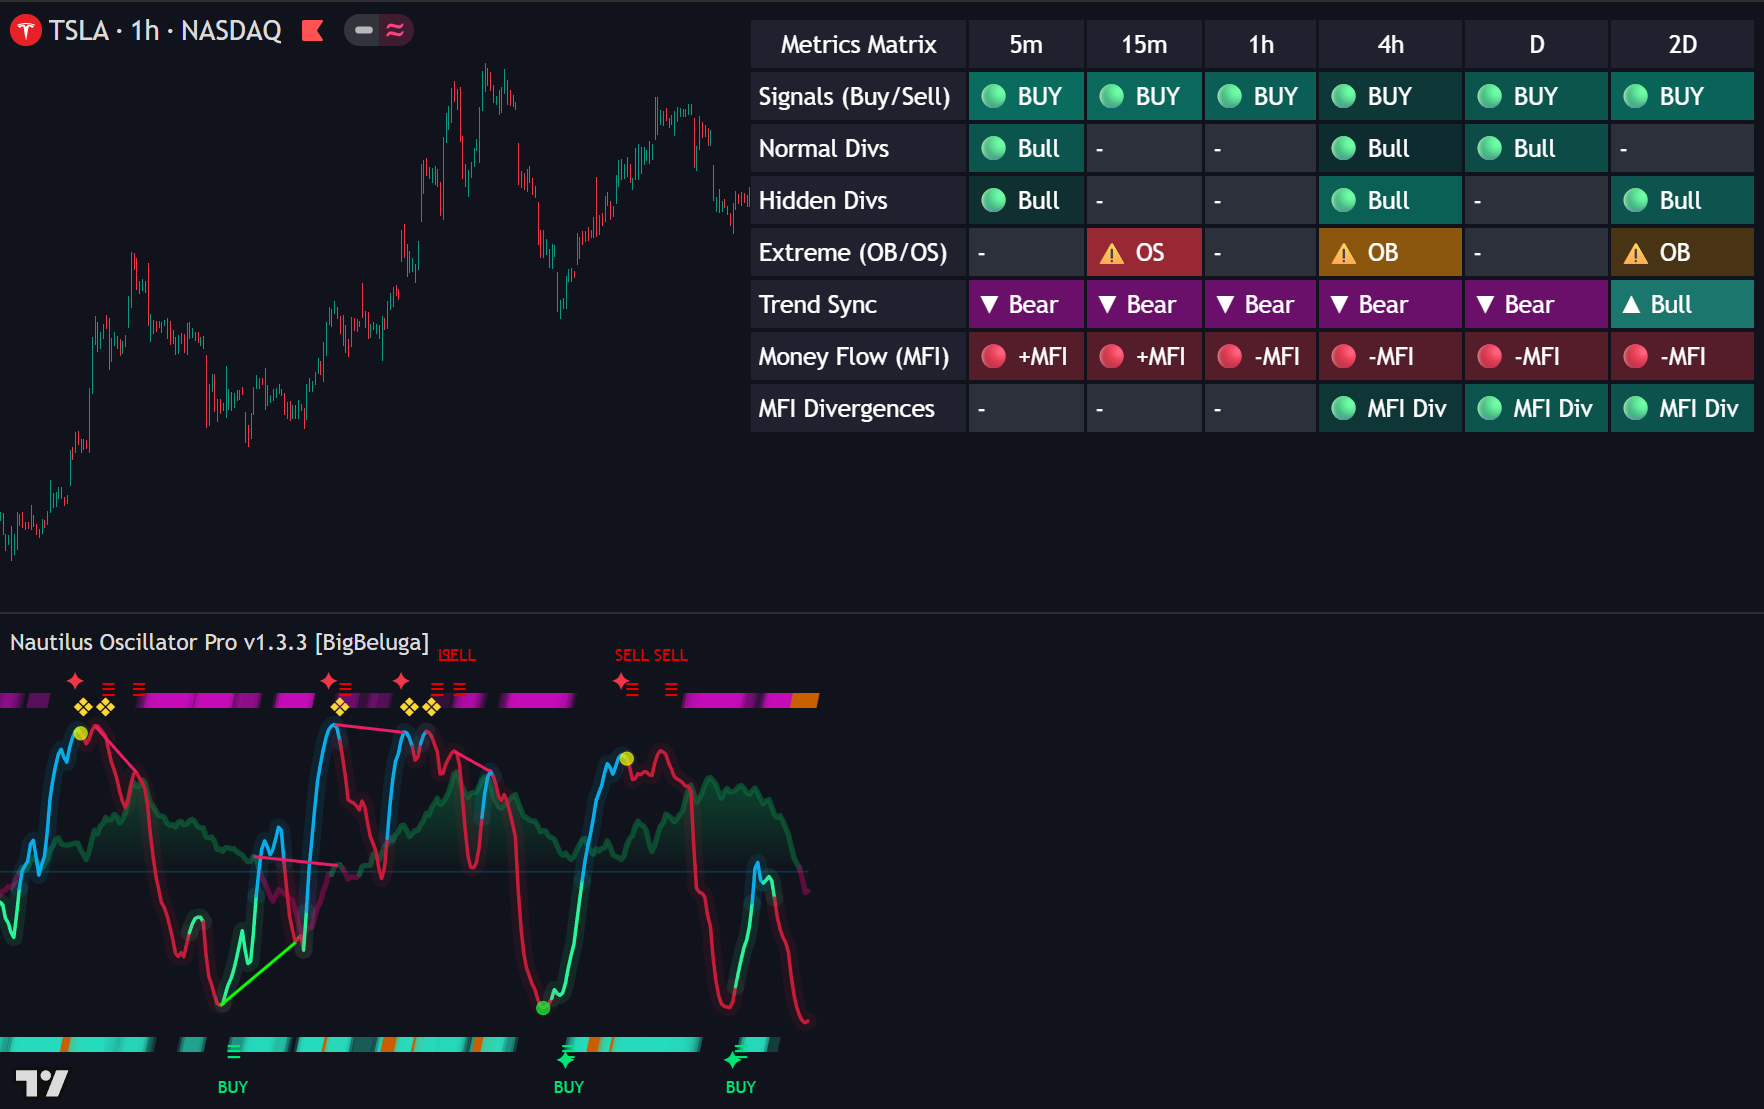
It allows you to track market conditions, momentum shifts, and reversal opportunities across up to six independent timeframes at once, eliminating the need to constantly flip through different charts.
How It Works
Dashboard populates a dynamic grid containing essential trading metrics:
Signals (Buy/Sell): Displays active BUY or SELL signals.

Normal Divs: Highlights standard BULL or BEAR divergence alerts.

Hidden Divs: Captures hidden continuation divergences.

Extreme (OB/OS): Identifies extreme Overbought (OB) or Oversold (OS) territories.

Trend Sync: Tracks overall market trend direction (▲ Bull / ▼ Bear).

The Money Flow (MFI) row tracks volume-weighted capital flow across 4 distinct states based on its position relative to the zero line and its current direction (+ for rising, - for declining).

| Label | MFI Value | Momentum | Context |
|---|---|---|---|
| 🟢 +MFI | Above 0 | 📈 Rising | Bullish Expansion: Strong capital inflow. |
| 🟢 -MFI | Above 0 | 📉 Declining | Bullish Slowdown: Positive flow, but cooling off. |
| 🔴 +MFI | Below 0 | 📈 Rising | Bearish Slowdown: Negative flow, but pulling back up. |
| 🔴 -MFI | Below 0 | 📉 Declining | Bearish Expansion: Strong capital outflow. |
MFI Divergences: Tracks price-to-volume discrepancies directly on the dashboard, signaling potential market reversals when price action and volume-weighted capital flow disconnect.

VolumeFlow (CVD): The VolumeFlow (CVD) row tracks cumulative volume delta across 4 distinct states based on its position relative to the zero line and its current direction ($$ $+$ $$ for rising/increasing cumulative buying volume, $$ $-$ $$ for declining/increasing cumulative selling volume).

| Label | CVD Value | Momentum | Context |
|---|---|---|---|
| 🟢 +CVD | Above 0 | 📈 Rising | Bullish Expansion: Strong volume inflow and aggressive market buying. |
| 🟢 -CVD | Above 0 | 📉 Declining | Bullish Slowdown: Positive volume delta, but buying pressure is cooling off. |
| 🔴 +CVD | Below 0 | 📈 Rising | Bearish Slowdown: Negative volume delta, but selling pressure is pulling back up. |
| 🔴 -CVD | Below 0 | 📉 Declining | Bearish Expansion: Strong volume outflow and aggressive market selling. |
VolumeFlow Divergences: As shown in the dashboard layout, VolumeFlow Divergences track price-to-volume discrepancies directly on the dashboard. This signals potential market reversals when price action and cumulative volume flow disconnect (e.g., price making a higher high while CVD makes a lower high).
1. Lookback Buffer
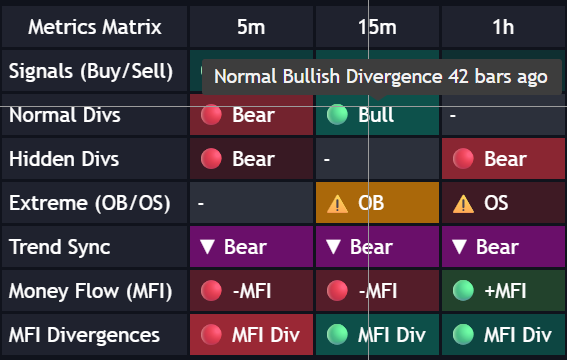
To keep your charts clean and highly relevant, the dashboard only displays active signals that have occurred within a user-defined lookback window. If a signal is older than the configured buffer limit, it is automatically filtered out and replaced with a neutral dash (-).

2. Hover Tooltips
Hovering your mouse cursor over any filled data cell reveals an on-screen tooltip showing:
Settings
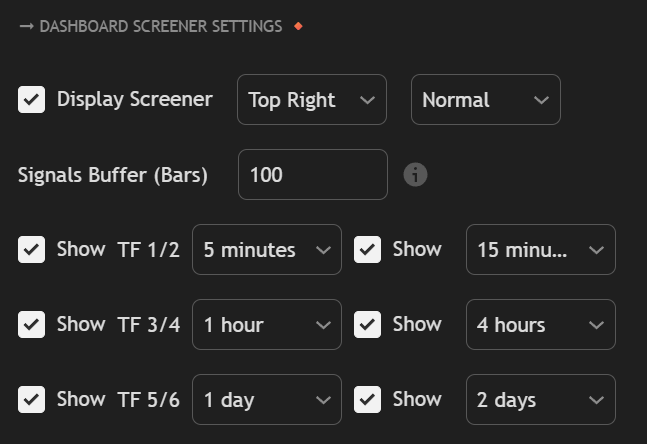
- Display Screener: Toggle the checkbox to turn the dashboard on or off. Use the dropdowns to adjust its screen position (e.g., Top Right) and visual scaling/size (e.g., Normal).
- Signals Buffer (Bars): Defines the maximum lookback window for tracking triggers. For example, setting this to
100means a signal will only appear on the dashboard if it occurred within the last 100 bars. - Show TF 1/2 to 5/6: Check the boxes to enable up to six independent multi-timeframe columns simultaneously. Each dropdown lets you map a custom timeframe (from intraday choices like 5 minutes up to macro intervals like 2 days).
