
 X
X Facebook
 Discord
 Instagram
 YouTube
 ChatGPT
Volume Mapping
Volume Mapping provides a clear visualization of bullish and bearish volume activity to gauge market sentiment.
Volume Mapping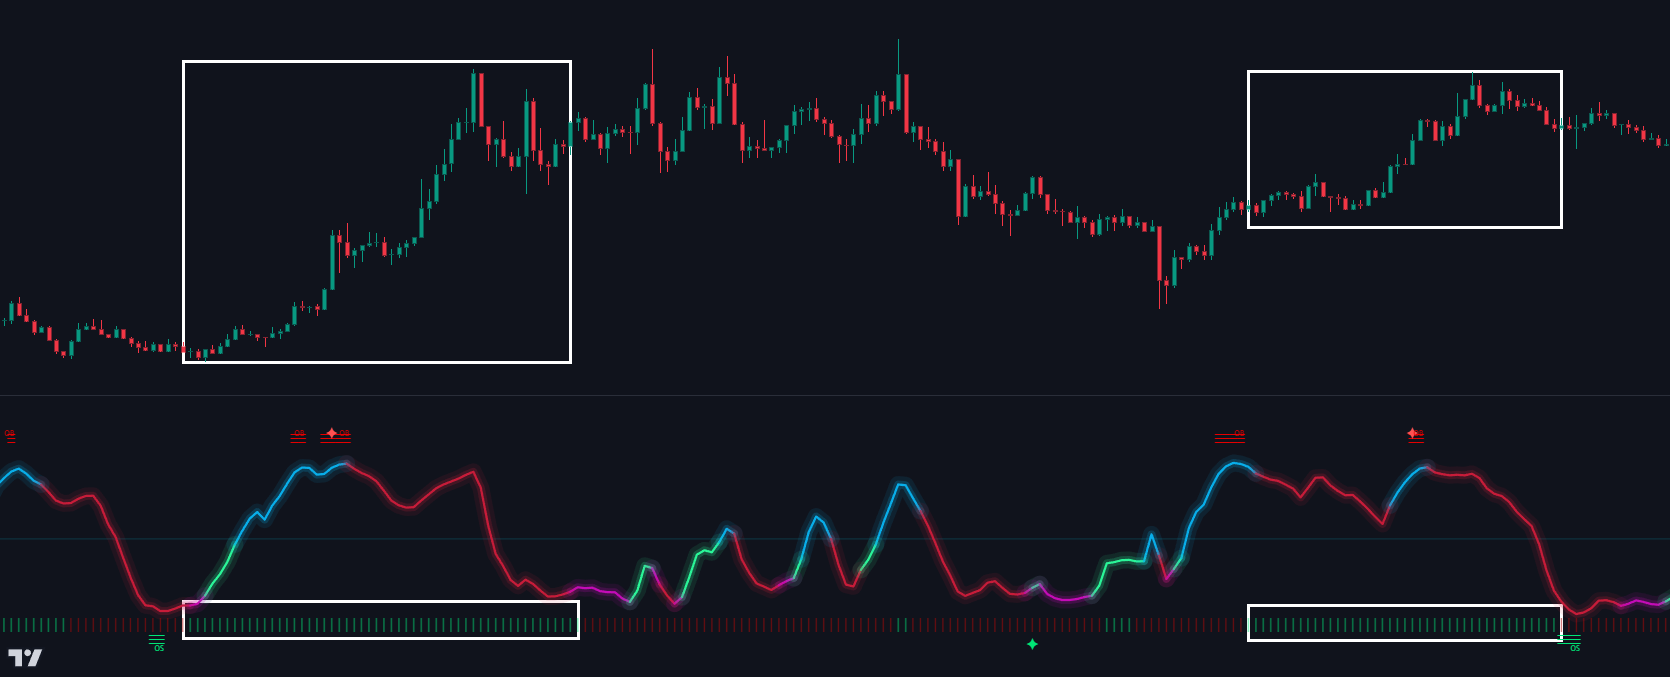
Green Bars: Represent bullish volume, indicating periods where buying pressure is dominant.

Red Bars: Represent bearish volume, highlighting moments of selling pressure.

This feature helps traders quickly assess the market's prevailing sentiment and identify potential trends, making it an essential tool for analyzing momentum shifts and validating trade setups.
