
 X
X Facebook
 Discord
 Instagram
 YouTube
 ChatGPT
Liquidation Events
The Liquidation Events panel streams real-time forced position closures from major crypto derivatives exchanges directly into your TradingView workspace. It helps you spot liquidation cascades, squeeze conditions, and liquidity sweeps without leaving the chart.
How to Access
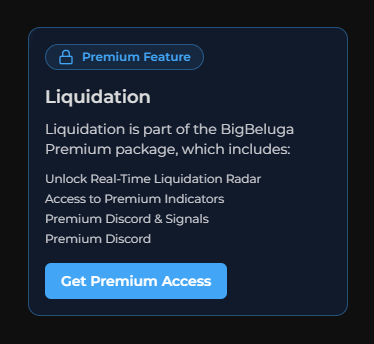
The Liquidation Events panel is a premium feature.
- If not, you’ll need to subscribe to any of our three premium plans to enable it.
Click the “Get Premium Access” button. It will redirect you to the BigBeluga subscription page where you can choose a plan.
To open the panel:
- Click the Sonar icon on the right sidebar of your TradingView chart.
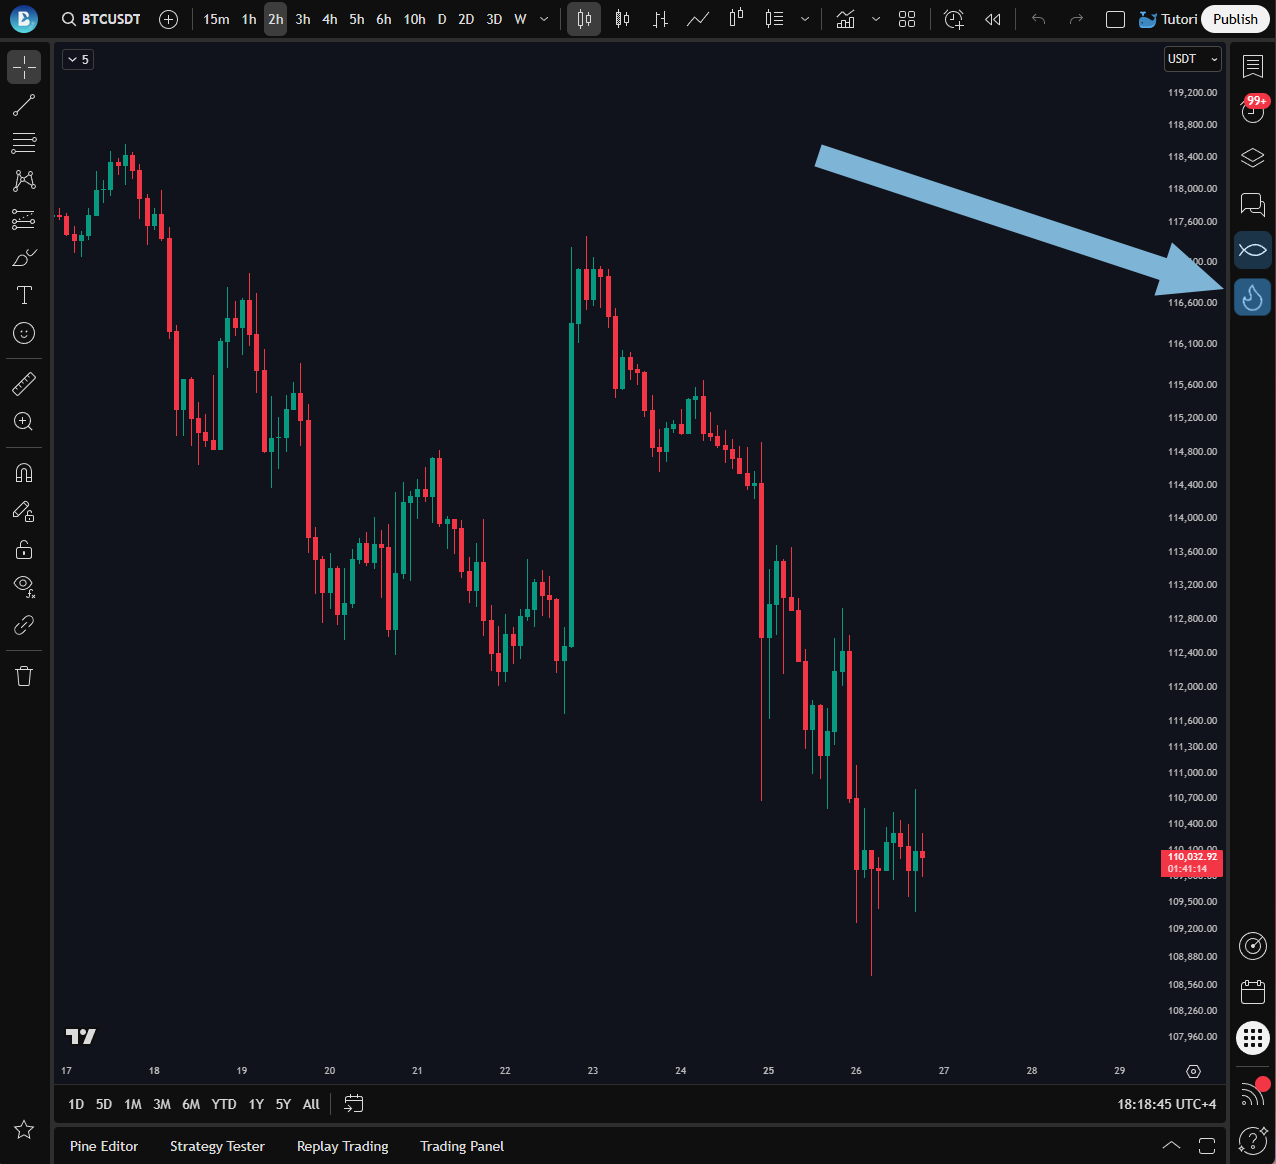
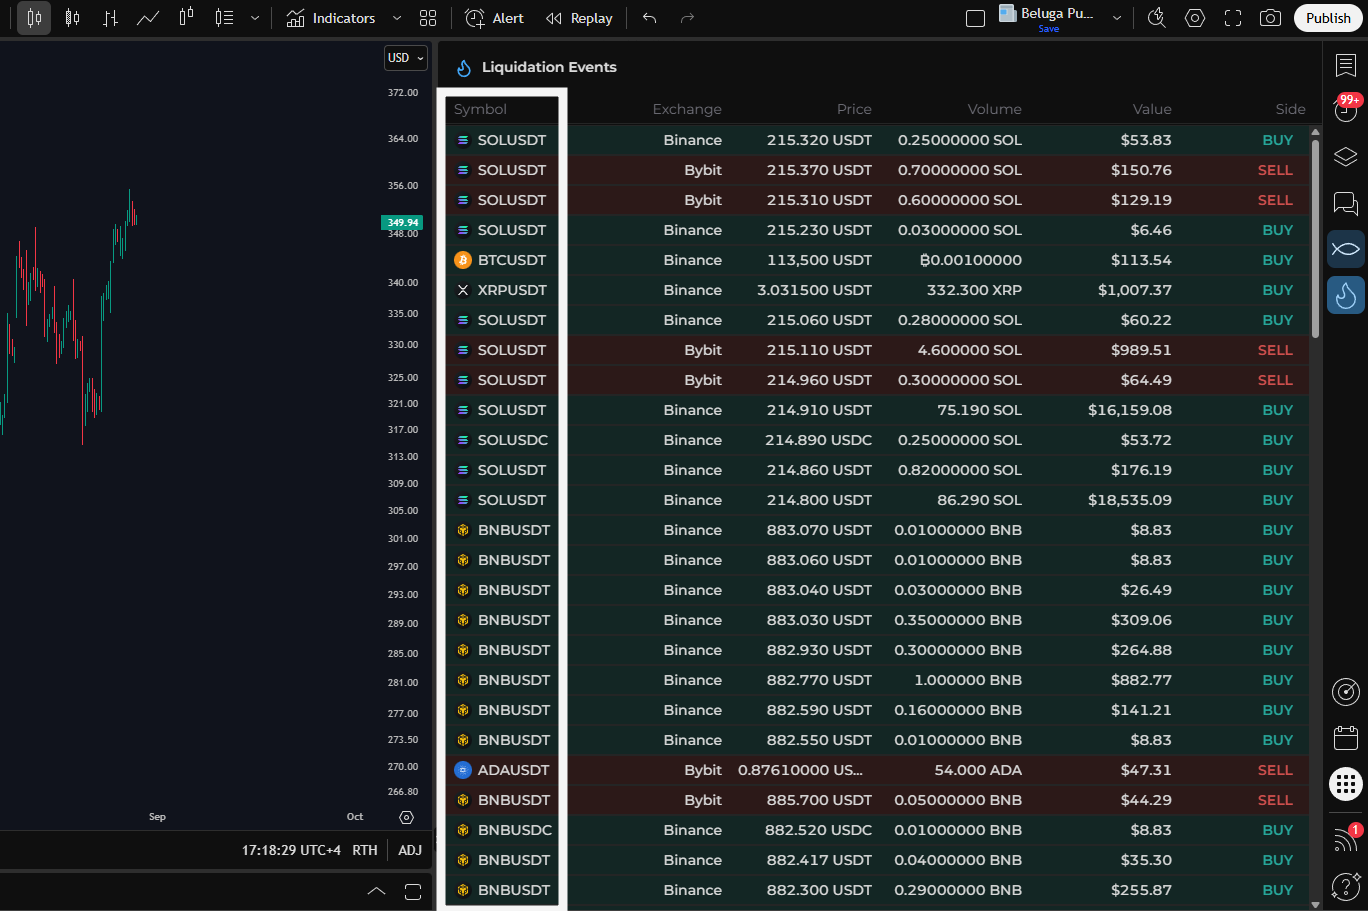
Table Columns & Data
Symbol – The futures pair where the liquidation occurred (e.g., BTCUSDT, ETHUSDT).
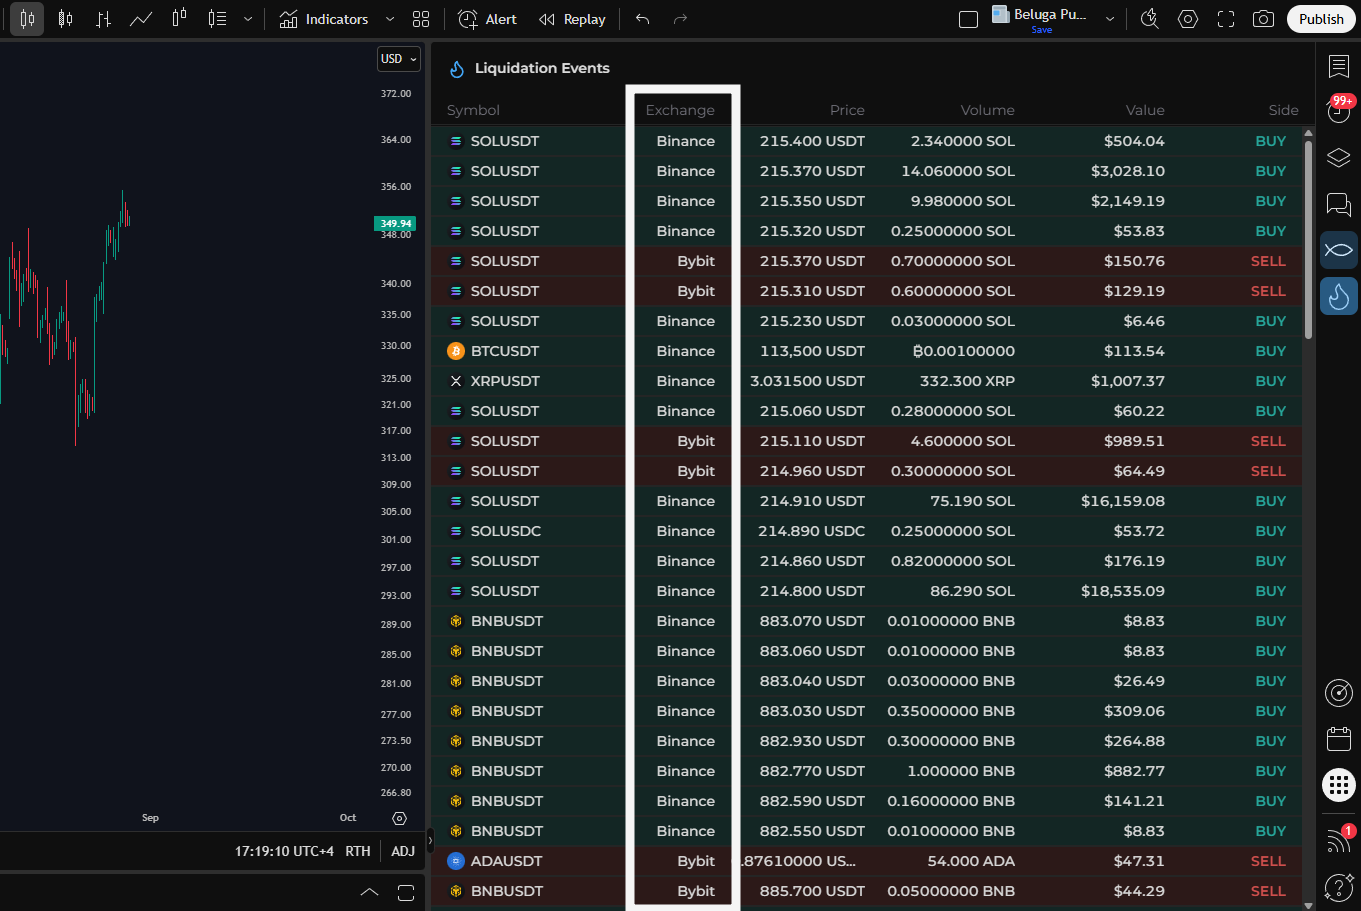
Exchange – Source venue reporting the event (e.g., Bybit, Binance, OKX).
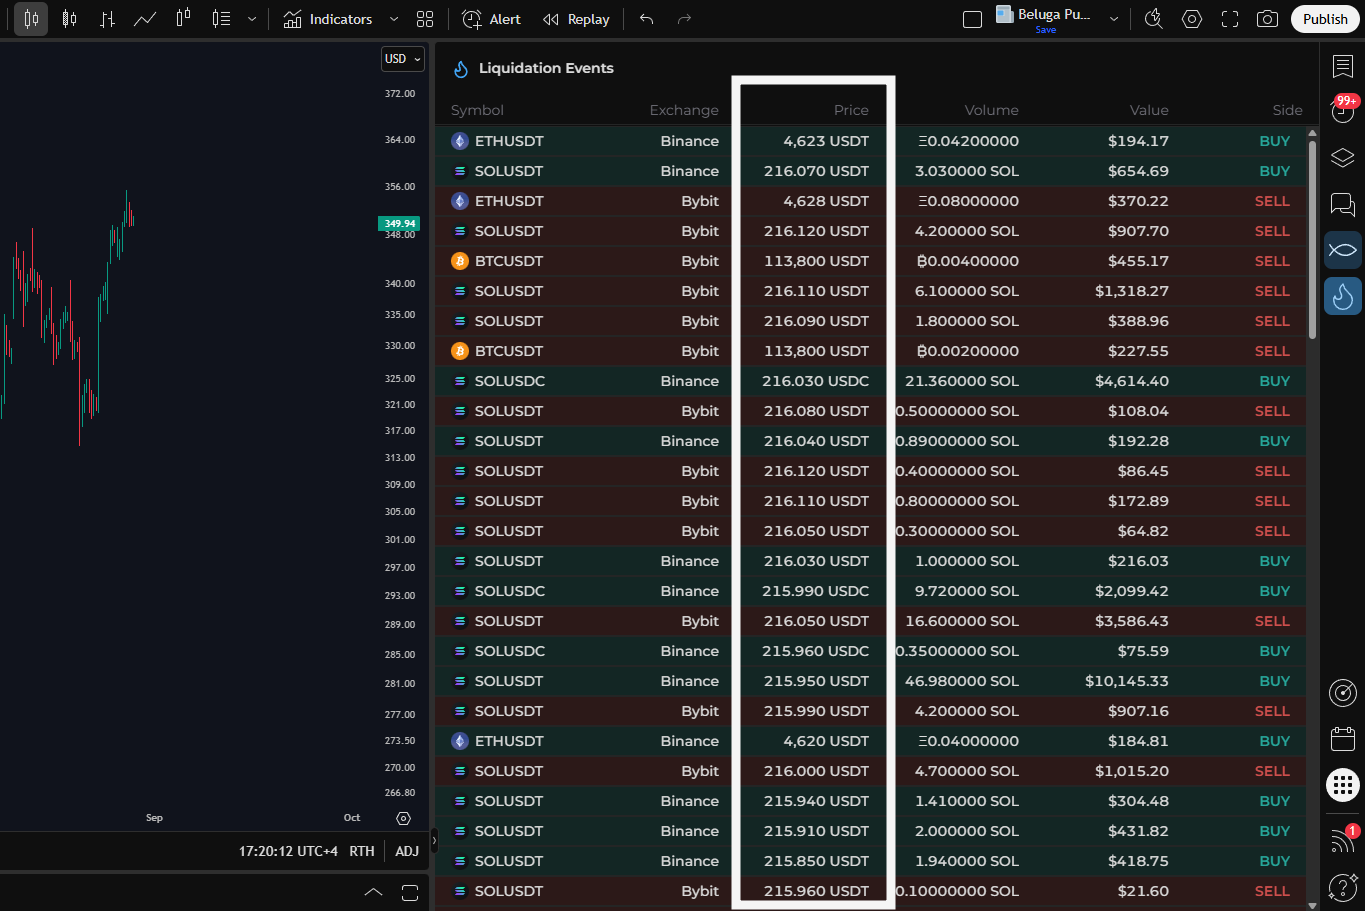
Price – Execution price of the liquidation order at the moment it was closed.
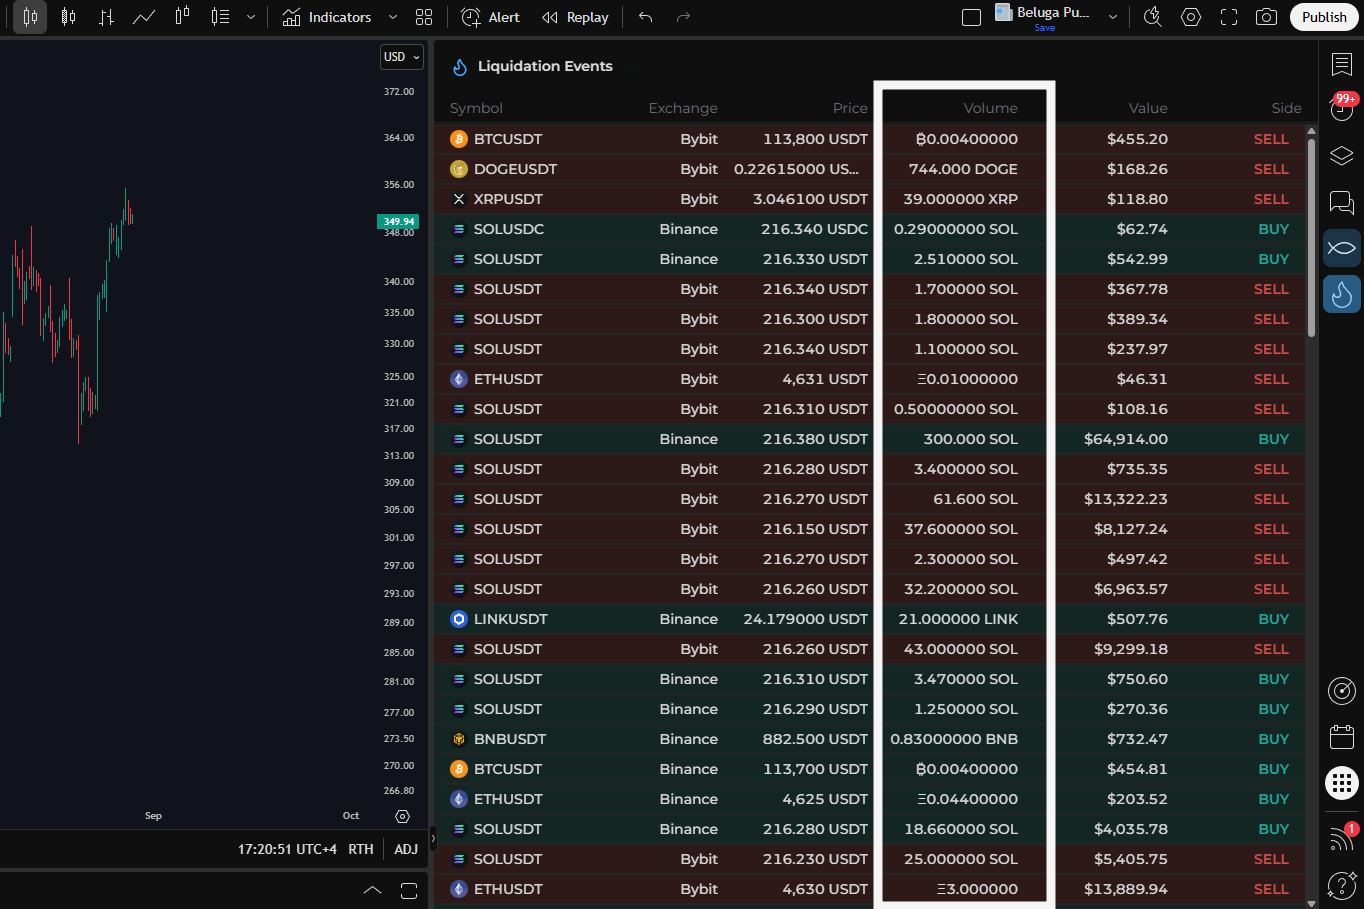
Volume – Quantity liquidated (coin amount as reported by the exchange).
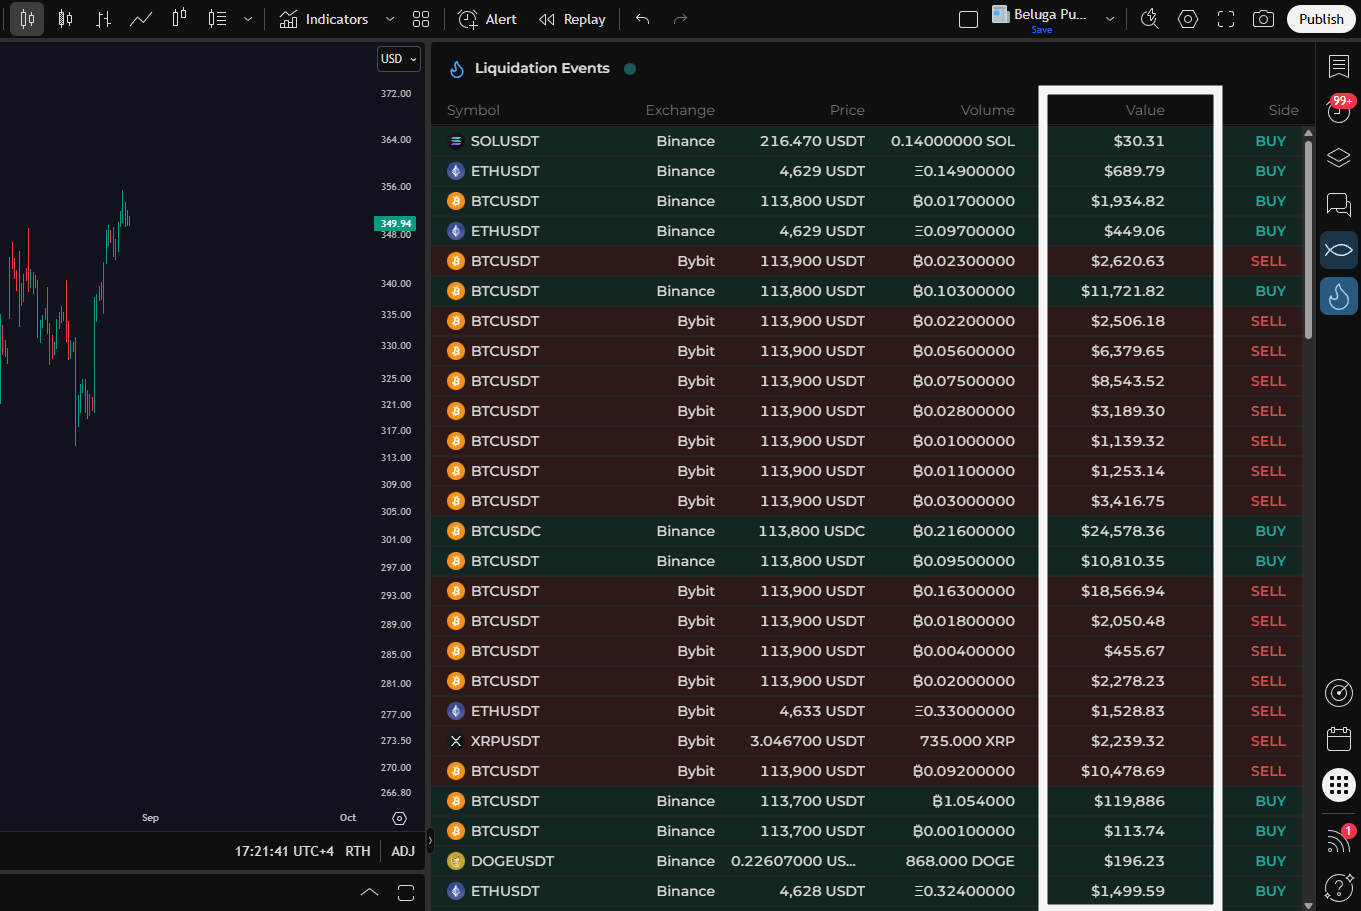
Value – Notional value of the liquidation, shown in USDT.
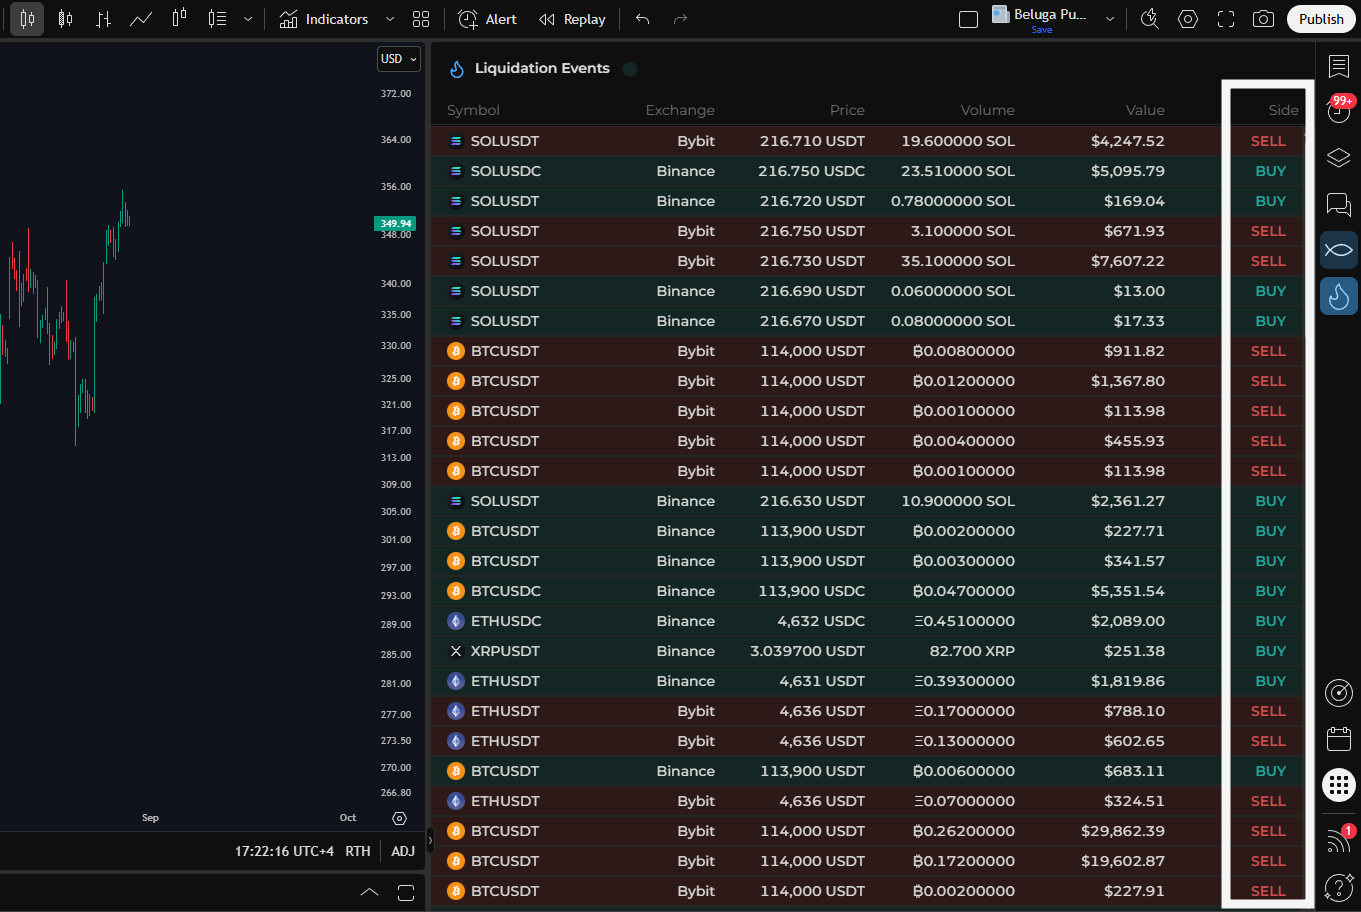
Side – Direction of the forced close:
- SELL = short positions liquidated (down-move flushes).
- BUY = long positions liquidated (up-move squeezes).
Live Data Feed
The table updates continuously as exchanges publish new liquidation prints, allowing you to:
- See bursts of clustered liquidations during volatile moves.
- Track momentum continuation after a cascade begins.
- Gauge whether pressure is one-sided (mostly BUY or SELL liquidations) or mixed.
Use Cases
- Identify squeezes & cascades: Rapid sequences of BUY (short) or SELL (long) liquidations often precede extension or exhaustion.
- Confirm liquidity sweeps: Spikes in liquidations near key levels validate that stops were triggered.
- Add confluence to entries/exits: Align prints with order-flow tools, OB levels, or trend signals.
- Risk awareness: Stand aside (or tighten risk) when the tape shows accelerating liquidation clusters.
