

 X
 Discord
 Instagram
 YouTube
 ChatGPT
Settings
Every input of the Nautilus Mean Reversion Screener lives in one window, split into two labelled blocks: SETTINGS for the engines and DASHBOARD SCREENER SETTINGS for the panel itself.
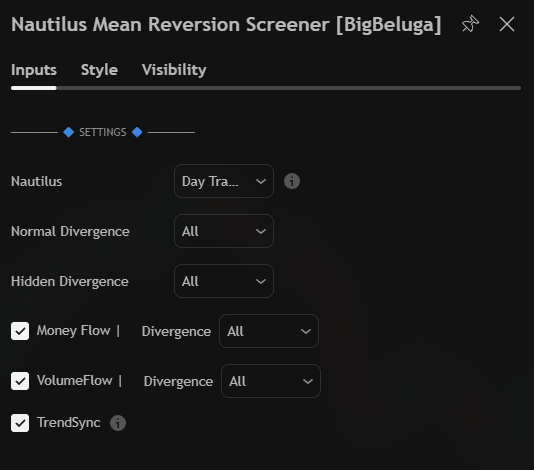
Engine controls
| Input | Default | What it does |
|---|---|---|
| Nautilus | Day Trader |
The trading style preset that recalibrates every engine at once |
| Normal Divergence | All |
Direction filter for regular divergences in the matrix |
| Hidden Divergence | All |
Direction filter for hidden divergences in the matrix |
Money Flow + Divergence |
on, All |
Switches the MFI engine on and filters which divergence direction it reports |
VolumeFlow + Divergence |
on, All |
Same for the CVD engine |
| TrendSync | on | Switches the structural bias row on |
Every divergence selector reads All out of the box, so both bullish and bearish readings appear. Narrow one when you only trade a single side and want the table quiet.
Presets
The Nautilus dropdown holds Scalper, Day Trader and Swing Trader. It is the only input that changes what counts as "stretched", so change it deliberately and then re-read the table - colours earned under one preset do not mean the same thing under another.
Switching preset does not reset the matrix. Old cells keep their age and fade on the same scale; only new evaluations use the new sensitivity.
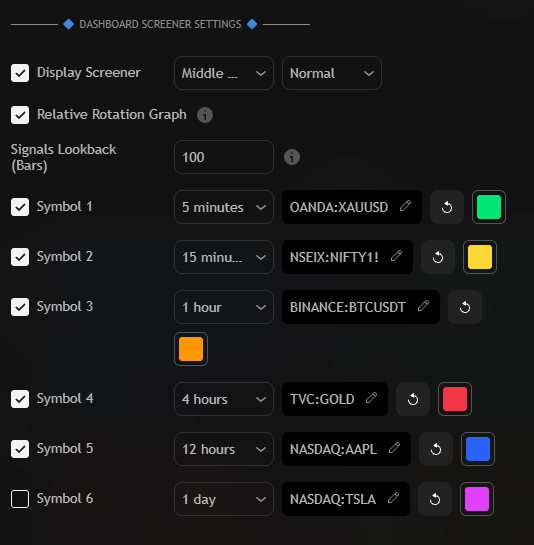
Dashboard Screener Settings
| Input | Default | Effect |
|---|---|---|
| Display Screener | on, Middle, Normal |
Shows or hides the matrix, sets where it sits on the chart and its text size |
| Relative Rotation Graph | on | Draws the quadrant panel next to the matrix |
| Signals Lookback (Bars) | 100 |
How many bars a signal stays visible after it fired |
The Signals Lookback is the one worth thinking about. It is the outer limit of the fade: past that many bars a cell becomes - and drops out of your scan. Set it to roughly the length of the move you trade - long enough that a setup is still visible, short enough that old news does not crowd the table.
Asset slots
Six slots, each with:
- an on/off checkbox - the slot is skipped entirely when unticked
- a timeframe dropdown - independent per slot
- a ticker field - any symbol your TradingView plan can load, swapped with the arrows
- a colour swatch - the dot and trail colour used in the Relative Rotation Graph
Mixing timeframes across the six slots is the intended use. A basket of your usual instruments read on the timeframe you actually trade each one is more useful than six copies of the same chart.
Related
- Alerts - which events can notify you
- Signals (Buy/Sell) - what the signal row means
- Relative Rotation Graph - the panel next to the table
