
 X
X Facebook
 Discord
 Instagram
 YouTube
 ChatGPT
Trend Signals
Trend Signals automatically scan the market to identify potential directional shifts. The system processes multiple technical data points to overlay clear, real-time visual markers directly onto the c
Trend Signals automatically scan the market to identify potential directional shifts. The system processes multiple technical data points to overlay clear, real-time visual markers directly onto the chart.
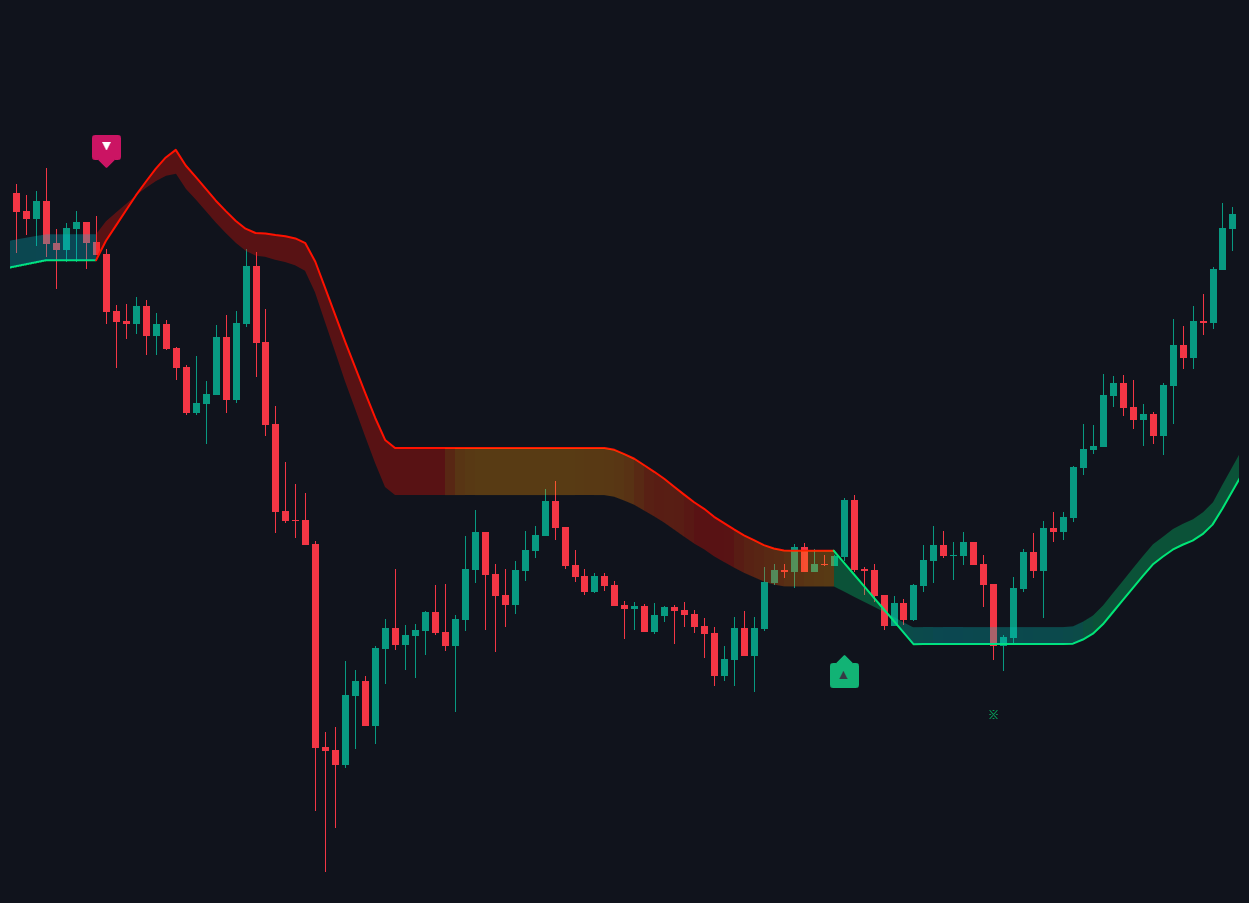
(represented by simple triangles) indicate regular trend-following opportunities.
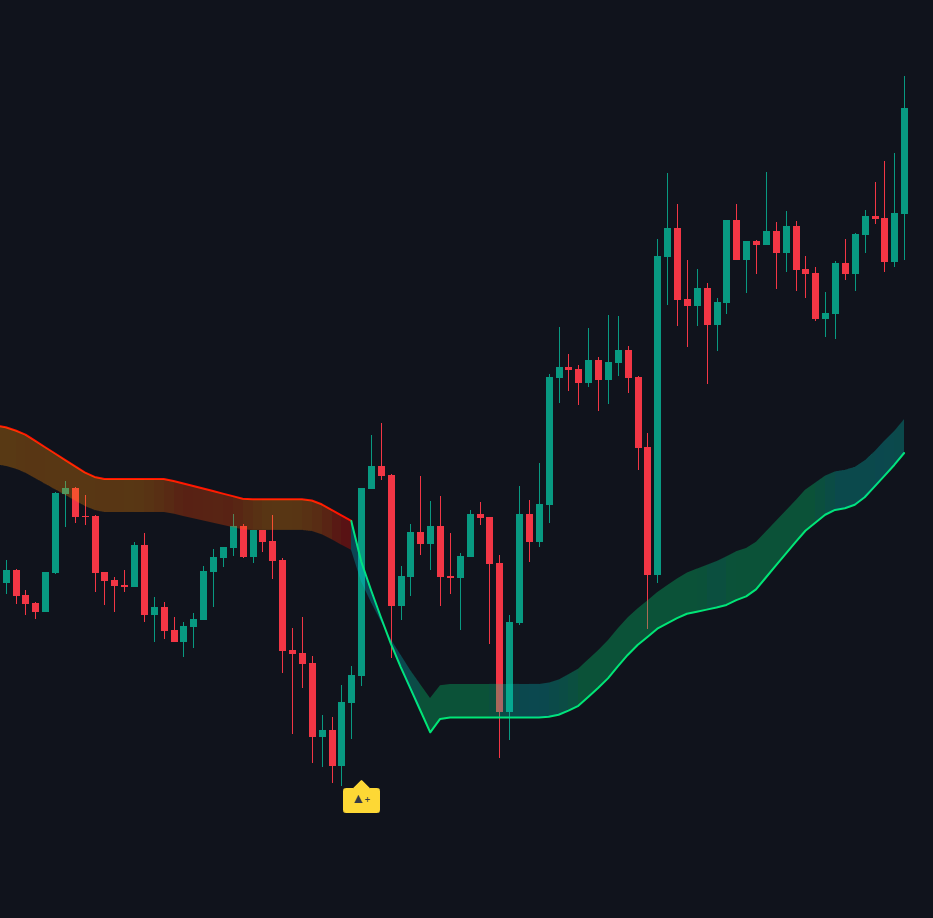
(triangles with a +) suggest stronger momentum, meaning these signals are more likely to play out successfully.
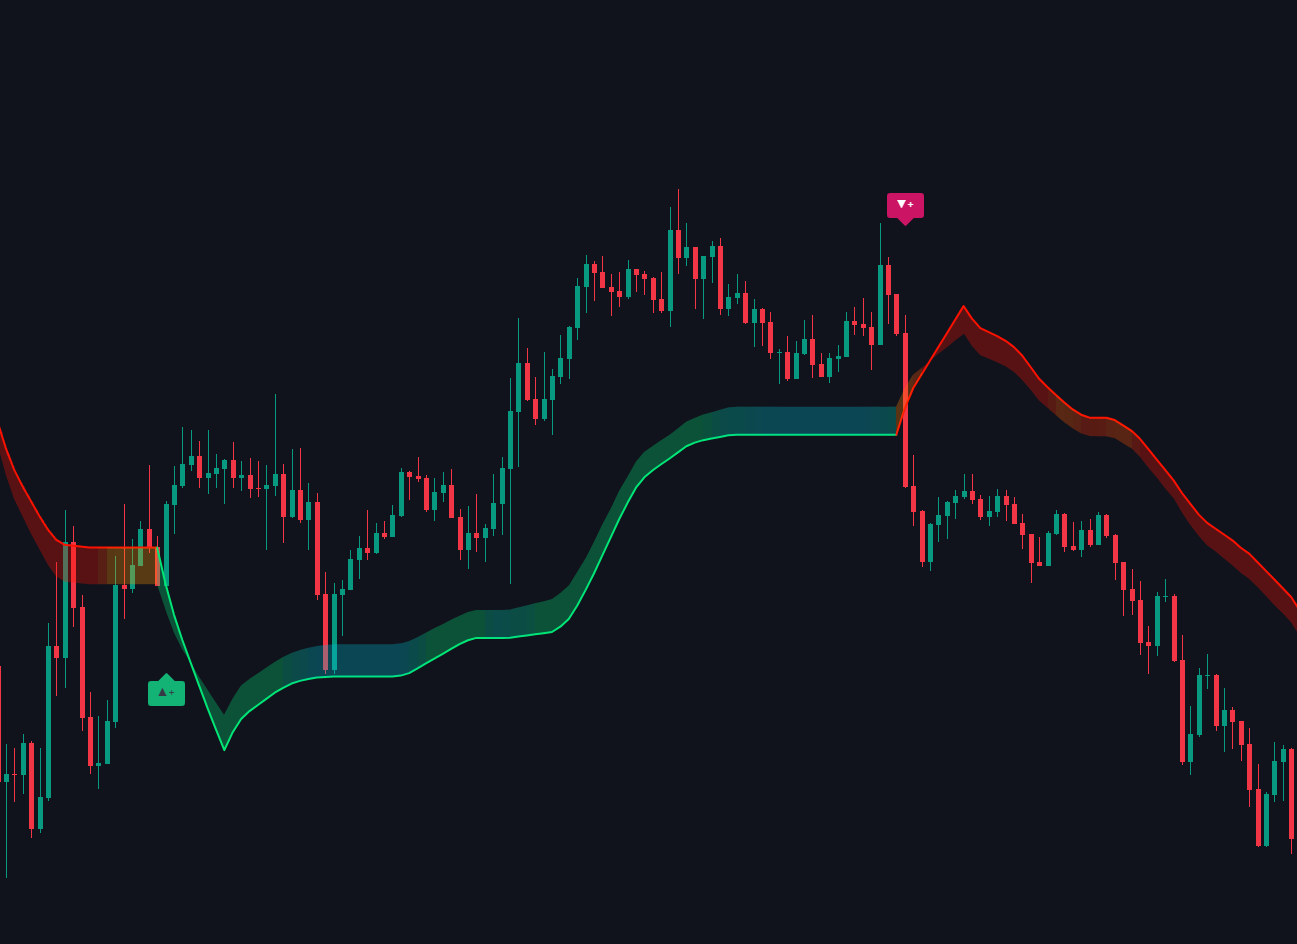
These signals highlight high-probability bullish setups, typically appearing after strong downside moves or oversold conditions
These signals identify high-probability bearish setups, typically appearing after strong upside moves or overbought conditions.
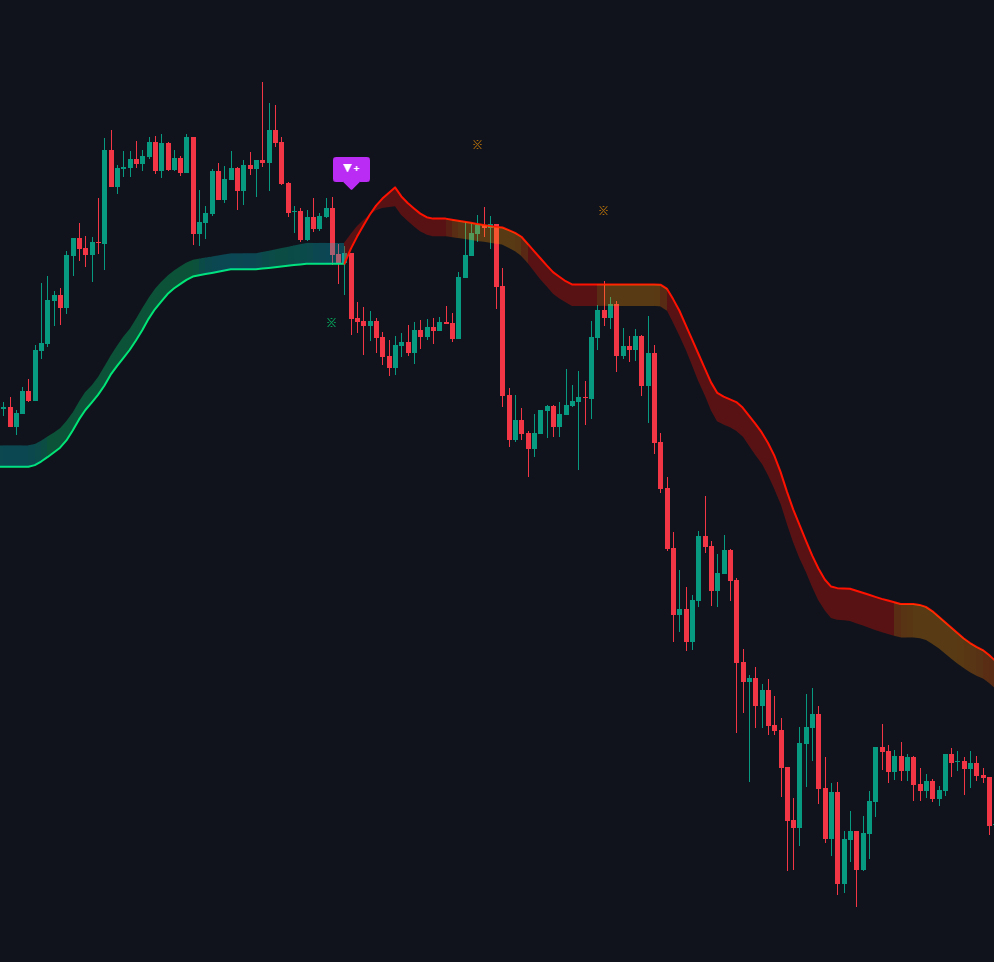
Trend Signal Filtering
Signals filter using distinct algorithmic layers:
FlowTrend, ActionWave, TrendMagnet, Voltix (Mid Line), VectorShift.
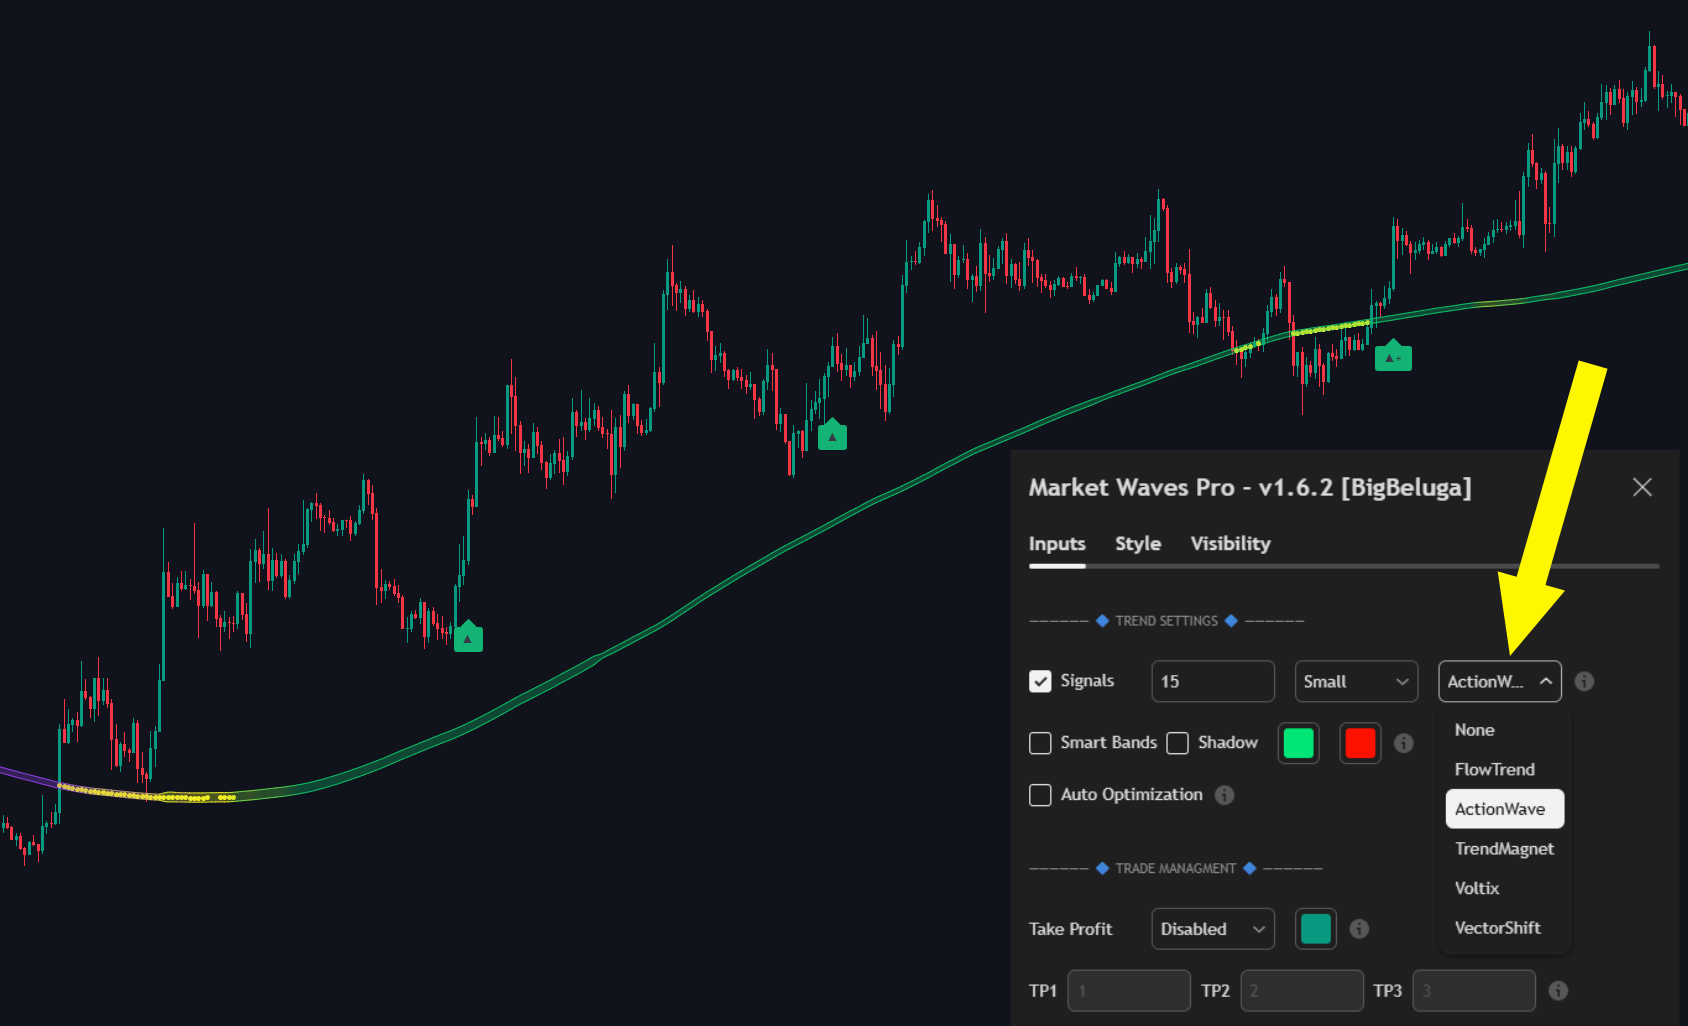
By selecting one of these filters from the dropdown menu, the toolkit will filter primary signals with these secondary trend-following models, ensuring that only signals aligning with the broader market momentum are displayed.
Smart Bands
Smart Bands are dynamic visual bands that automatically adapt to the current price action and trend conditions.
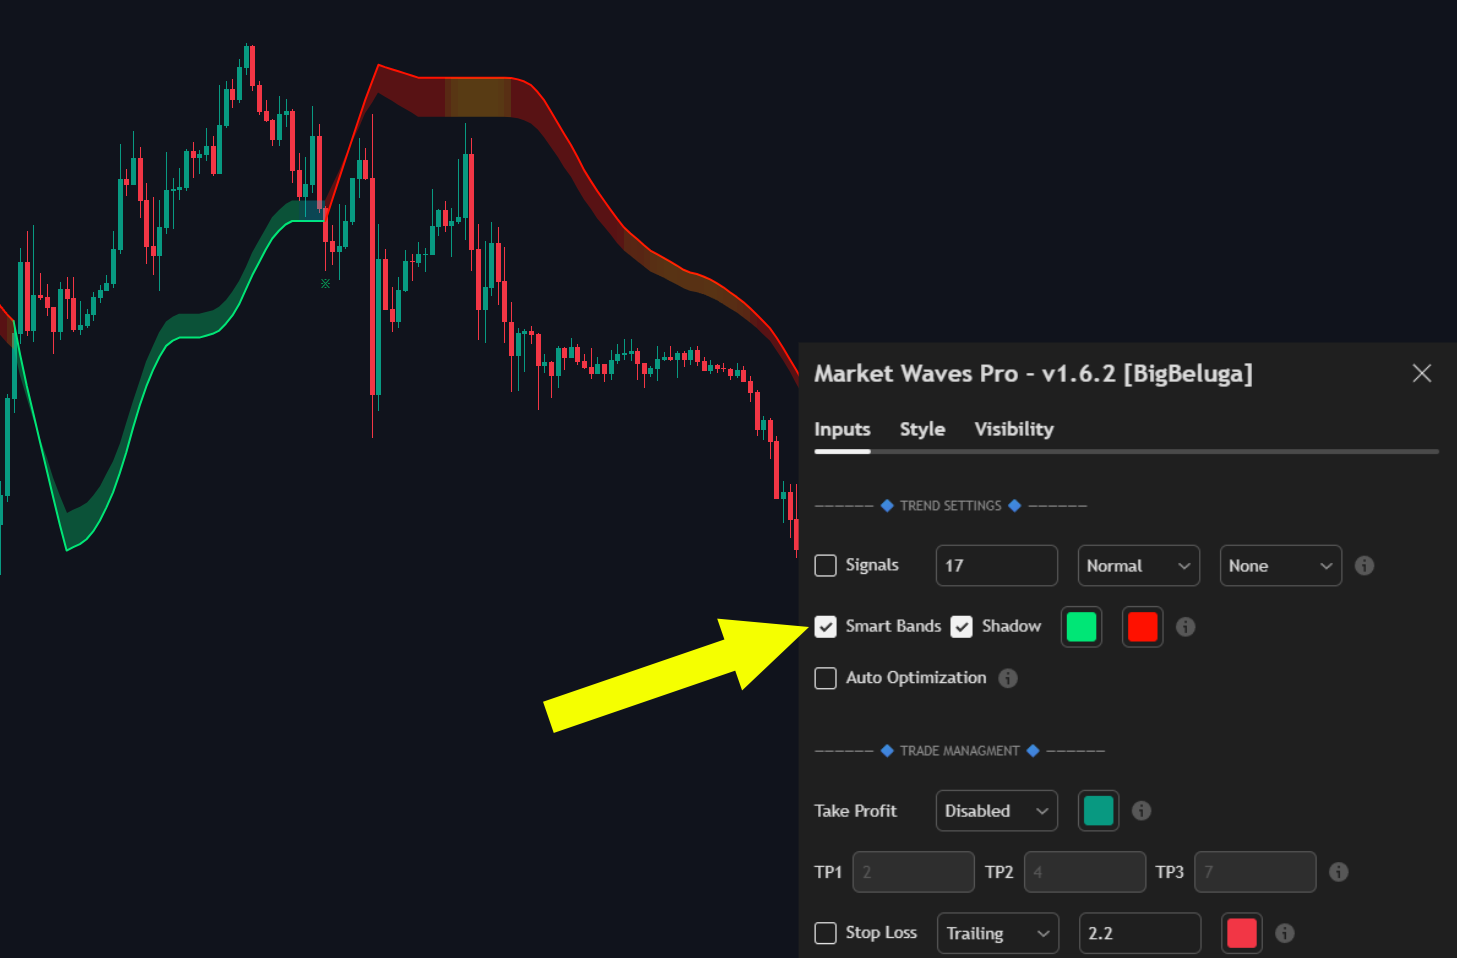
They expand and contract based on volatility and trend strength.
Color and width of the bands adjust in real-time to show momentum and direction.
Bullish/Bearish Retest Signals
Smart Bands also generate high-probability retest signals:
Bullish Retest:
Triggered when price pulls back to test the lower edge of a bullish band and shows strength again.
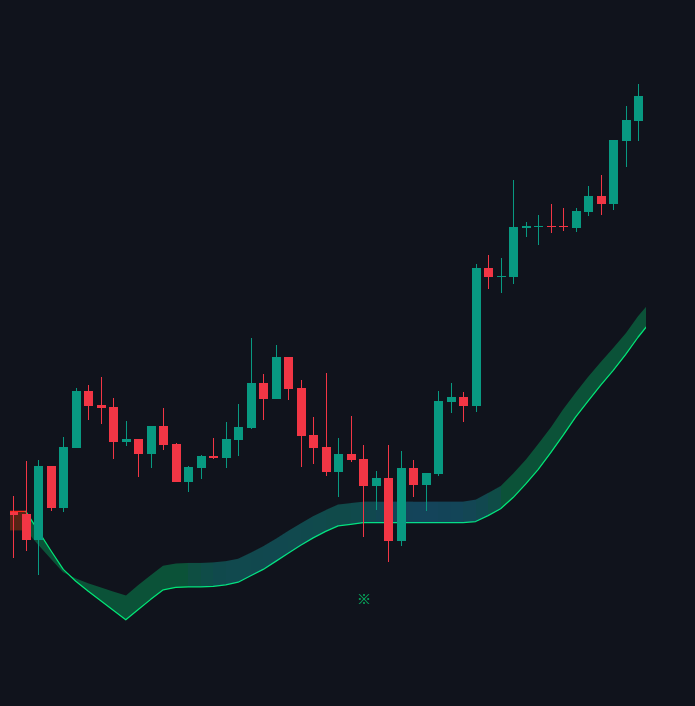
Bullish Retest
Bearish Retest:
Triggered when price retraces into the upper edge of a bearish band and then rejects downward.
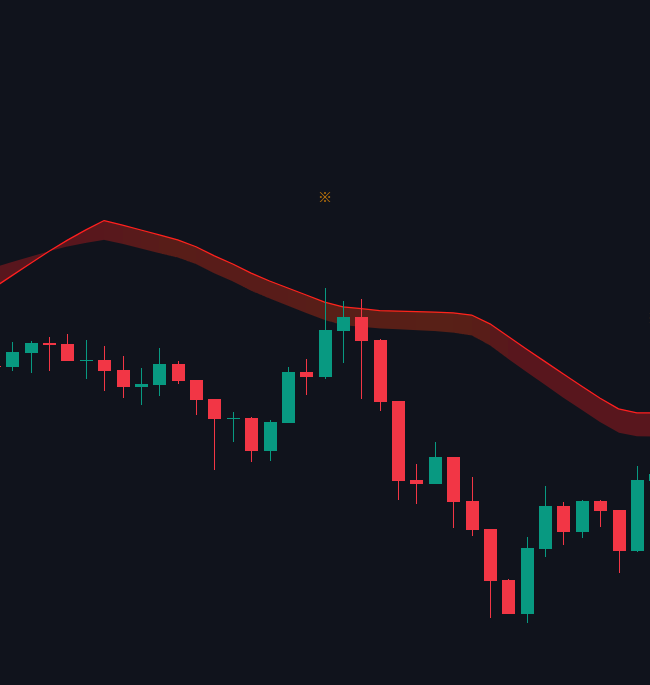
Bearish Retest
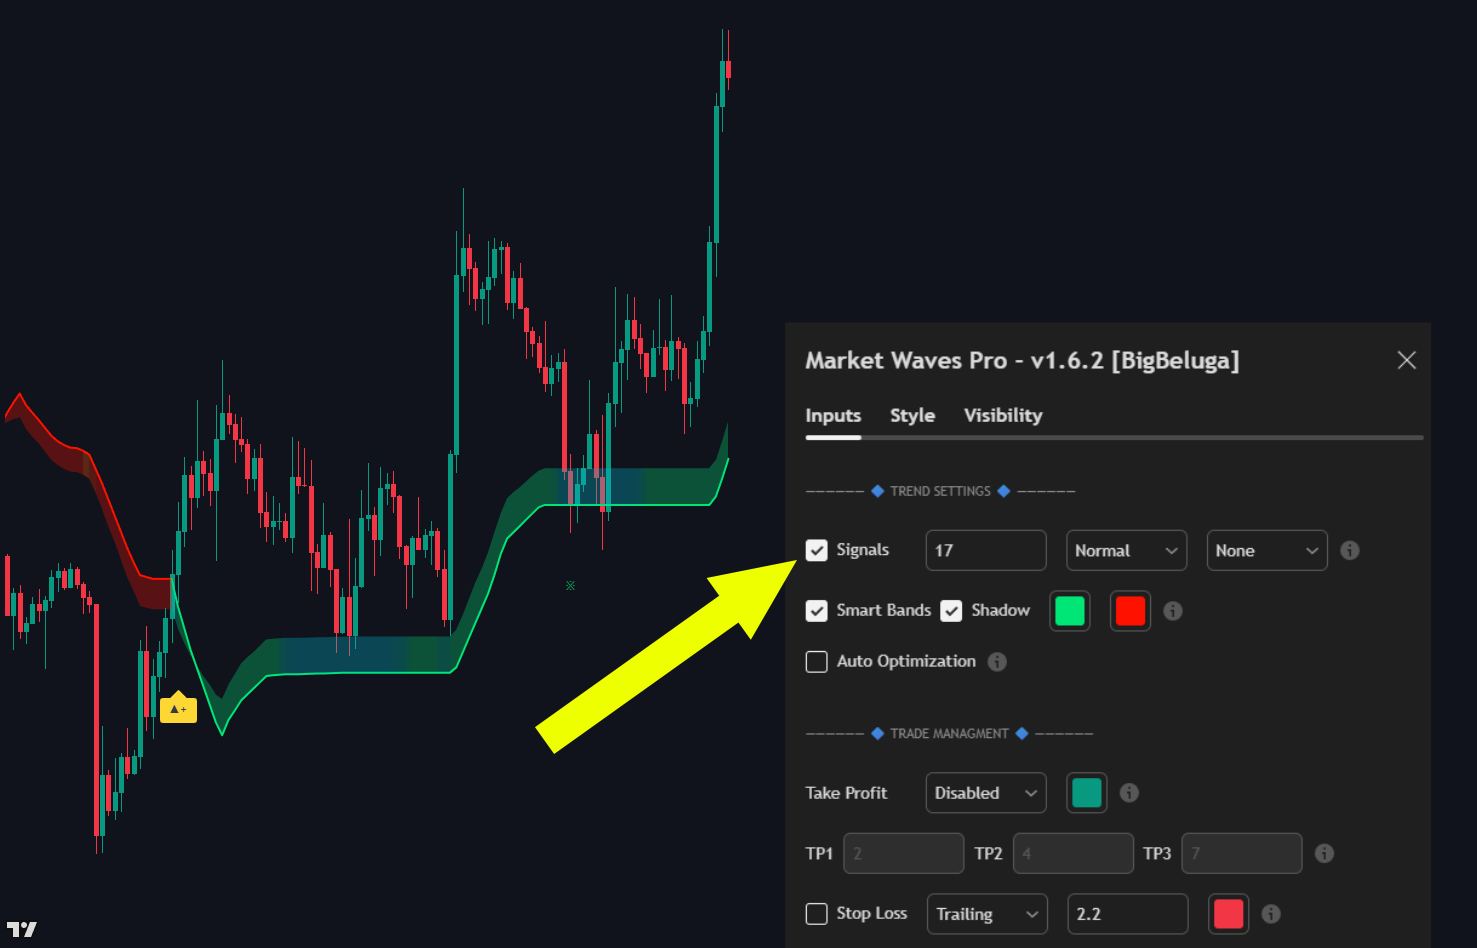
Auto Optimization
Auto Optimization intelligently tunes the trend signal sensitivity without manual adjustment.
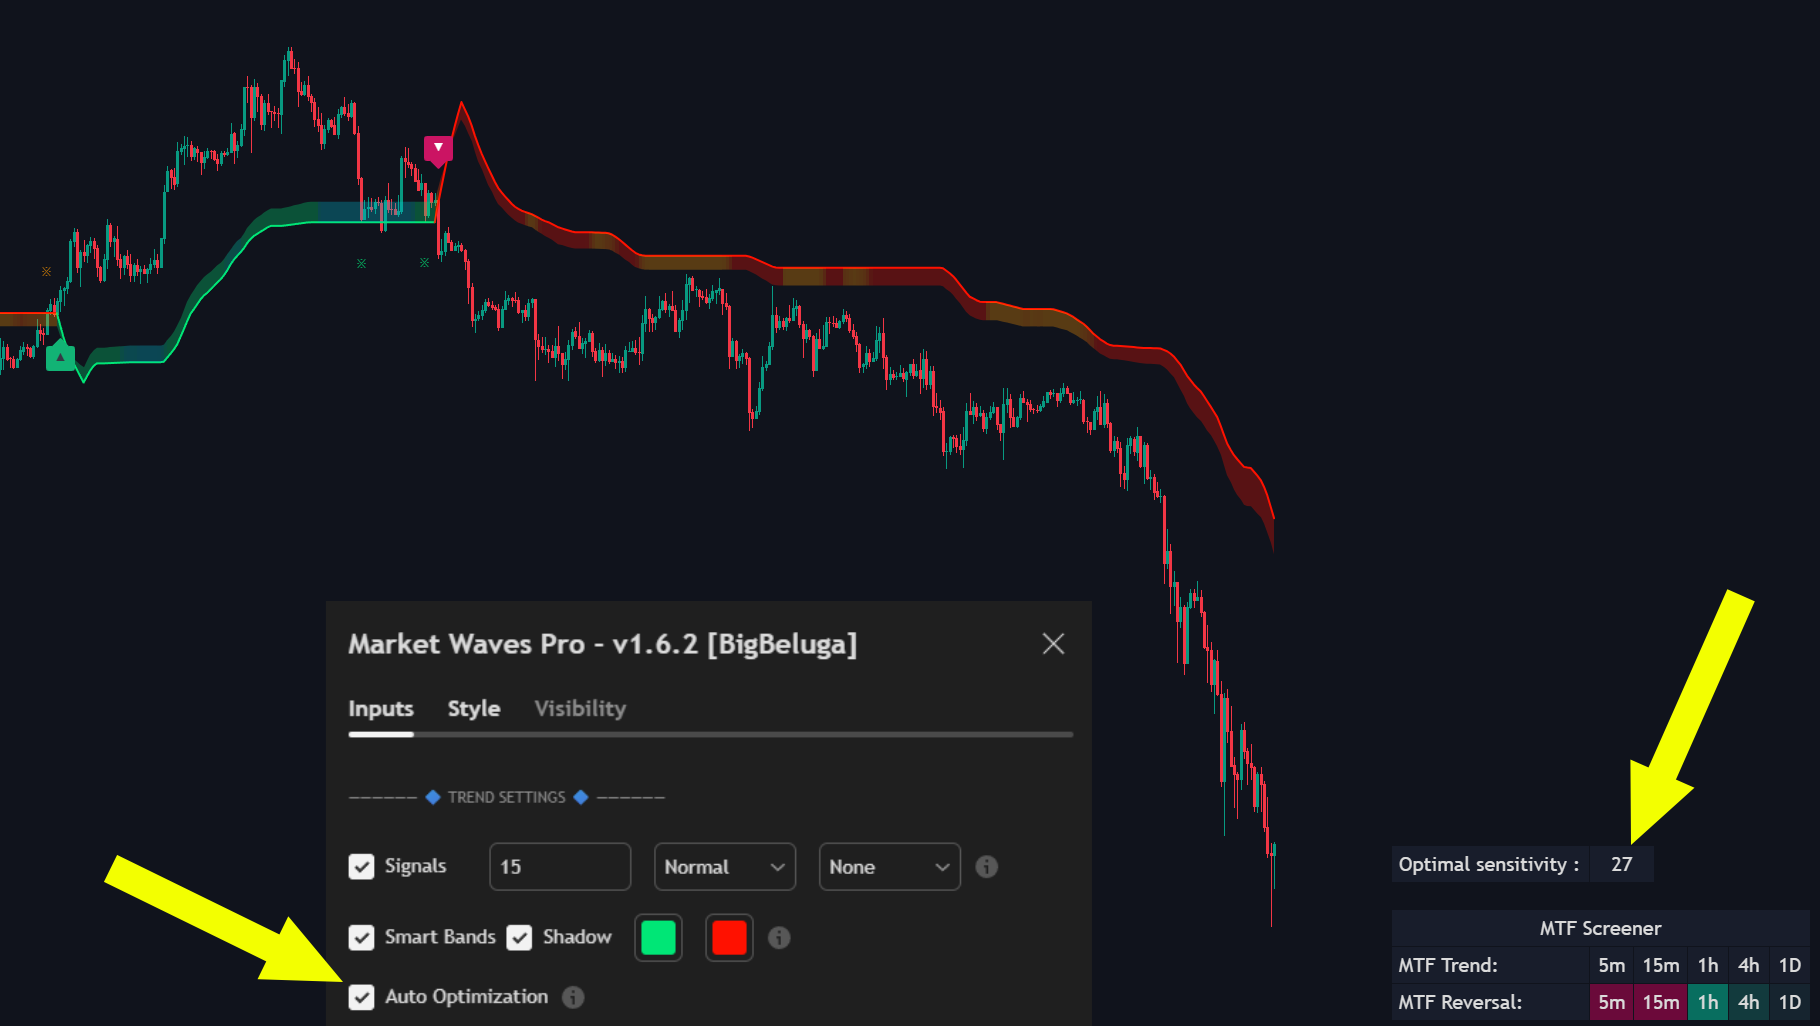
- It backtests the last 2000 bars to determine the most effective signal setting based on Net Profit and %Win Rate.
- Automatically applies the best-performing sensitivity for current market conditions.
Trade Managment
This section controls your profit targets and risk protection for active trades:
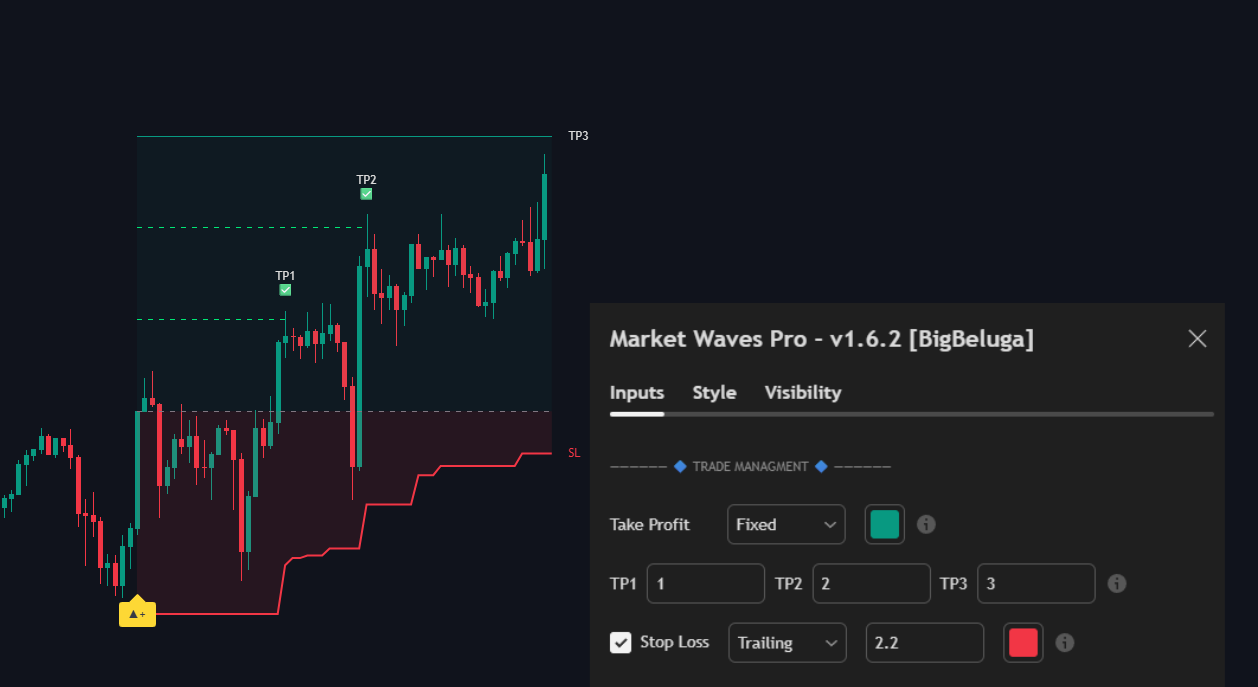
Take Profit System
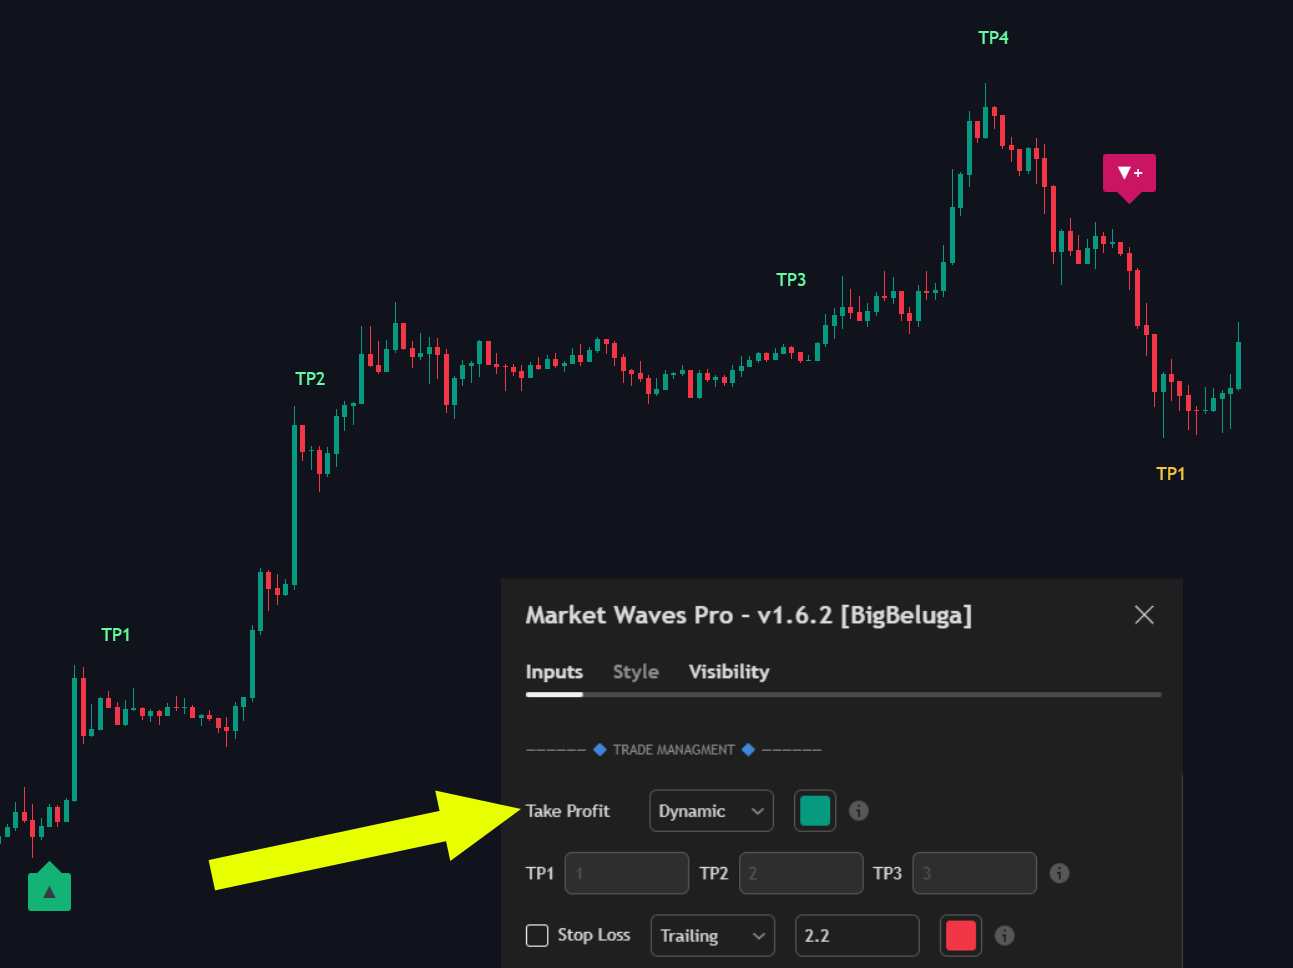
This tool automatically calculates and displays exactly where to take profits after a trade starts.
How it works:
Smart Options: Choose between Dynamic, Fixed, or Disabled modes depending on the trading strategy.
When set to Fixed, profit targets are calculated using a specific percentage distance from your entry price:
- Percentage-Based Exits: Enter values for TP1, TP2, and TP3 as percentage gains (e.g.,
1= 1%,2= 2%,3= 3%). - Visual Chart Markers: Displays target lines and completion checkmarks as price hits each level.
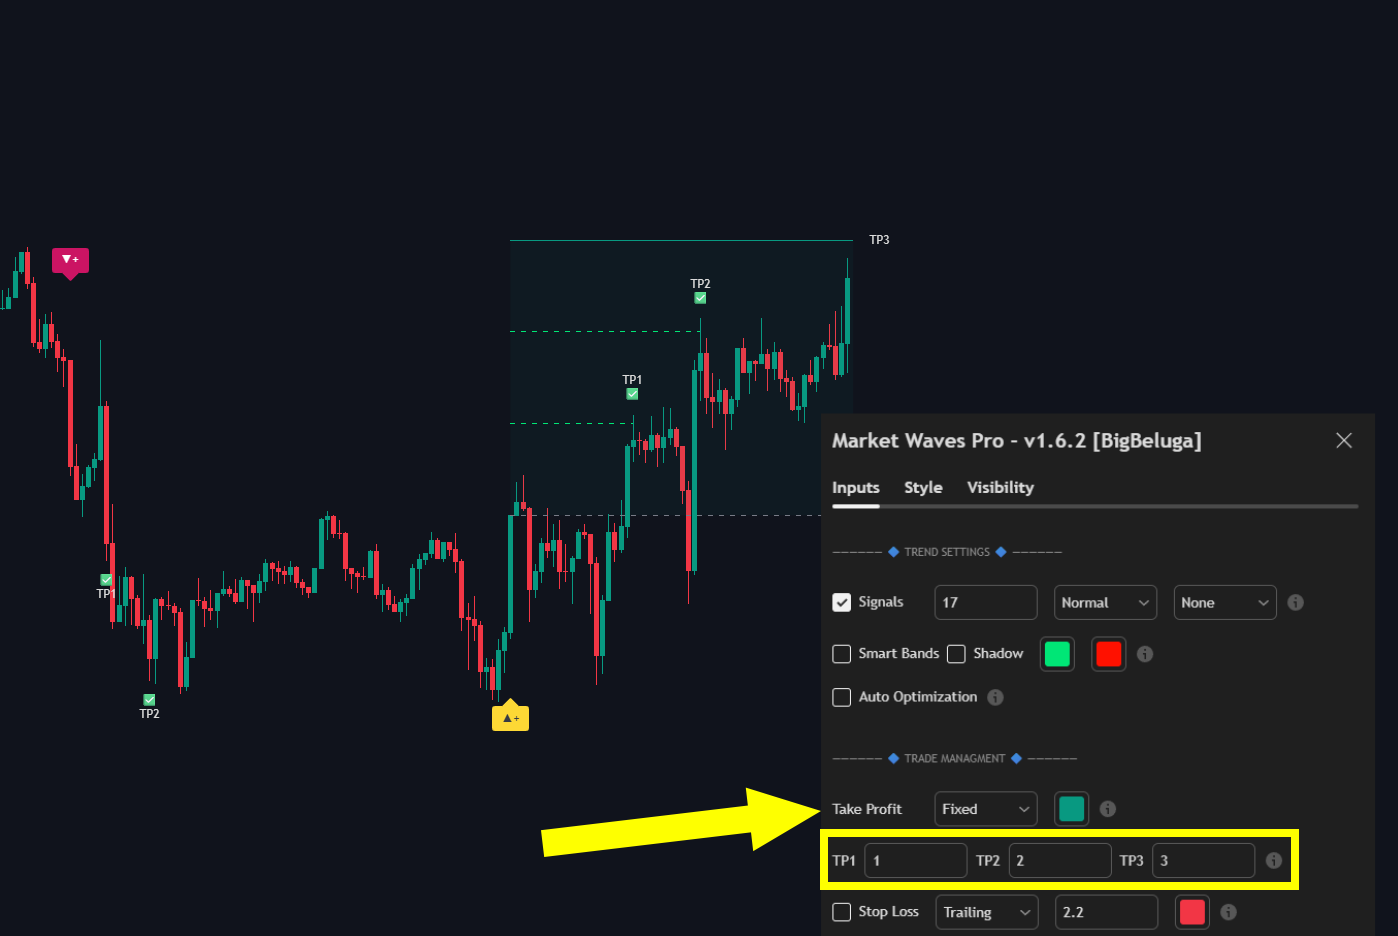
Fixed TakeProfits
When set to Dynamic, profit targets adapt automatically based on real-time market conditions:
- Market-Adaptive Exits: Calculates up to 6 TP levels using market volatility, trend strength, and price action.
- Smart Multi-Targets: Scales targets dynamically to capture larger moves during strong trends while staying tighter in calmer markets.
Stop Loss System
A complete risk management system with two main stop loss modes.
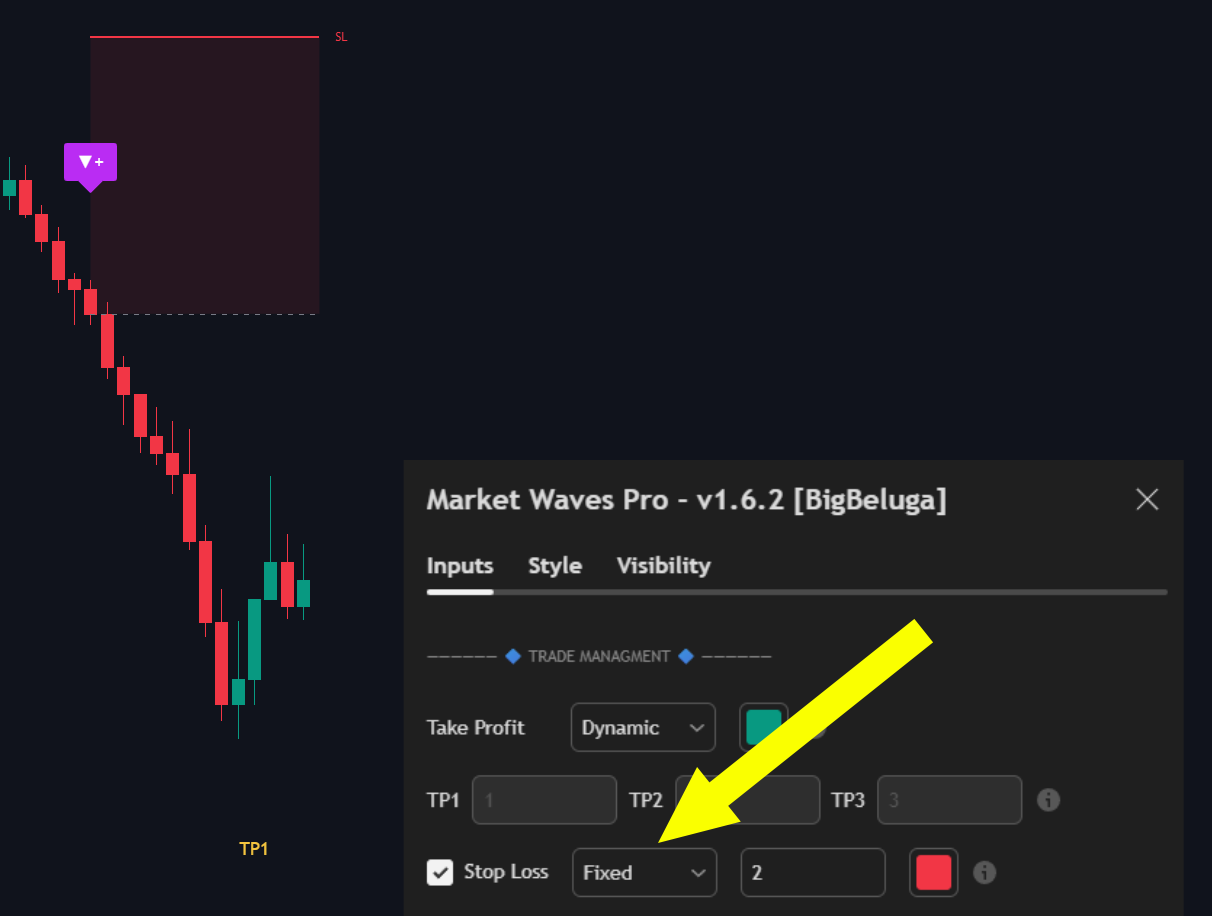
Sets a firm, static protection line based on a pre-defined distance from the entry price in %.
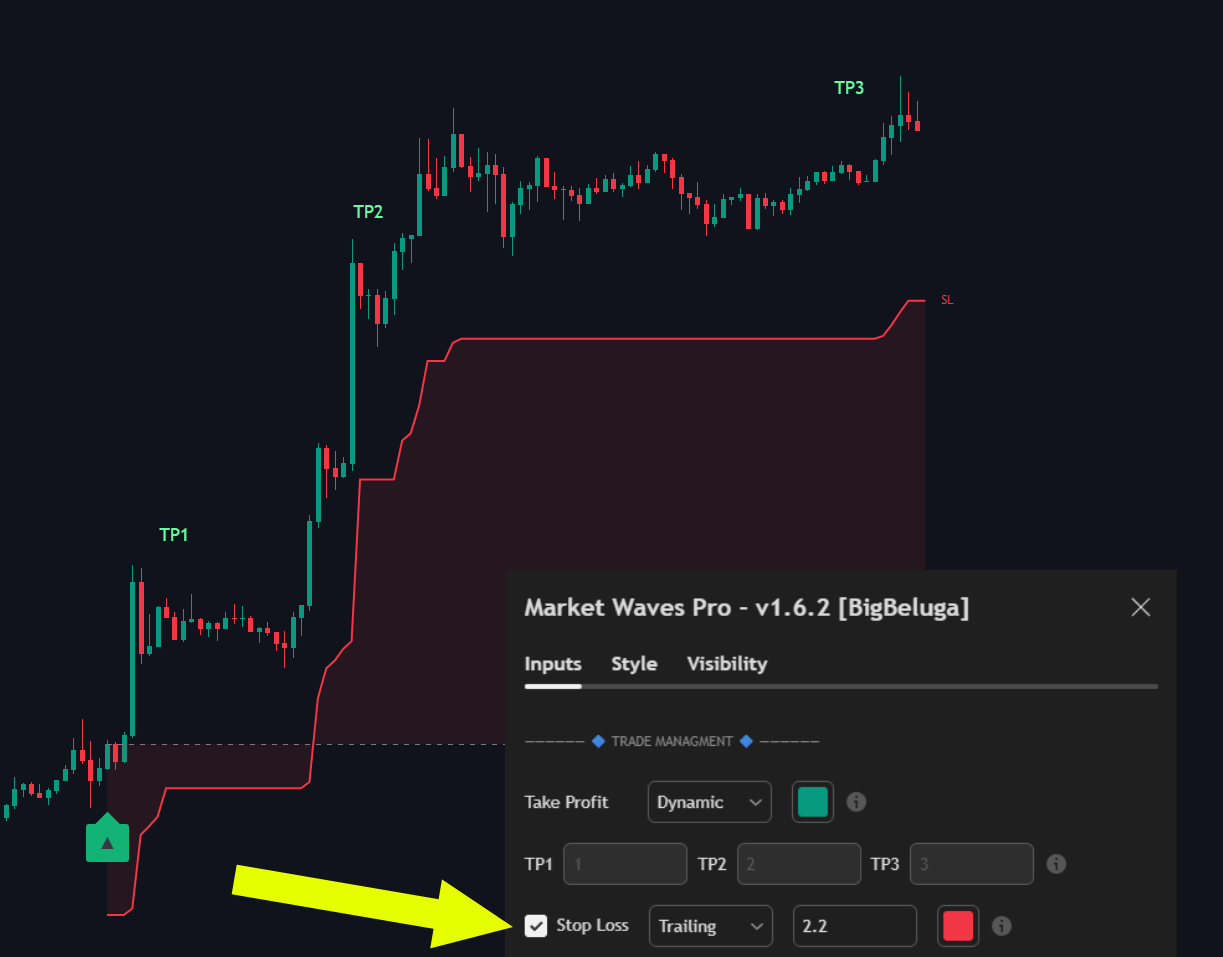
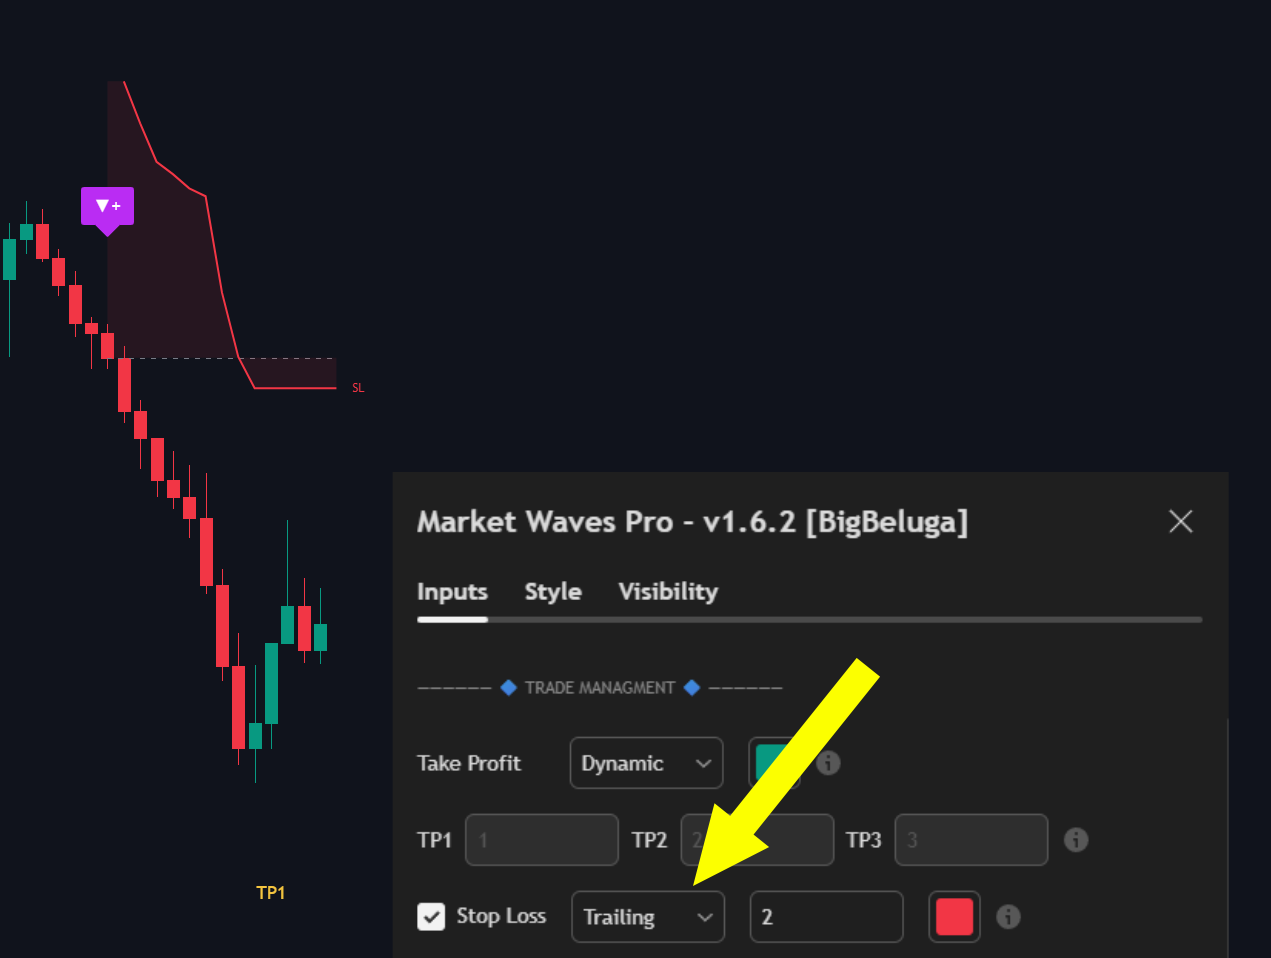
Dynamically moves the stop line higher as price expands, tracking market momentum to lock in unrealized profits while giving trades room to breathe.
Settings
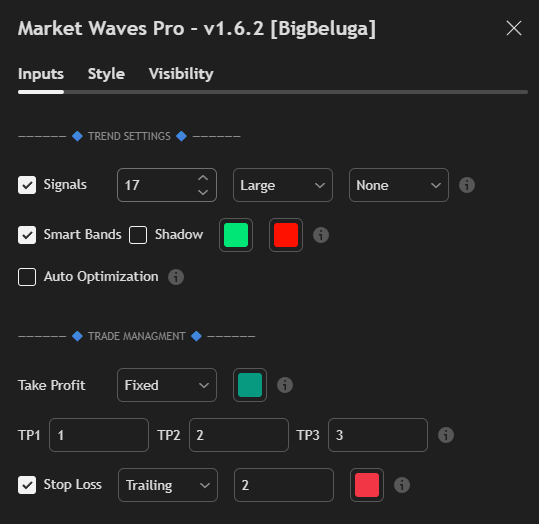
| Setting | Description |
|---|---|
| Signals | • Sensitivity: Lower values (5–10) increase signal frequency; higher values (20–30) filter noise for stronger trends. • Size: Adjusts label size on the chart (Tiny, Small, Normal, Large, Huge). • Filter: Choose between FlowTrend, ActionWave, or TrendMagnet to cross-verify signals with secondary trend models. |
| Smart Bands | Adds adaptive ribbons to visualize trend strength. Can be used as a filter (e.g., only taking longs while price is in the green band). |
| Shadow | Toggles the visual gradient/glow behind the Smart Bands and Trend signals for a cleaner look. |
| Auto Optimization | Automatically scans the last 2000 bars to find the ideal sensitivity. (Note: Overrides manual signal sensitivity in real time). |
| Take Profit | • Dynamic: Plots up to 6 levels based on volatility and price action. • Fixed: Uses manual percentage-based targets (TP1, TP2, TP3) from the entry price. • Disabled: Removes TP levels for manual exit management. |
| Stop Loss | • Fixed: Sets a firm, static protection line based on a pre-defined distance from the entry price in %. • Trailing: Dynamic exit line that follows price movement to lock in profits. |
