
 X
X Facebook
 Discord
 Instagram
 YouTube
 ChatGPT
Voltix Bands
Better bands for your trading.
Voltix Bands are dynamic volatility-based envelopes designed to detect reversal zones, trend bias, and overextension.
They visually adapt to market behavior and help traders anticipate turning points with precision.
Reversal Signals
When price retests the upper or lower band, the system plots a yellow triangle as a potential reversal signal.
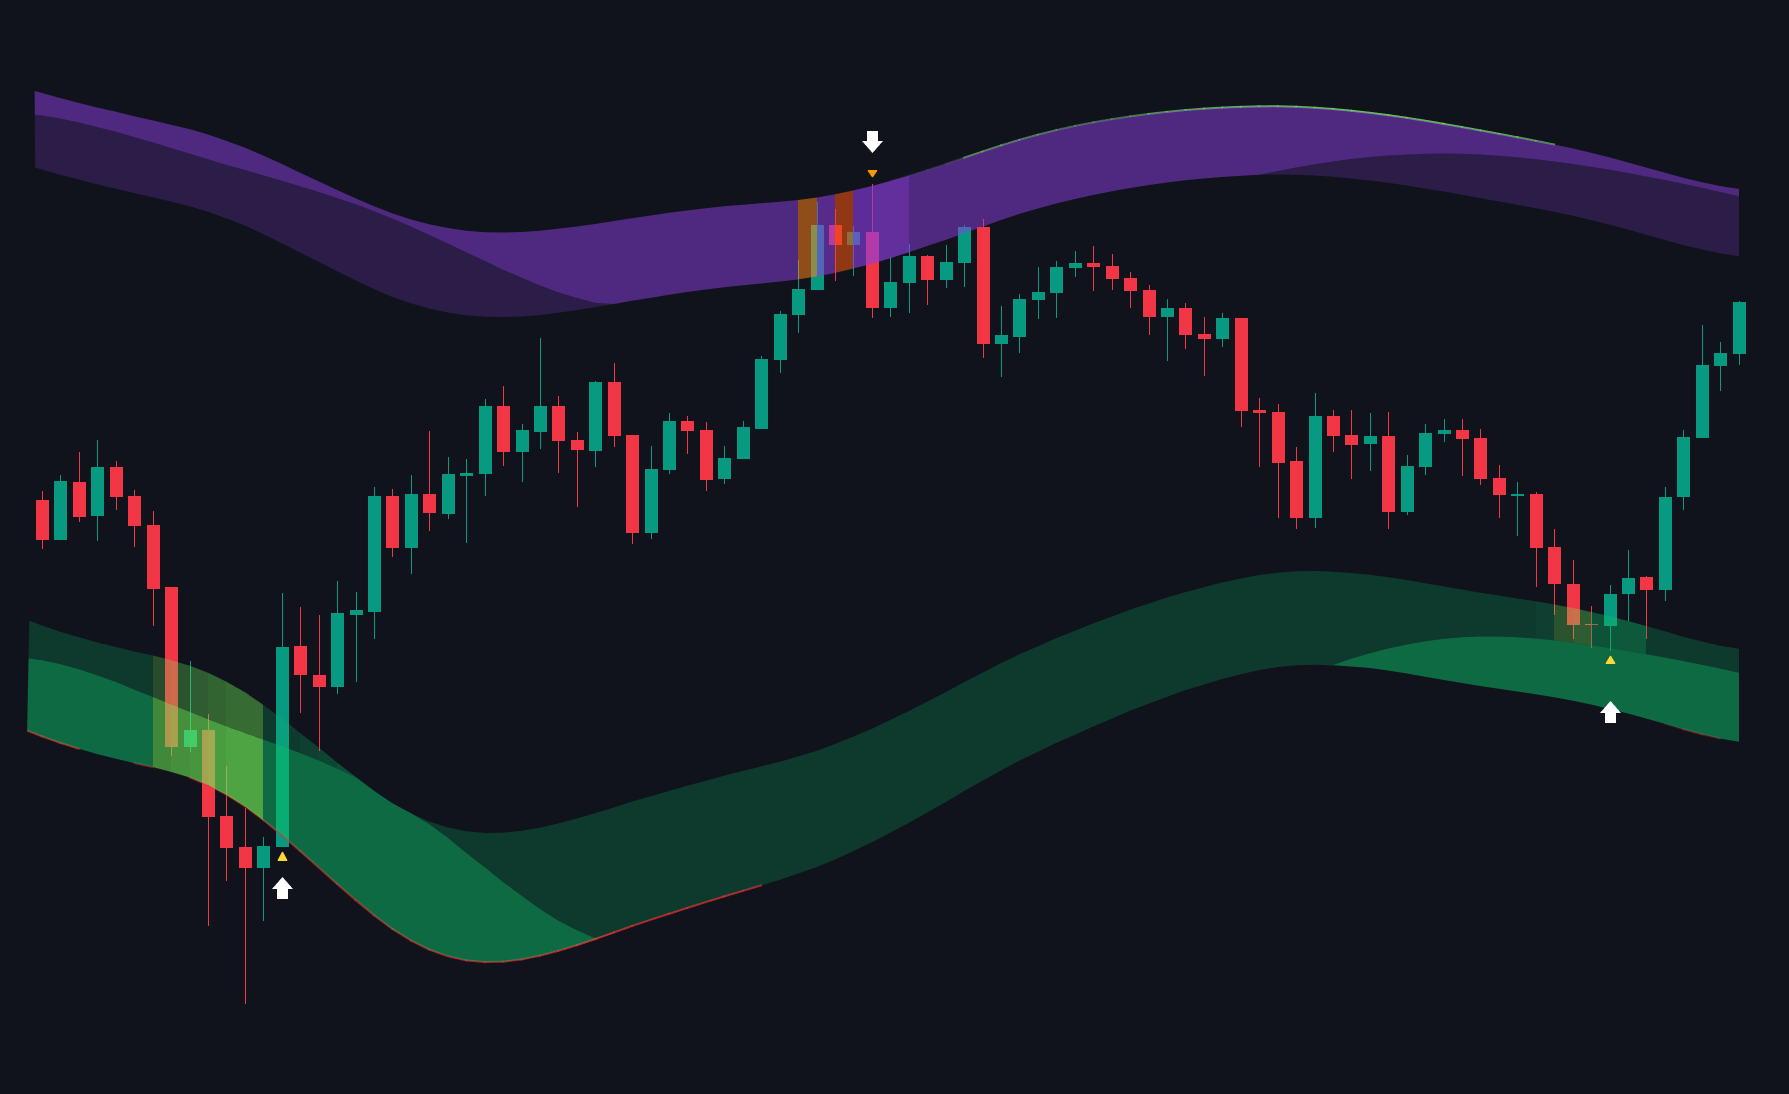
Reversal Signals
Band color shifts
Based on price position:
Above the upper band: color intensifies, signaling bullish overextension
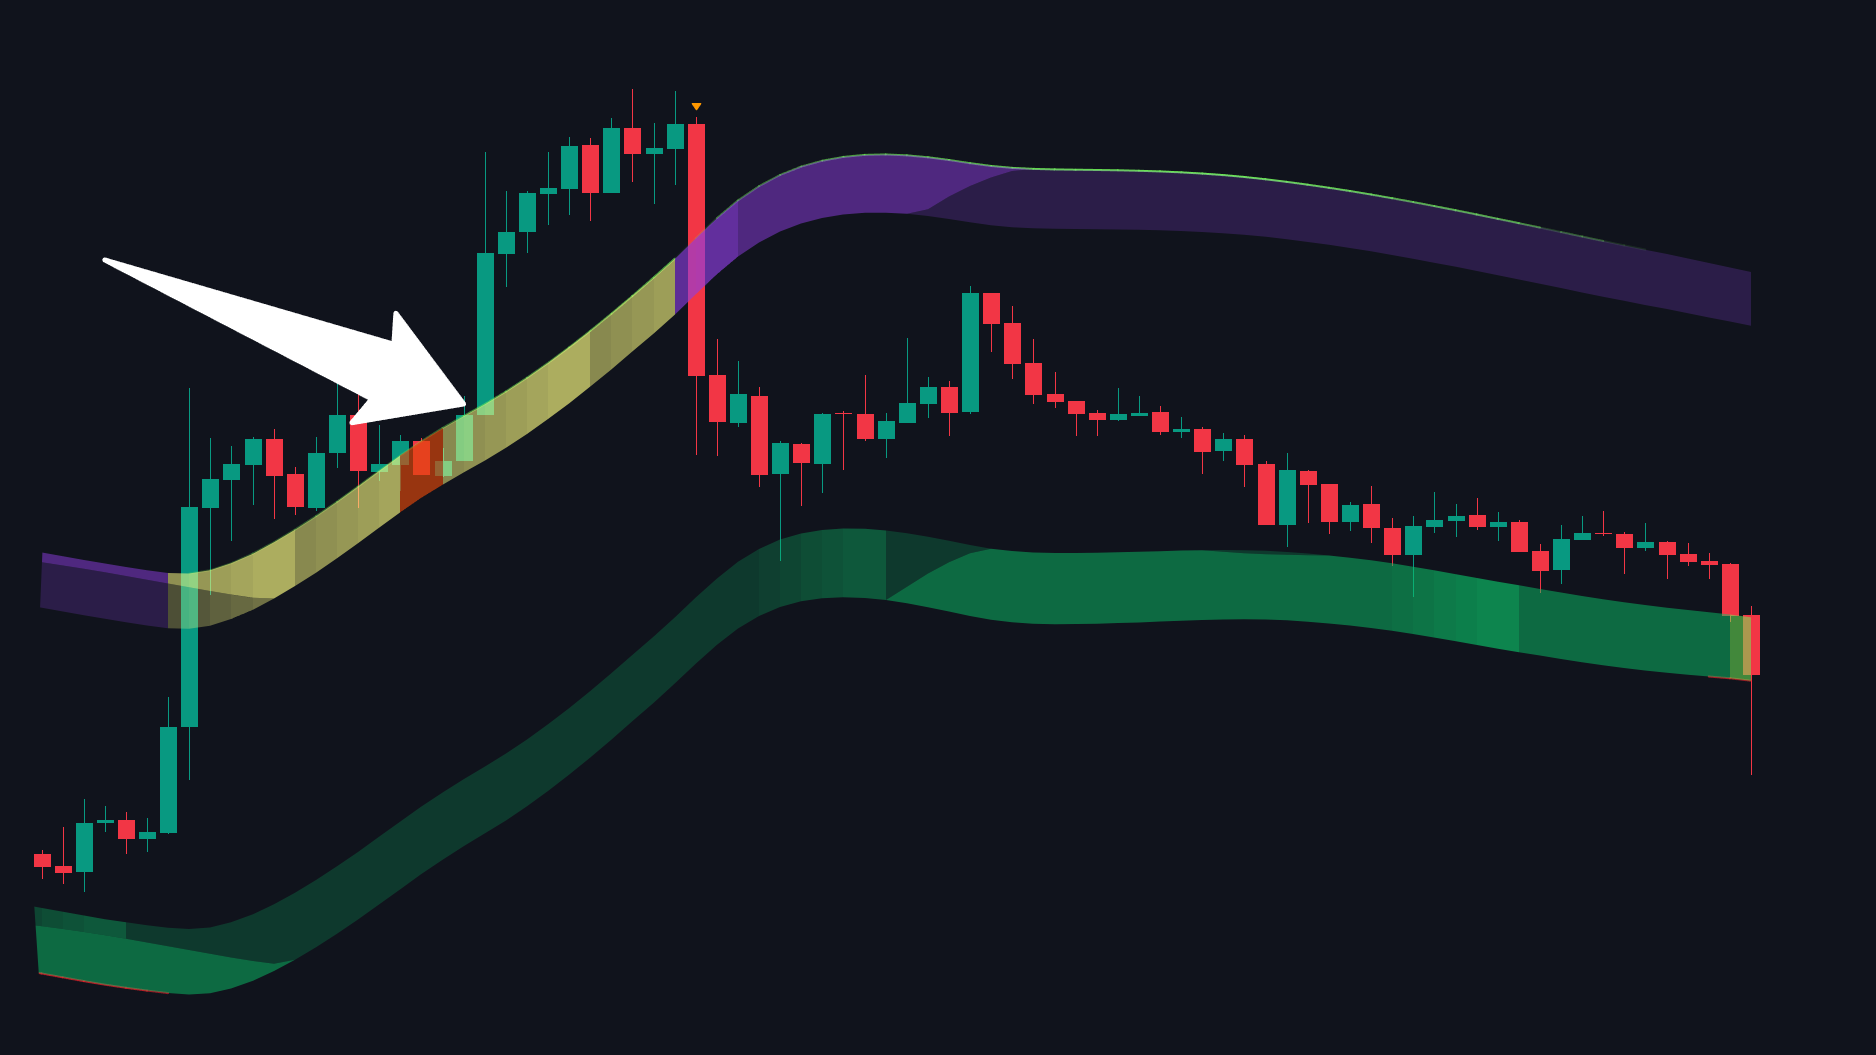
Bullish Overextension
Below the lower band: color intensifies, signaling bearish overextension
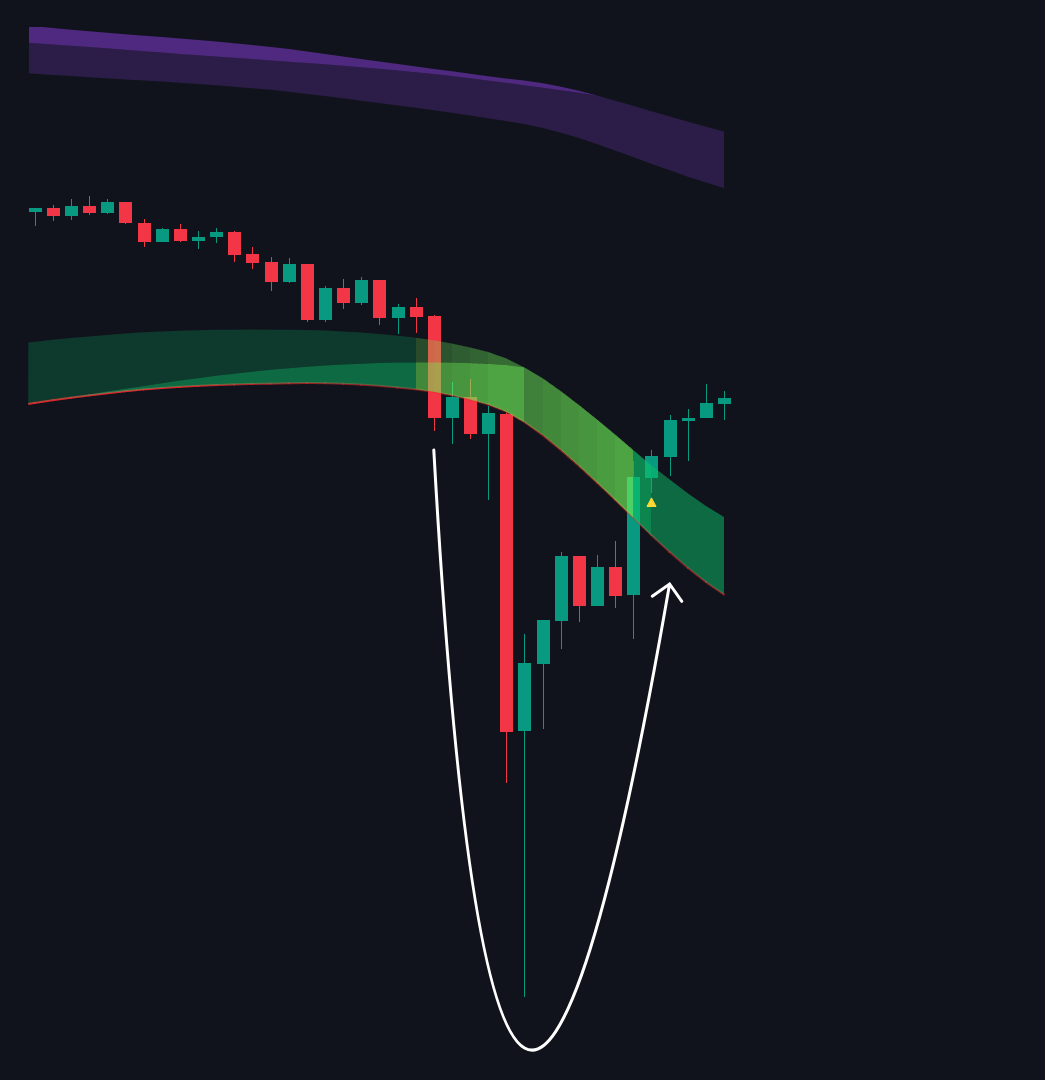
Bearish Overextension
The Voltix Midline

The dotted middle line shows the current trend direction at a glance:
- Green: The market is rising (look for buy setups).
- Purple: The market is falling (look for sell setups).
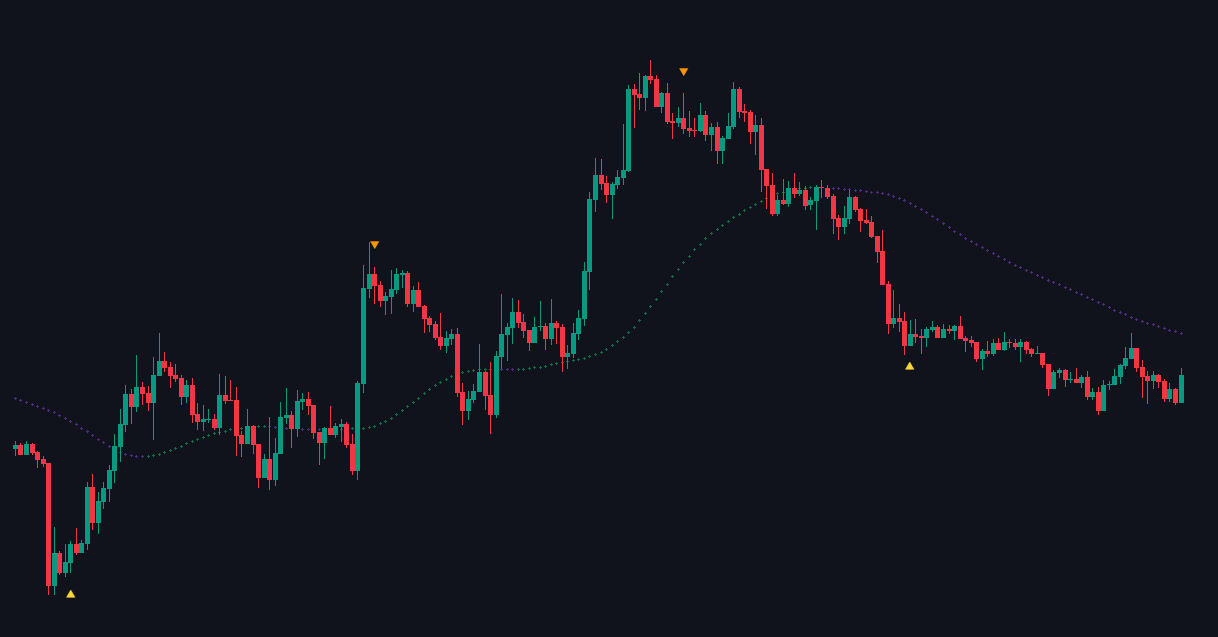
Settings

| Settings | Description |
|---|---|
| Toggle On/Off | Enable or disable the Voltix Bands layer on the chart. |
| Toggle Bands | Displays or hides the Bands on the chart. |
| Toggle Middle | Enables the dotted Voltix Midline mid line |
| Colors | Adjust bullish and bearish colors to match your preferred visual style |
