
 X
X Facebook
 Discord
 Instagram
 YouTube
 ChatGPT
MTF Highs and Lows
The MTF Highs & Lows feature plots multi-timeframe (MTF) high, low, and mid-range levels directly on your chart. It helps traders identify key price zones from previous daily, weekly, and monthly sessions.
These levels often act as support and resistance, providing valuable context for intraday and swing trading decisions.
Plots previous High, Low, and Mid-Range for:
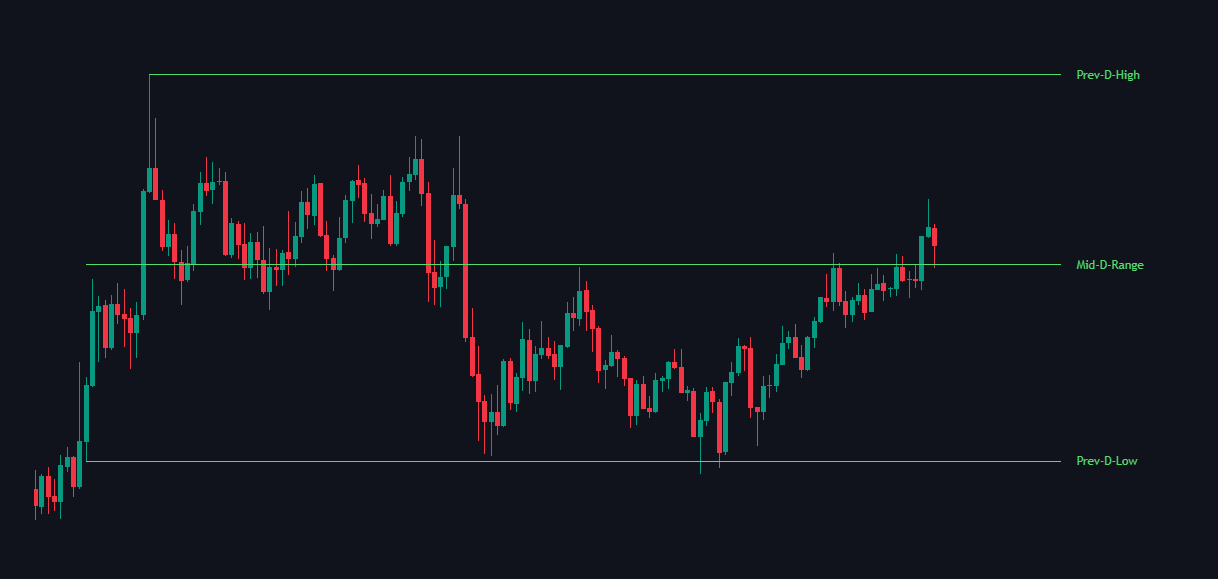
Day
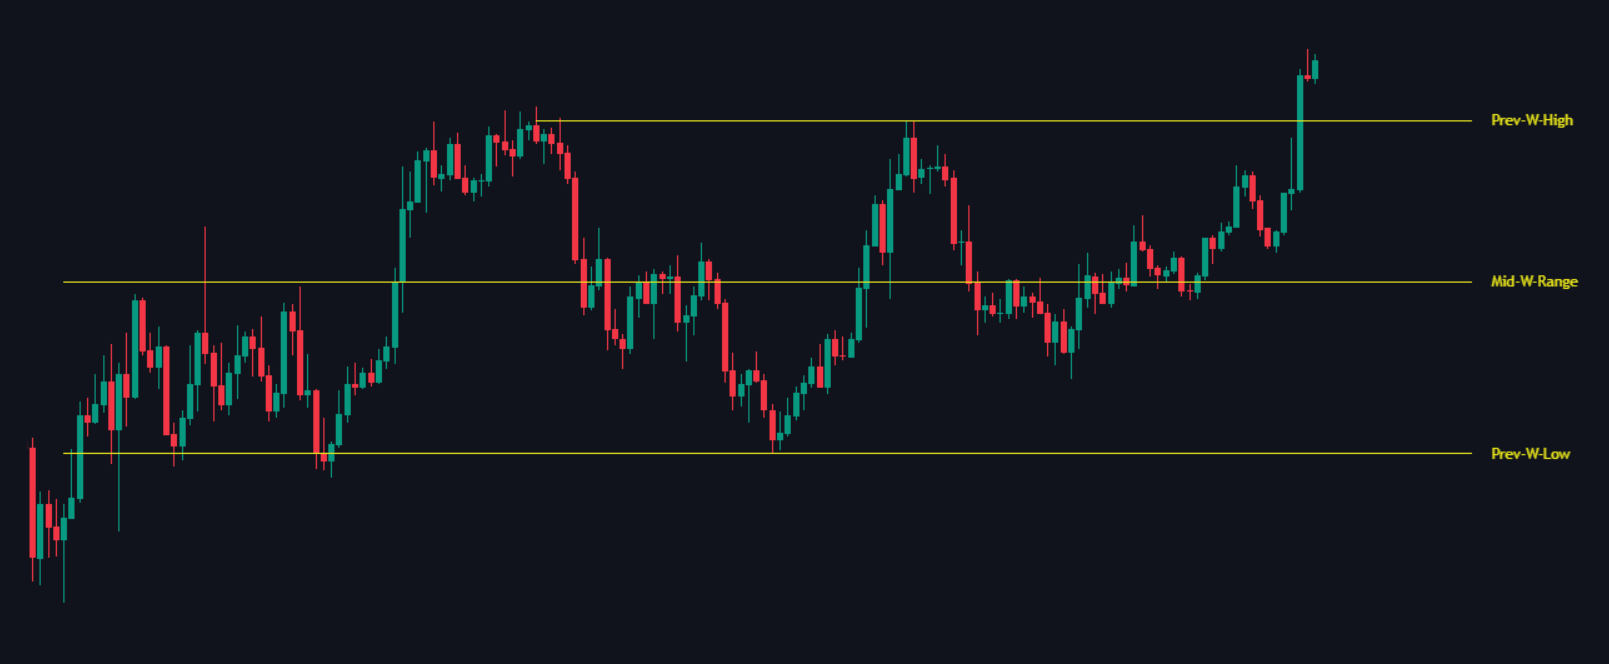
Week
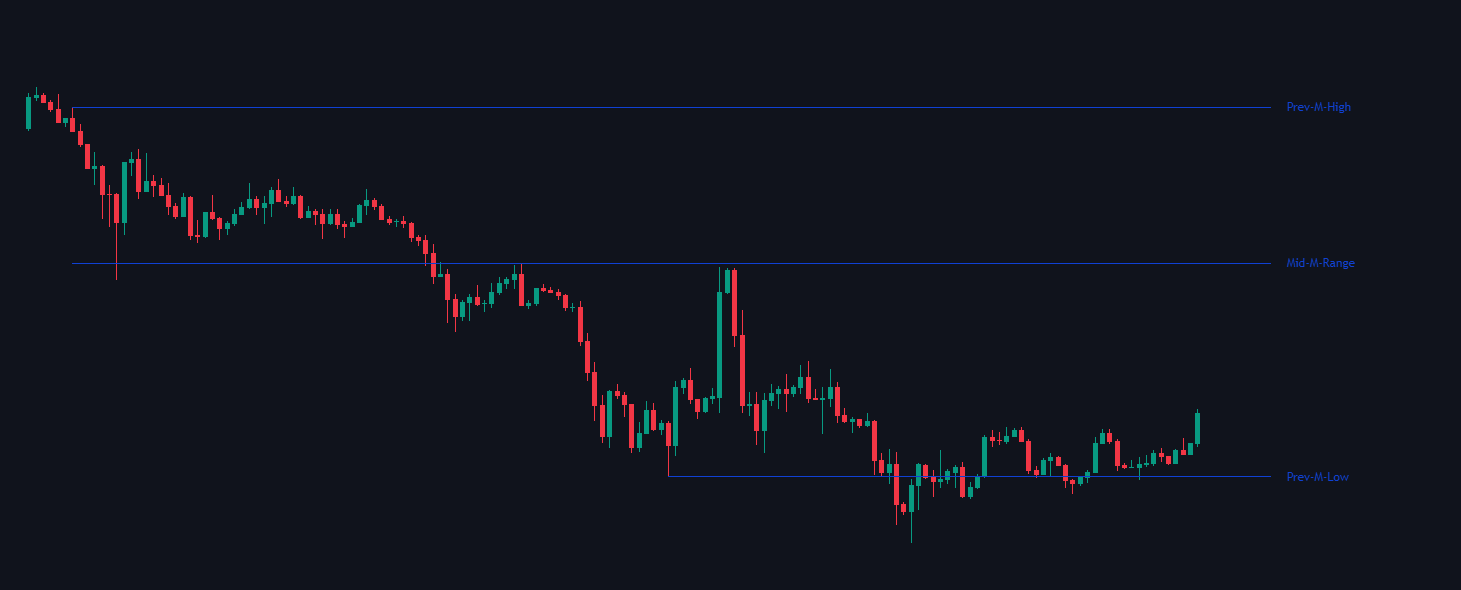
Month
Mid-Range is automatically calculated
Levels are extended across the chart for easy reference
How to use
Use the plotted levels to identify support, resistance, and liquidity zones
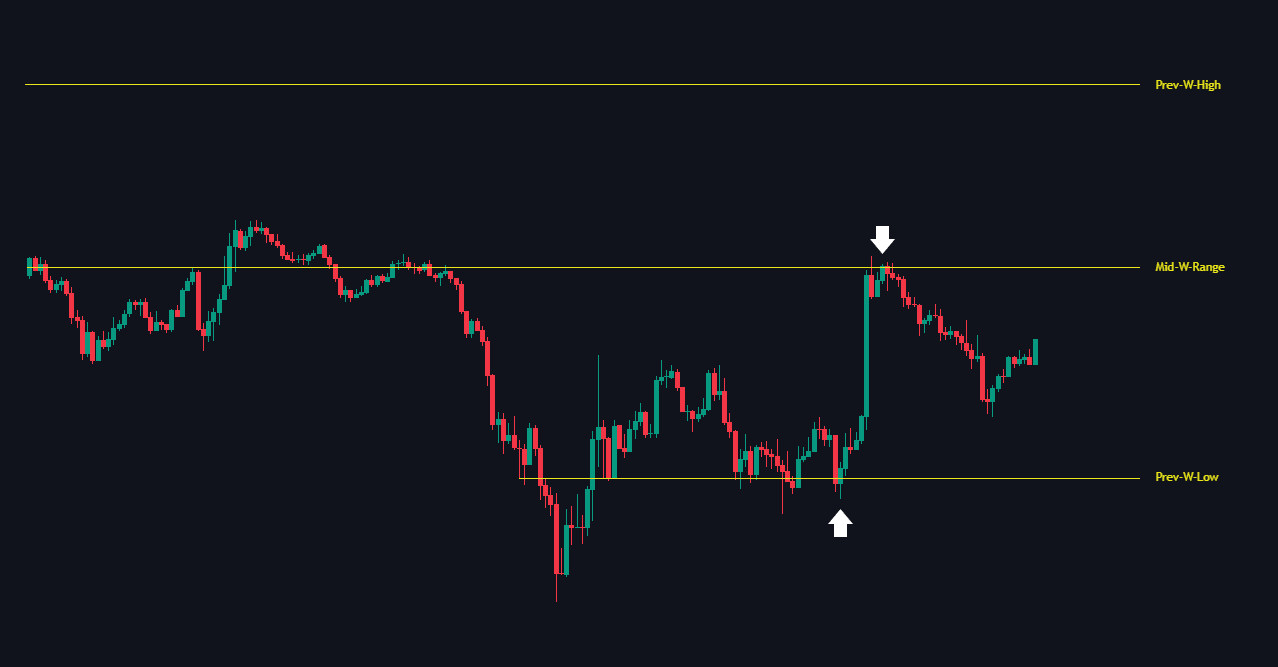
Support and Resistance
Watch for reactions when price touches or breaks these levels (e.g., rejections, breakouts)
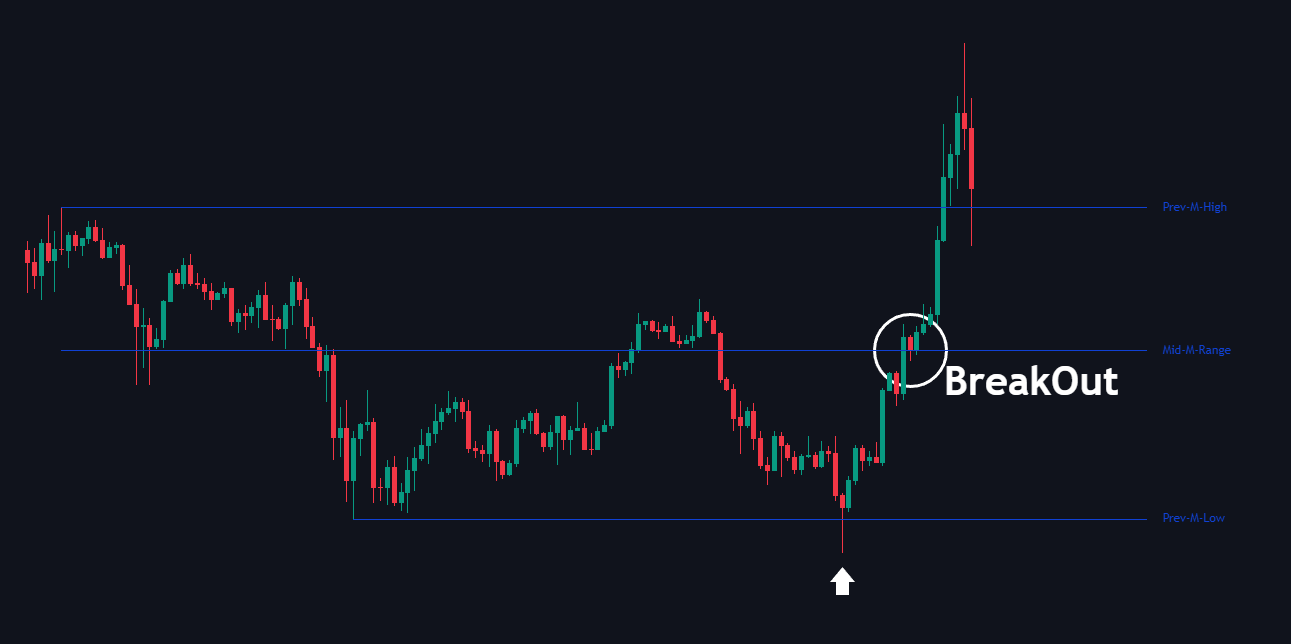
BreakOut
Mid-Range levels often act as balance points where price may consolidate or pivot
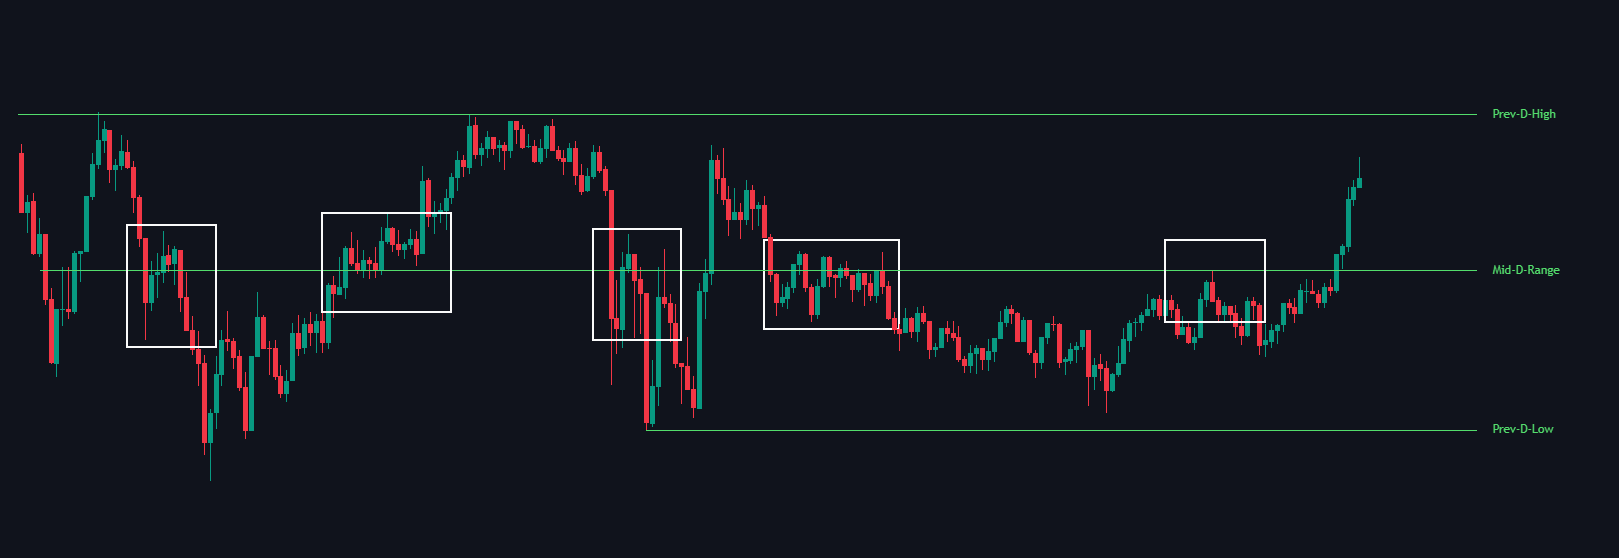
Mid-Range
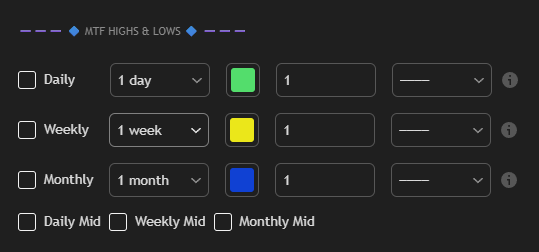
Toggle timeframes based on your trading style:
- Day: for intraday setups
- Week: for short-term swing levels
- Month: for broader market context
Look for confluence between levels from different timeframes to strengthen trade setups
Settings
| Setting | Description |
|---|---|
|
|
