
 X
X Facebook
 Discord
 Instagram
 YouTube
 ChatGPT
Market Dashboard
The dashboard provides a comprehensive view of market dynamics, assisting traders in assessing real-time conditions.
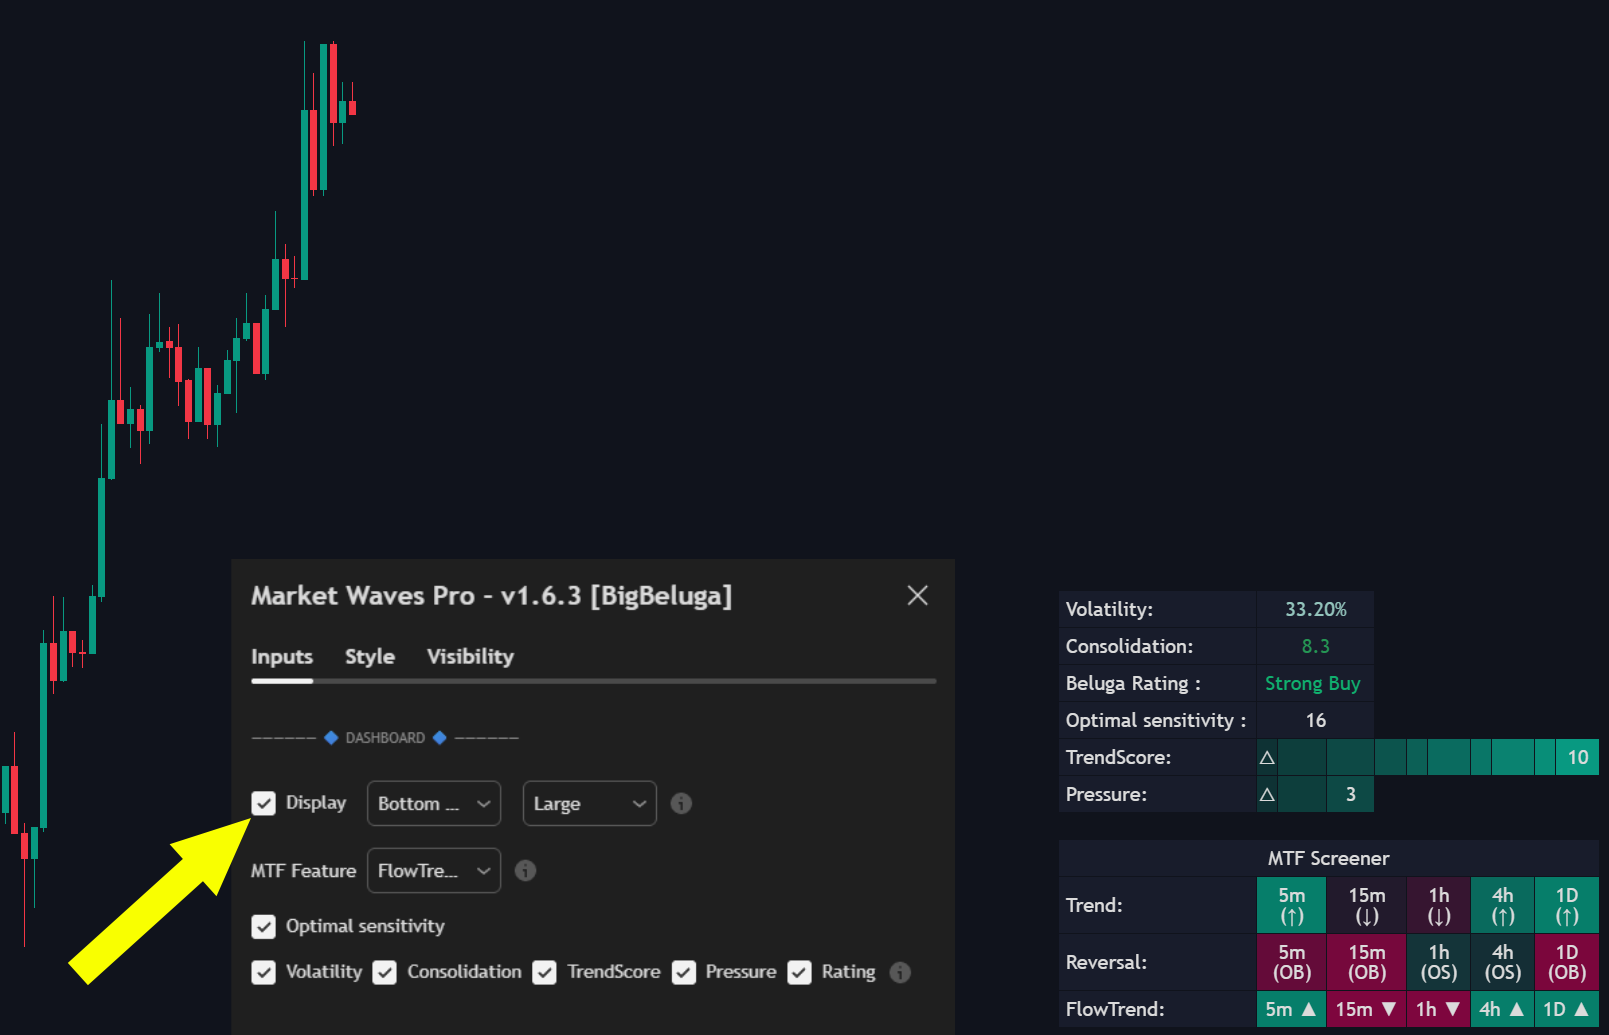
Each metric offers a precise quantification of key market characteristics, facilitating well-informed trading decisions.
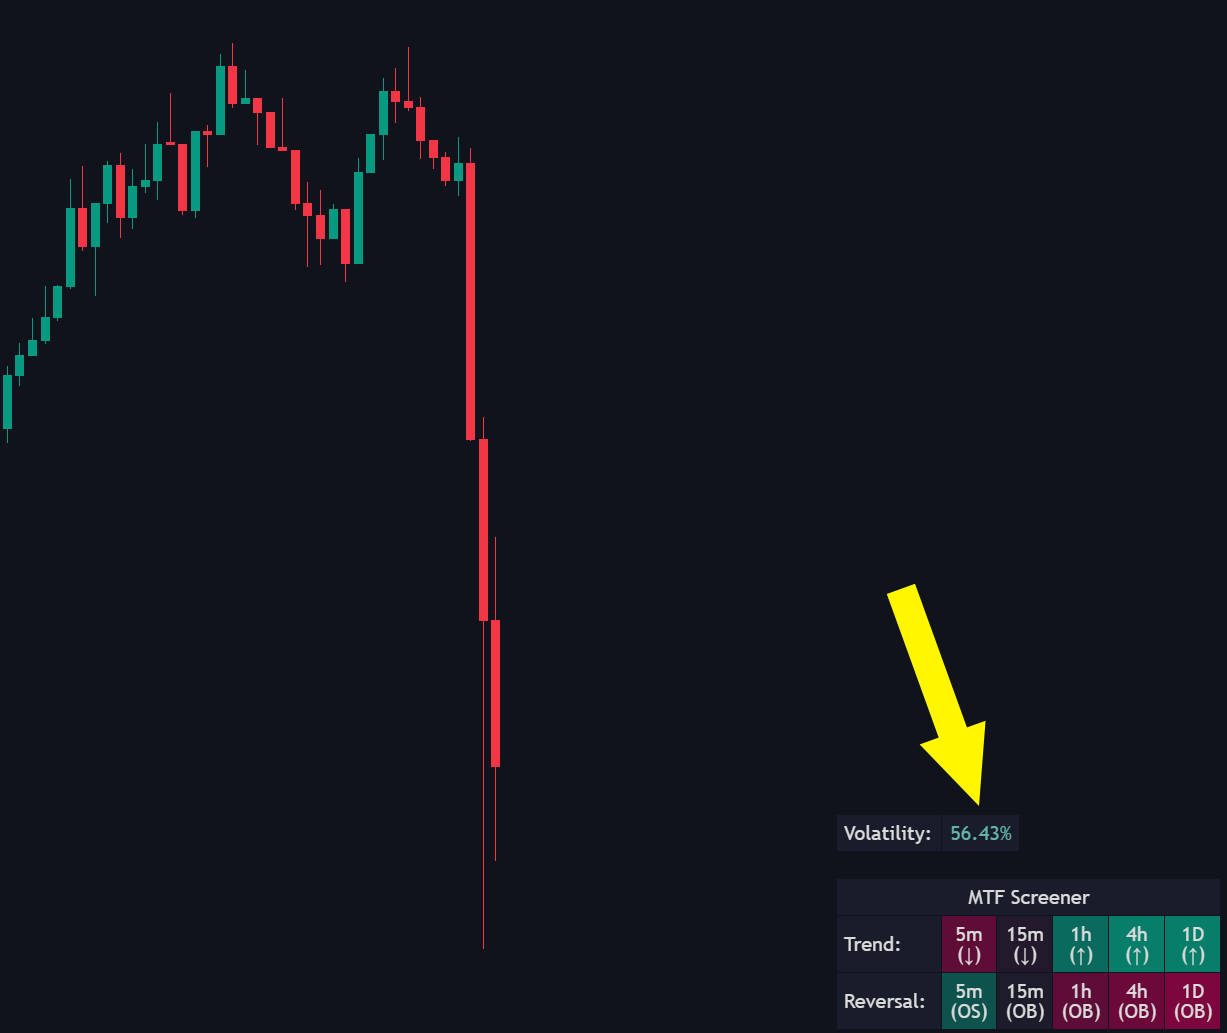
Volatility
Displays the percentage of current market volatility, ranging from 0% (calm) to 100% (extremely volatile), indicating the level of price activity.
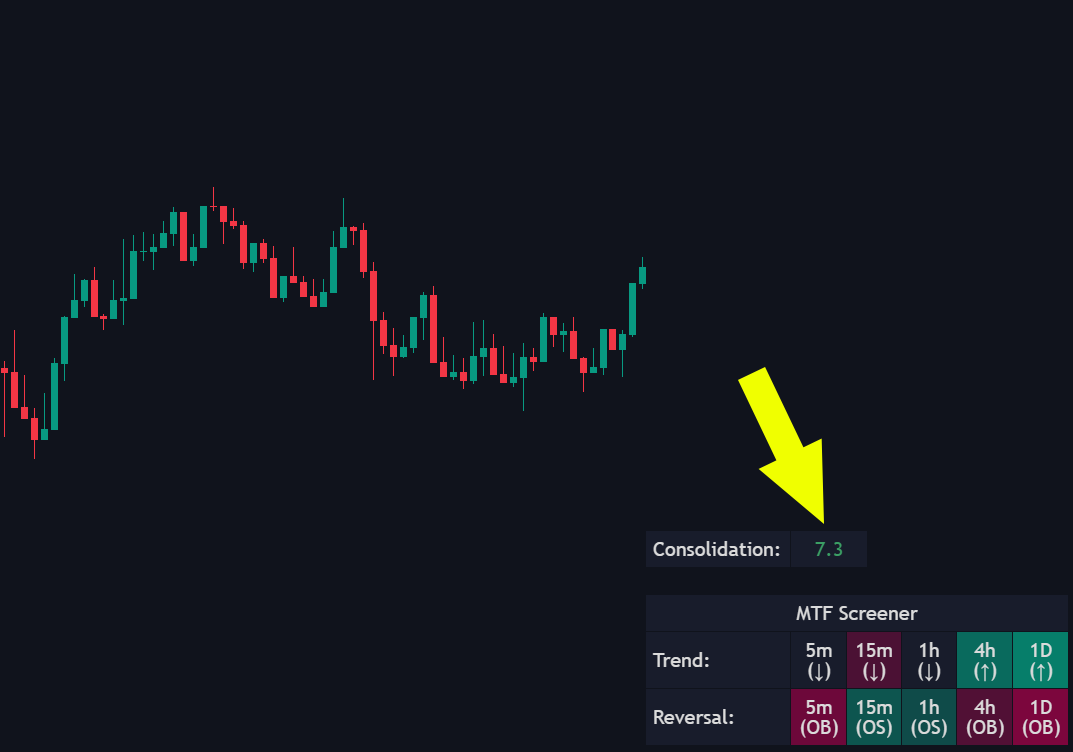
Consolidation
Quantifies the degree of price compression or range-bound movement on a scale of 0 to 10, where higher values signal tighter consolidation.
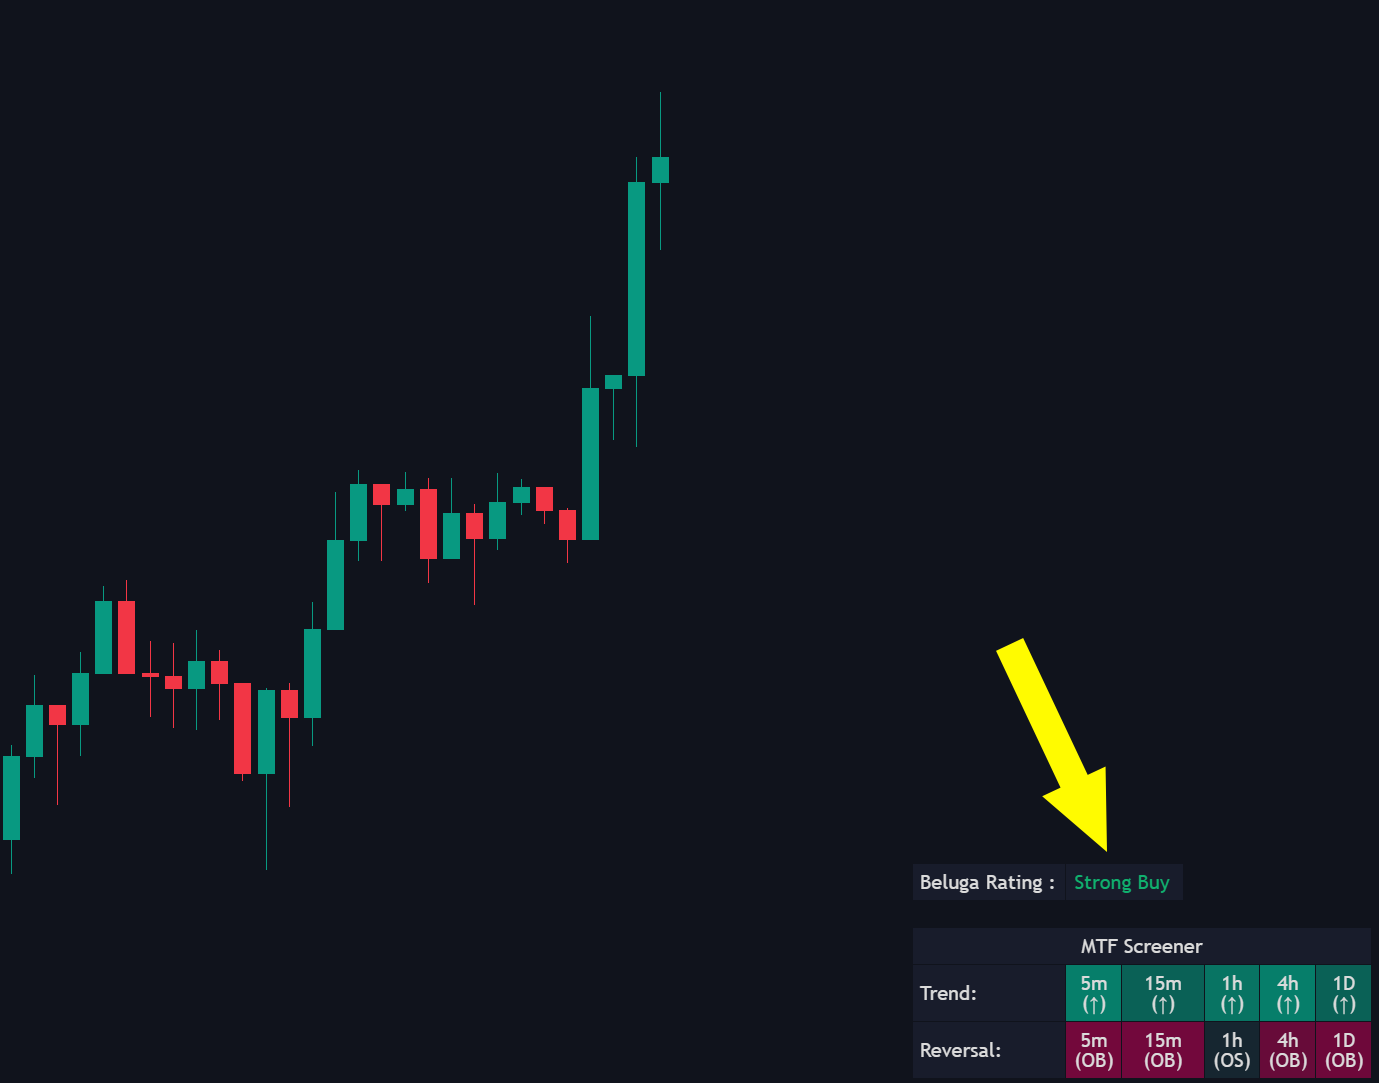
Beluga Rating
The BigBeluga Rating is a real-time technical sentiment tool that analyzes multiple built-in indicators to classify market bias into five intuitive states: Strong Buy, Buy, Neutral, Sell, and Strong Sell.
Optimal Sensitivity Display
The Optimal Sensitivity Display is a new feature added to the dashboard when Auto Optimization is enabled in Market Waves Pro.
It shows the exact sensitivity value that Auto Optimization has determined to be most effective based on recent market performance of Trend Signals feature.
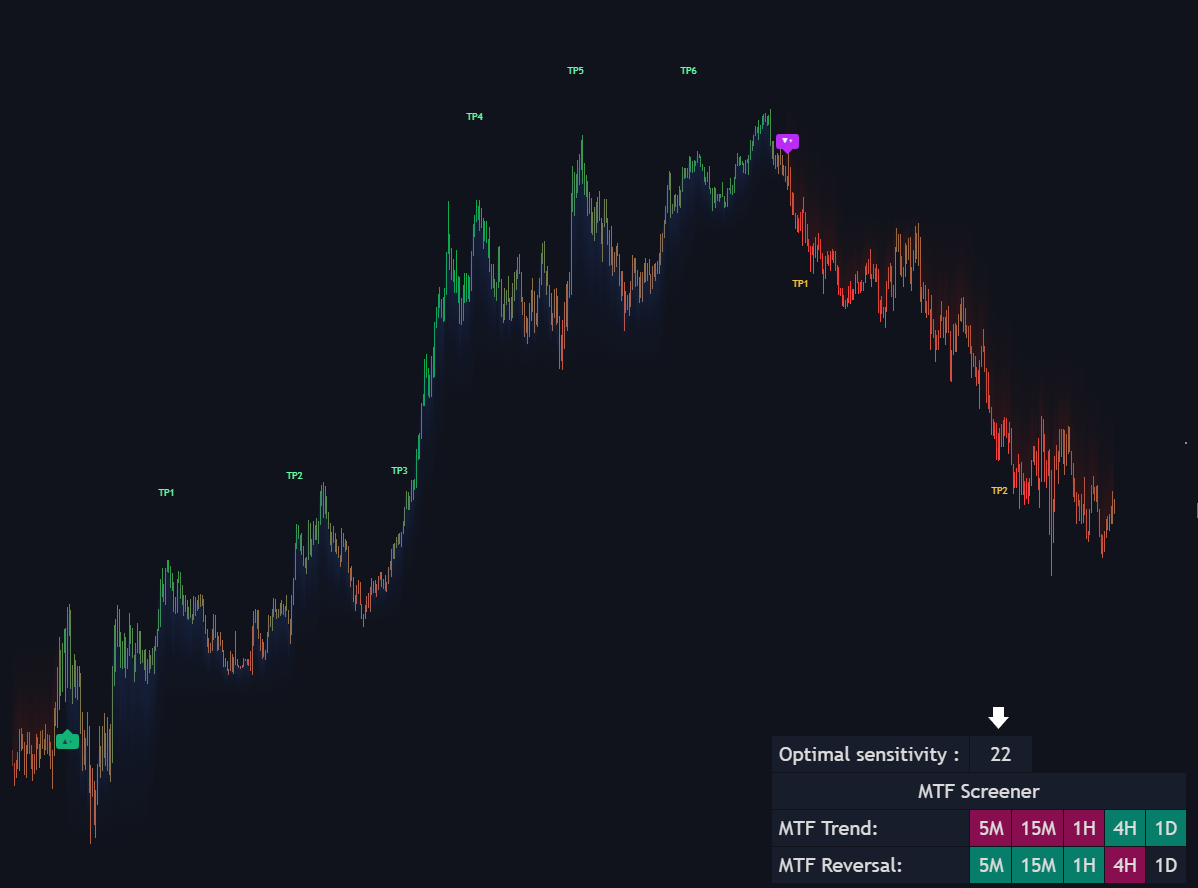
Trend Signals + DashBoard Optimal Sensitivity Input
Trend Score
Represents the strength of the current market trend, with values ranging from -10 (strong bearish trend) to +10 (strong bullish trend). A neutral or ranging market shows as a gray cell with a wave symbol.
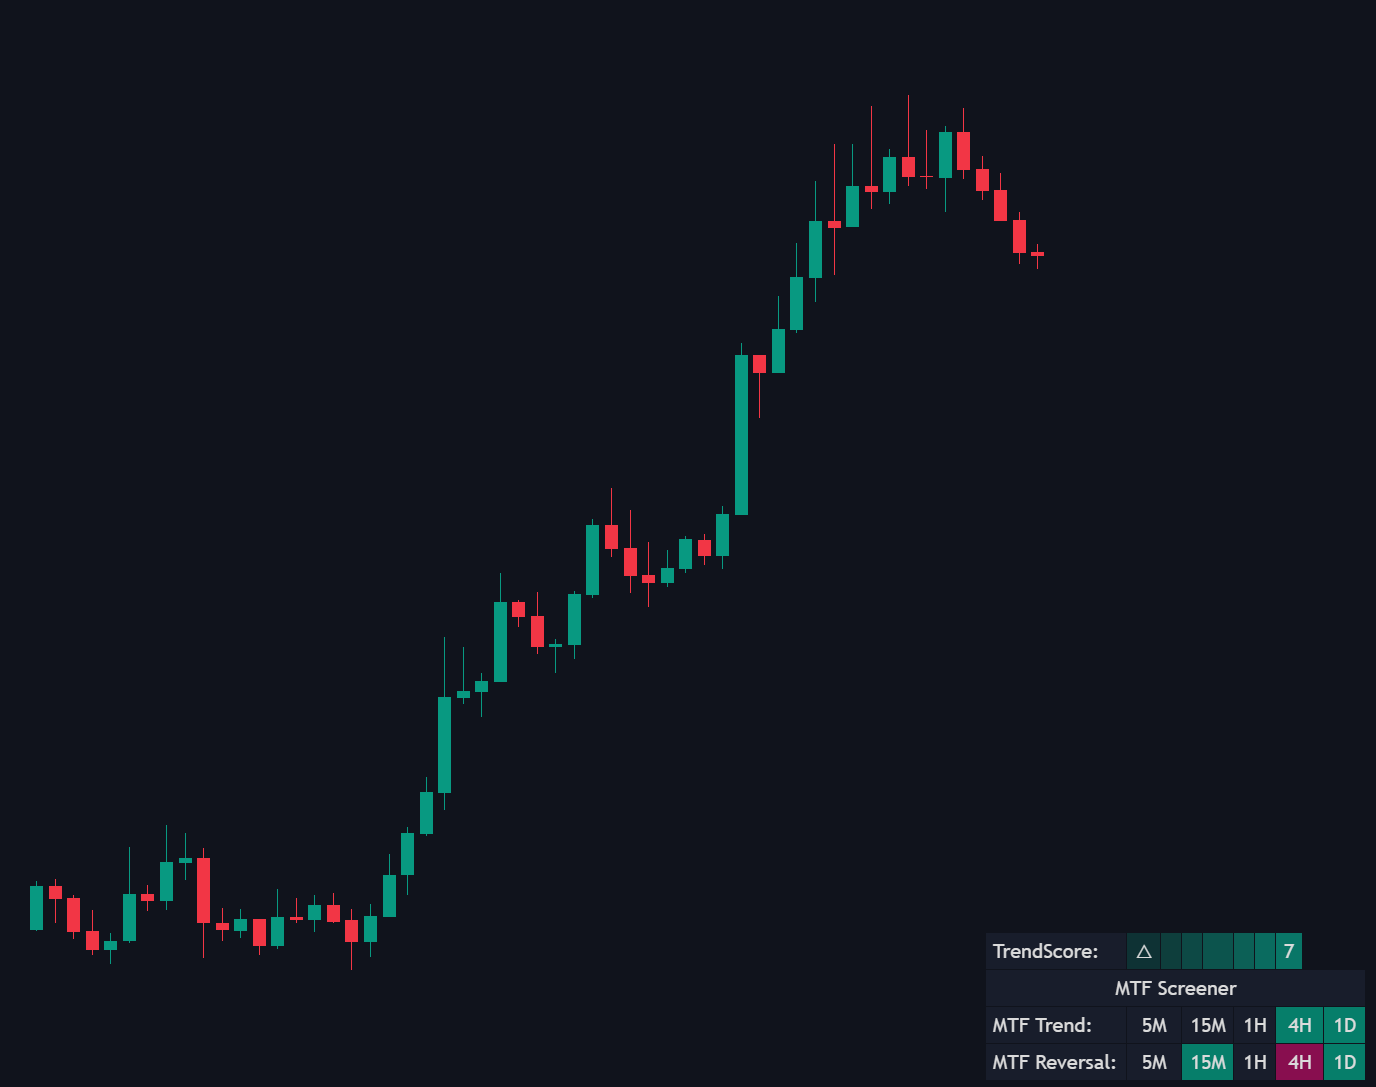
Trendscore Up Trend
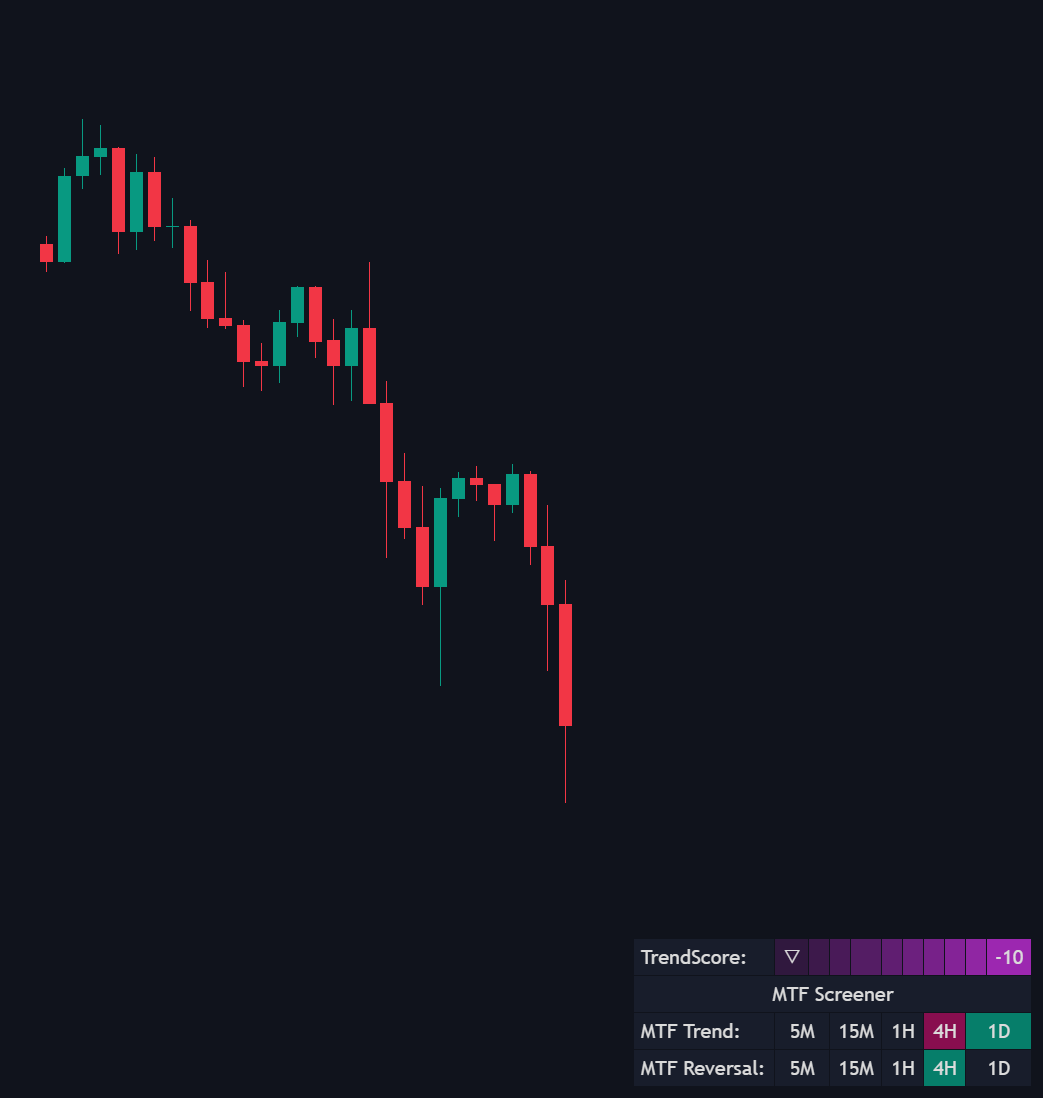
TrendScore Down Trend
Pressure
Volume Pressure calculates the net difference between aggressive buying and selling, but only during confirmed trending conditions.
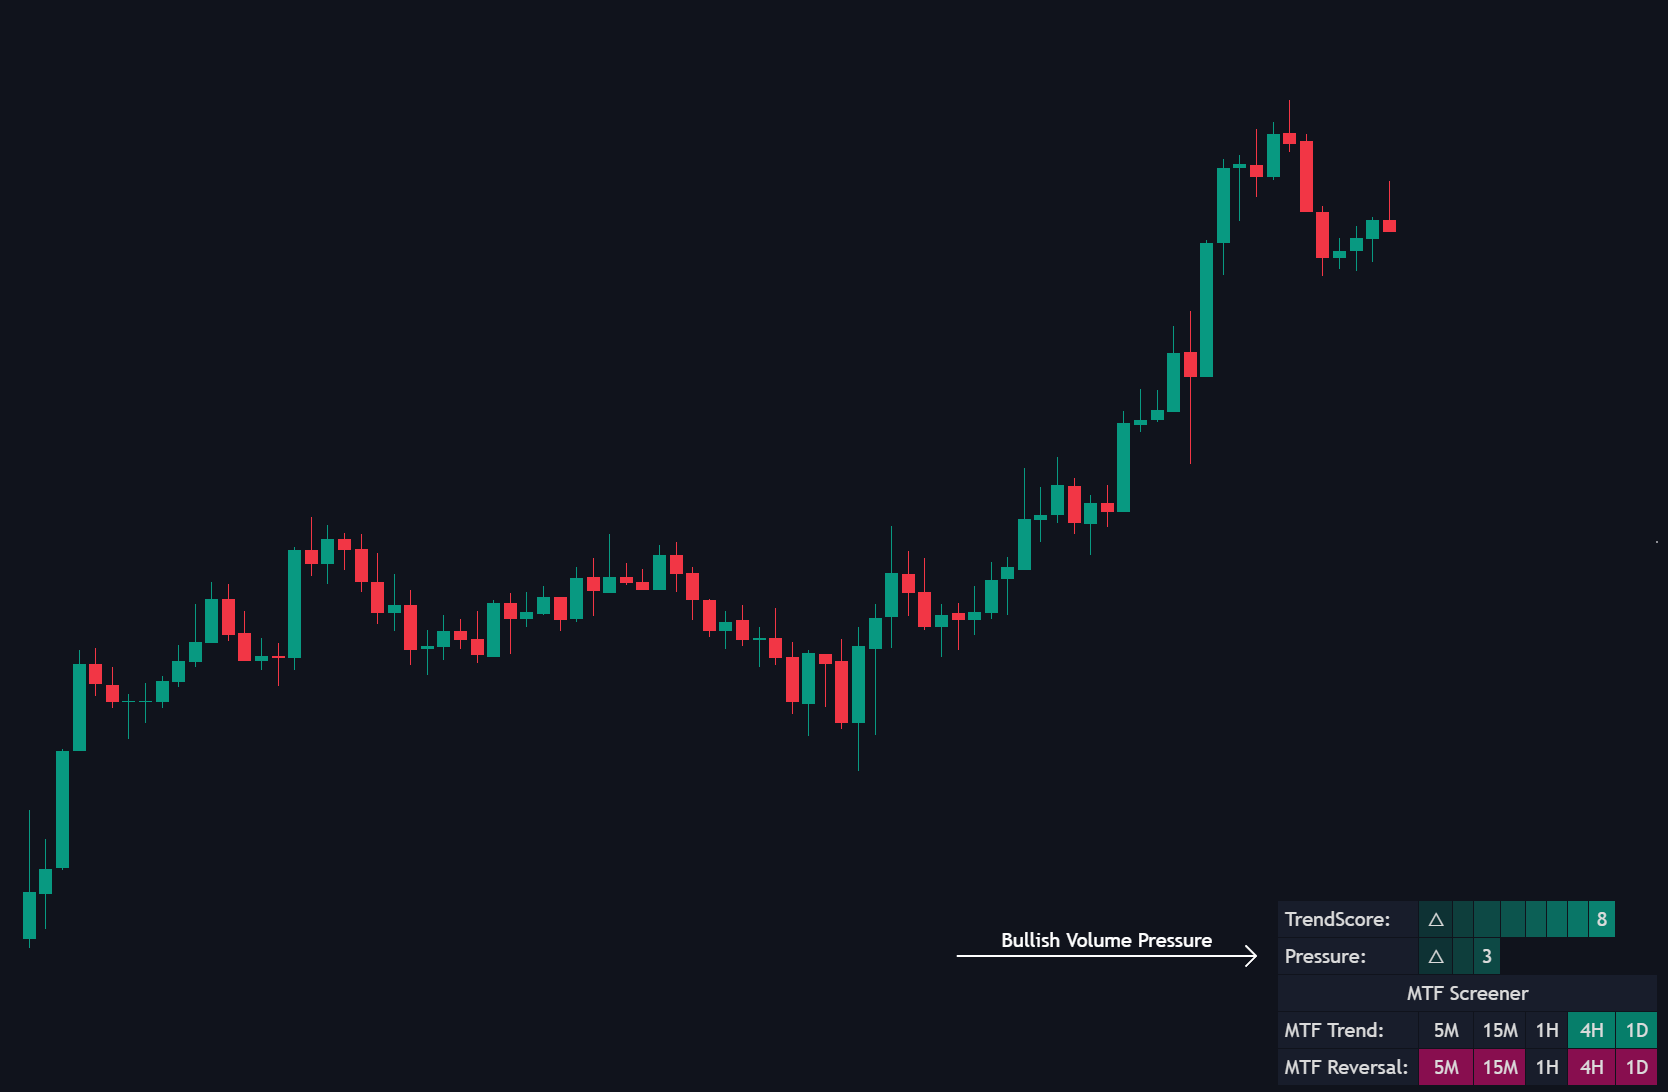
Bullish Pressure During Up Trend
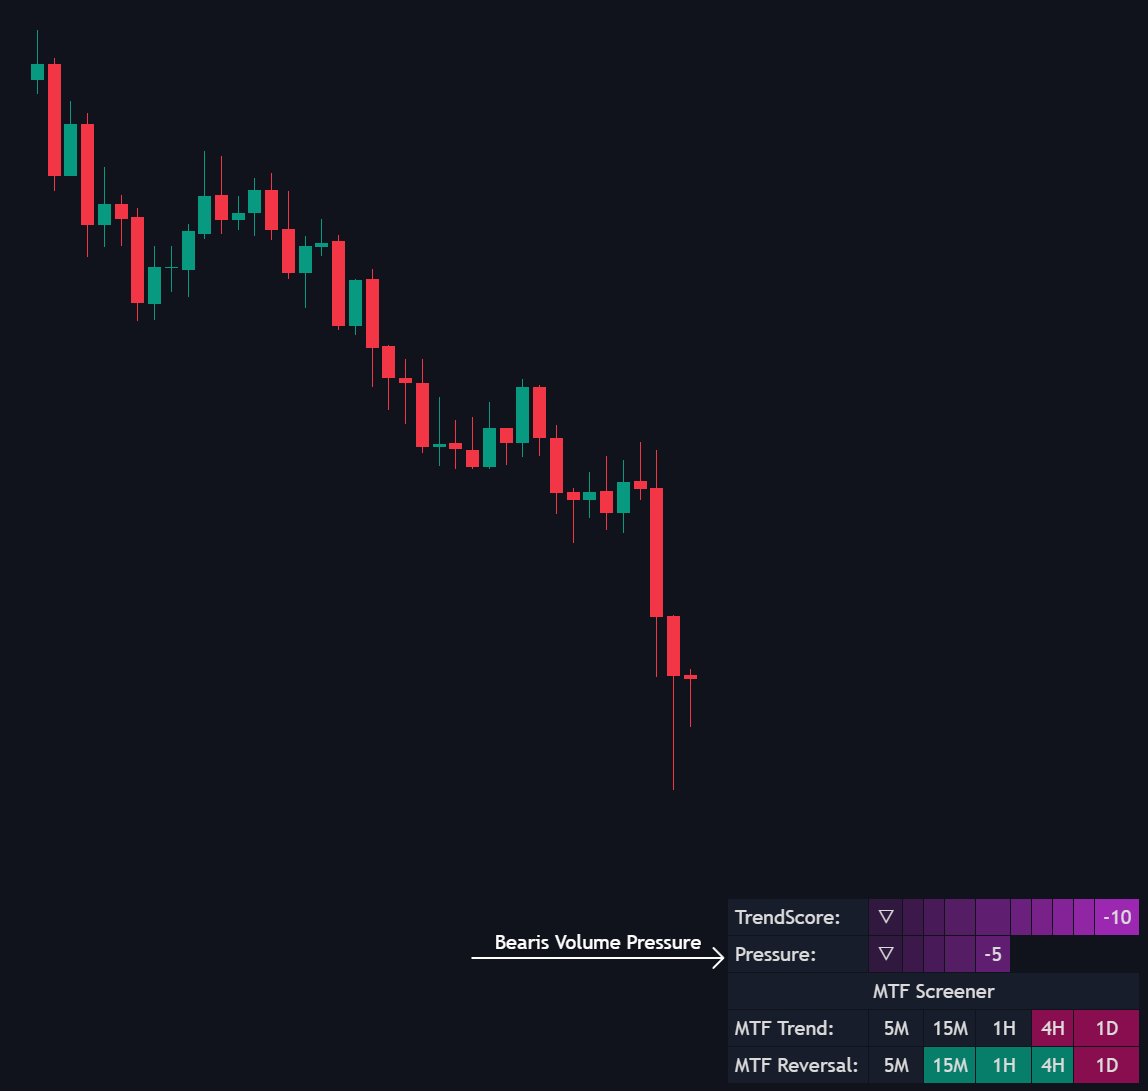
Bearish Pressure During Down Trend
Multi Timeframe Screener
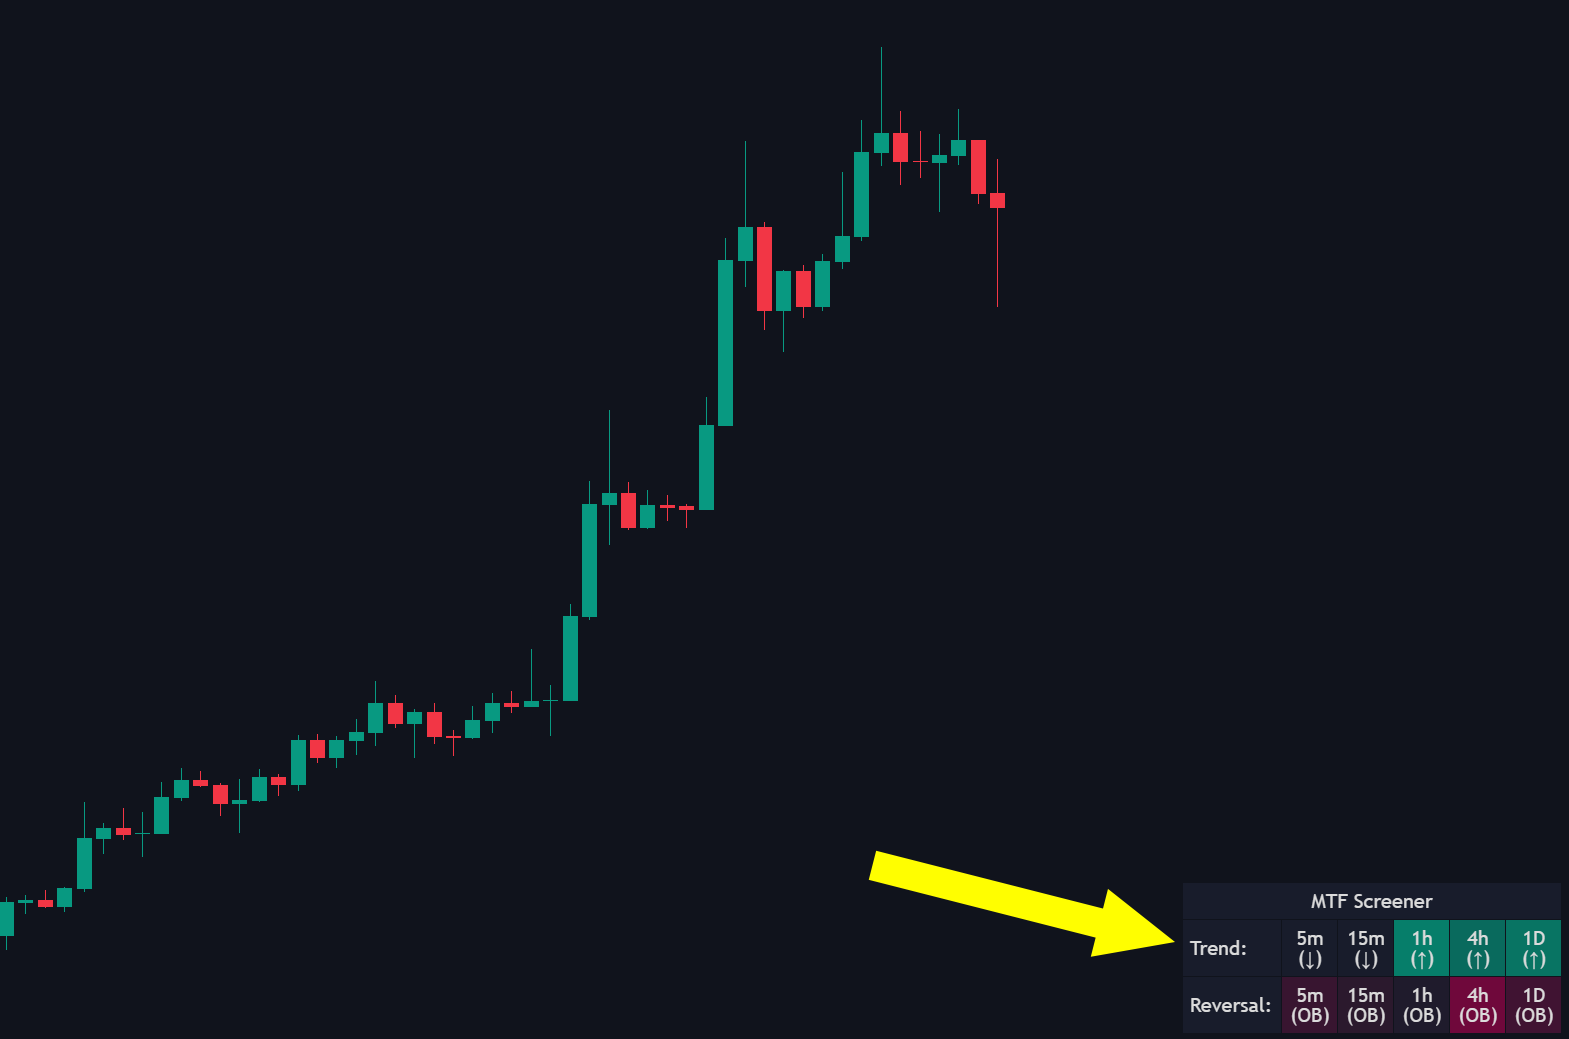
MTF Trend:
Monitors trend direction across multiple timeframes (e.g., 5M, 15M, 1H, 4H, 1D). Green indicates a bullish trend, red signifies bearishness.
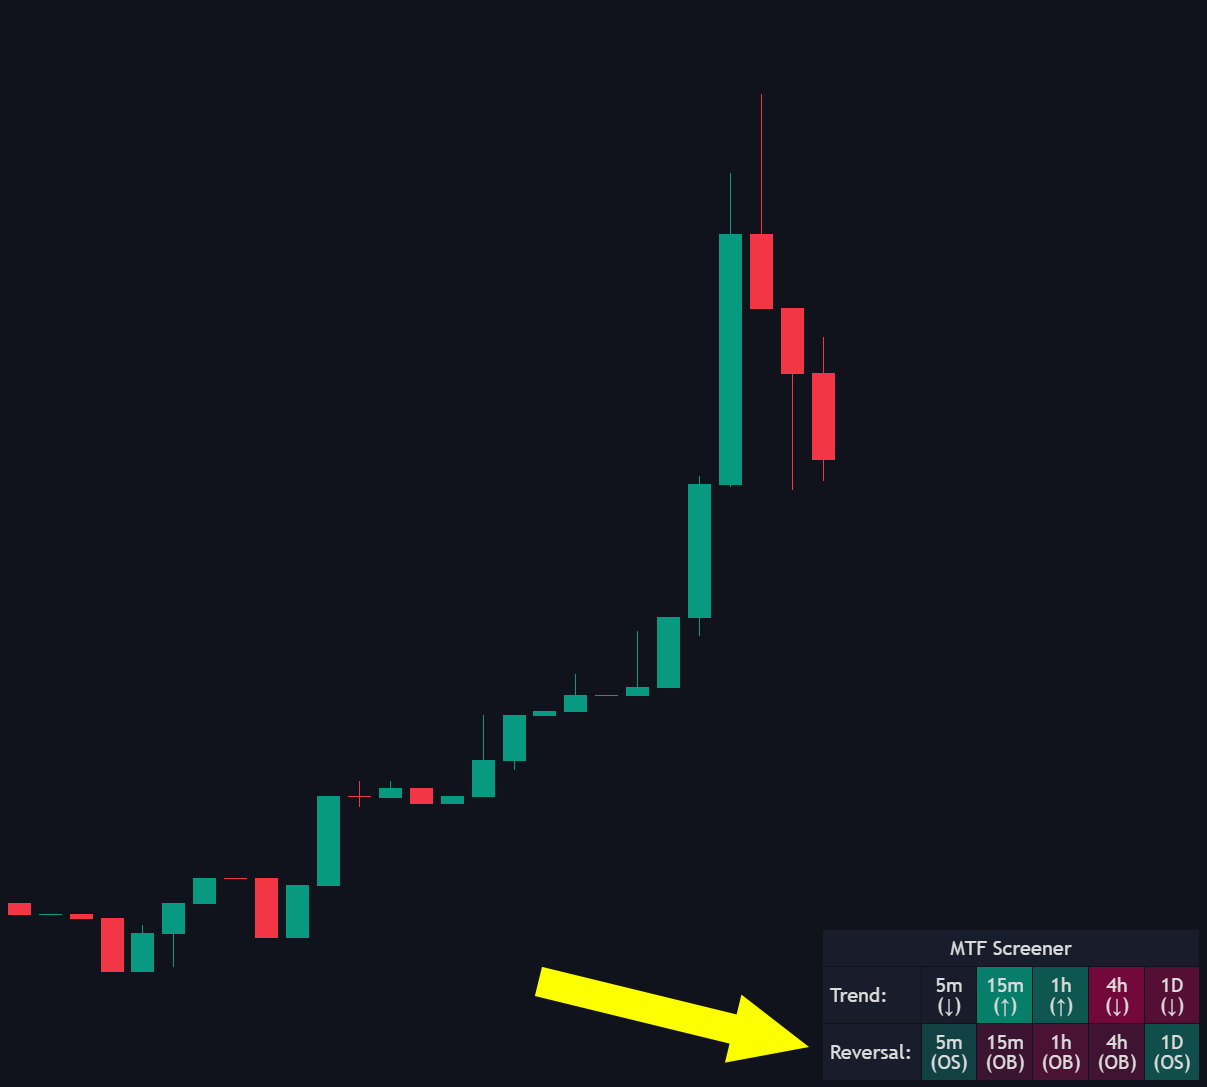
MTF Reversal:
Detects potential market reversals across timeframes. Green cells indicate upward reversal potential, while red cells point to downward reversal likelihood.
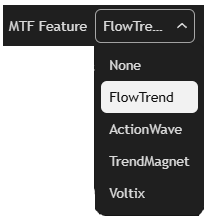
MTF Feature Selection
The MTF Feature dropdown allows you to customize the bottom row of your Multi-Timeframe Screener by selecting a specific toolkit component to track.
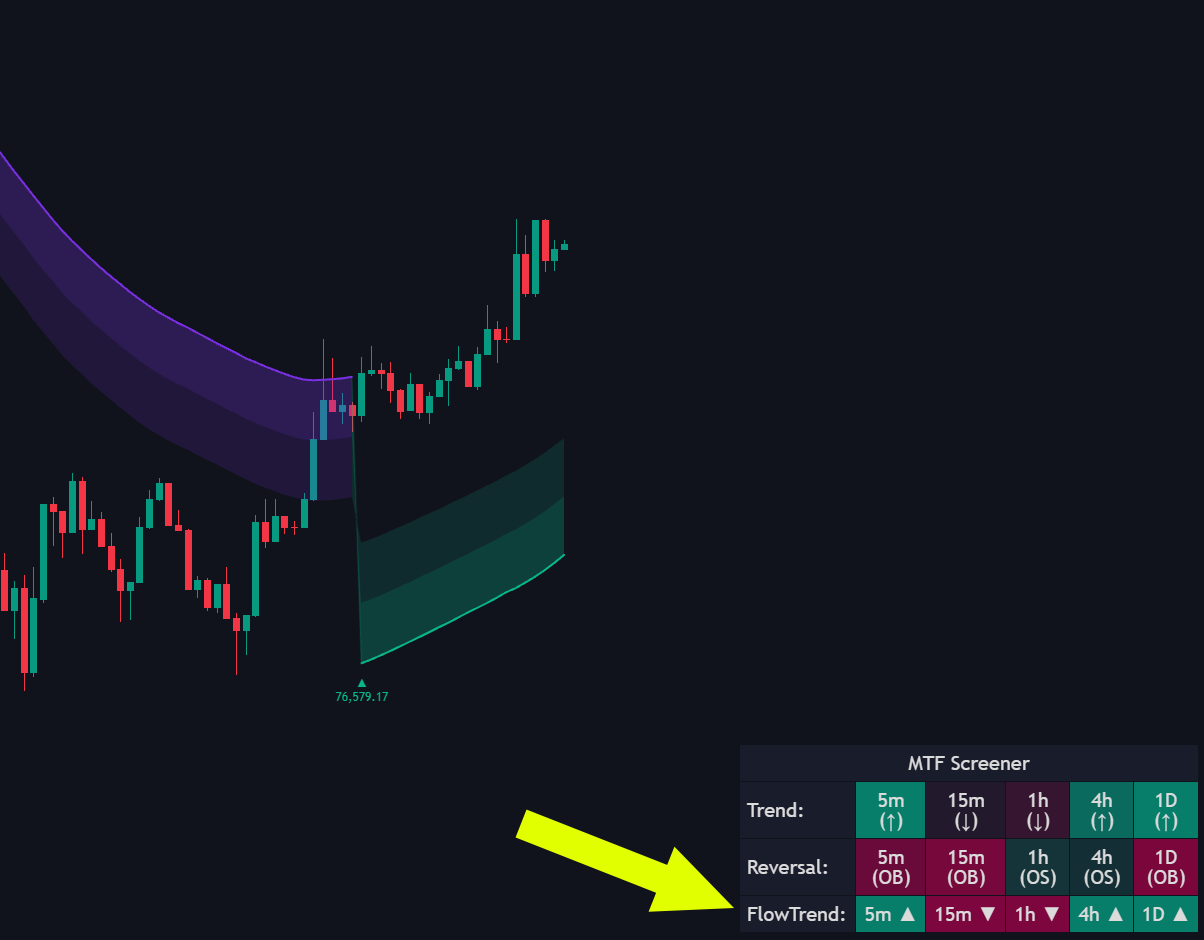
Customizable Logic: Choose between FlowTrend, ActionWave, TrendMagnet, or Voltix to monitor their real-time status across all timeframes.
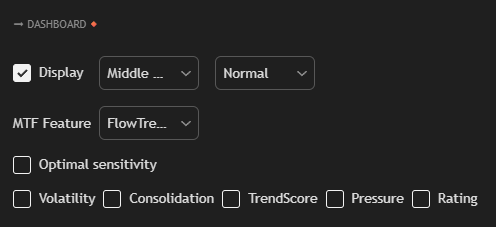
Settings
| Setting | Description |
|---|---|
| Display | A master toggle to show or hide the dashboard on your chart. Includes position (e.g., Middle Right) and size (Small, Normal, Large) dropdowns. |
| MTF Features | A dropdown menu that allows you to select a specific toolkit feature—such as FlowTrend, ActionWave, TrendMagnet, or Voltix—to be displayed as a dedicated row in the MTF Screener. |
| Optimal Sensitivity | Shows the exact sensitivity value that Auto Optimization has determined to be most effective based on recent market performance. |
| Volatility | Helps traders identify whether the market is active enough to execute momentum strategies or quiet enough for range-bound approaches. |
| Consolidation | Assists in spotting periods of low volatility that often precede significant price breakouts, enabling proactive strategy adjustments. |
| Trend Score | Guides directional trades. High positive values suggest buying opportunities, while negative values favor selling. |
| Pressure | Provides insights into the strength of buyer or seller dominance within a trend. |
| Rating | (BigBeluga Rating) Quickly aligns traders with market sentiment using Strong Buy, Buy, Neutral, Sell, or Strong Sell ratings. |
