
 X
X Facebook
 Discord
 Instagram
 YouTube
 ChatGPT
Liquidity Concepts
Liquidity Concepts identify key zones where price grabs or flows toward liquidity.
Liquidity Grab
This Liquidity Grab Indicator highlights areas where price briefly moves in one direction to "grab" liquidity before reversing.
When a liquidity grab occurs through a large candle’s wick:
Upward Liquidity Grab (Trend Continuation)
An upward liquidity grab occurs when the price forms a large upper wick, signaling the market's attempt to break higher but quickly retracting before continuing to rise.
This pattern usually indicates a situation where short traders are liquidated as the price breaks above the previous high, forcing a continuation of the bullish trend.
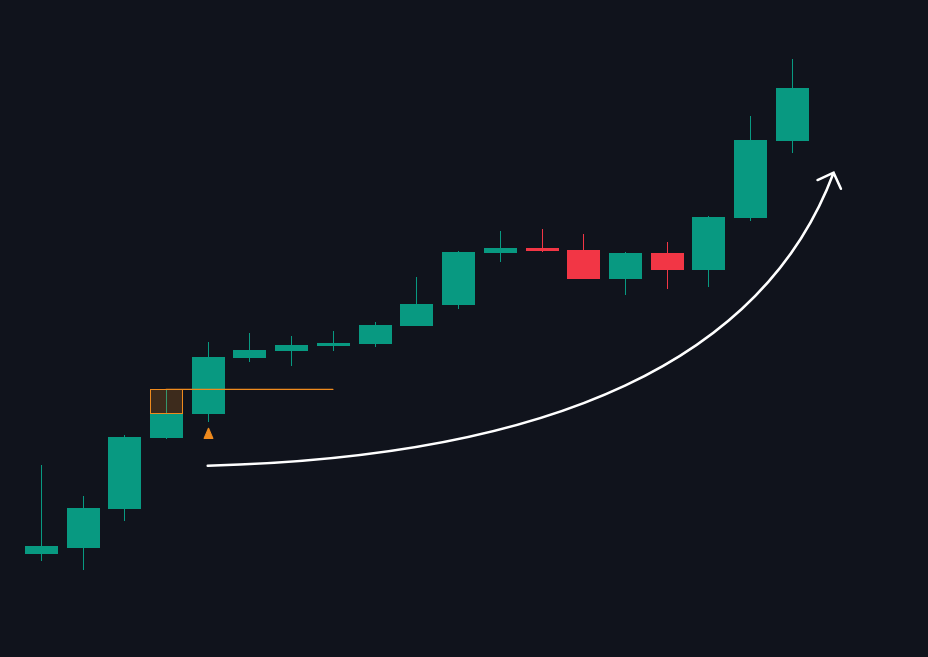
Upward liquidity grab
Downward Liquidity Grab (Trend Continuation)
A downward liquidity grab happens when the price forms a large lower wick, briefly moving lower before reversing and continuing the downtrend.
This pattern represents the liquidity absorption where long traders are forced out of their positions, confirming the continuation of a bearish trend.
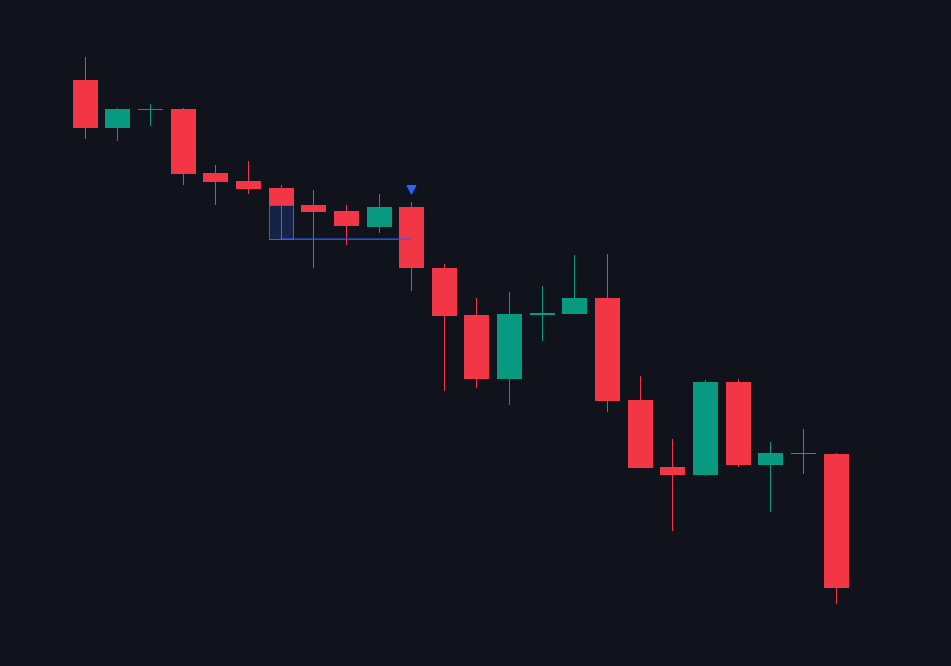
A downward liquidity grab
Reversal and Liquidity Zones
Large wicks, especially those at reversal points, can indicate areas of high liquidity where significant buy or sell pressure is present.
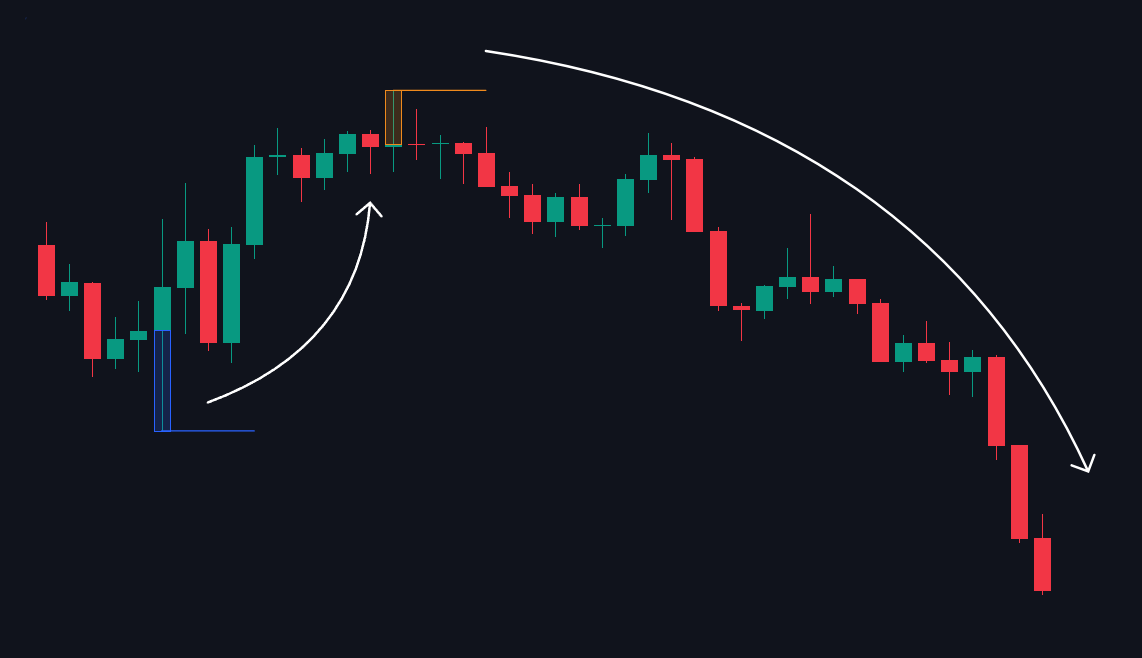
Reversal points
Buy & Sellside
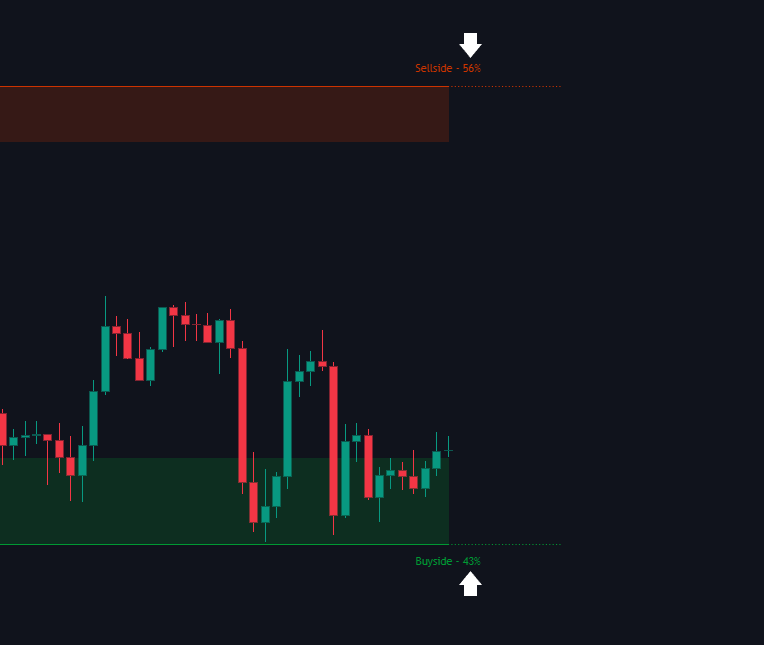
The Buyside & Sellside feature introduces a clear visualization of recent support and resistance levels on the chart, accompanied by a percentage indicator showing the strength of each side.
- Buyside Levels: Represent areas of strong buyer interest (support zones), highlighted in green, showing where price may find a floor.
- Sellside Levels: Highlight areas of significant seller pressure (resistance zones), shown in red, indicating potential price ceilings.
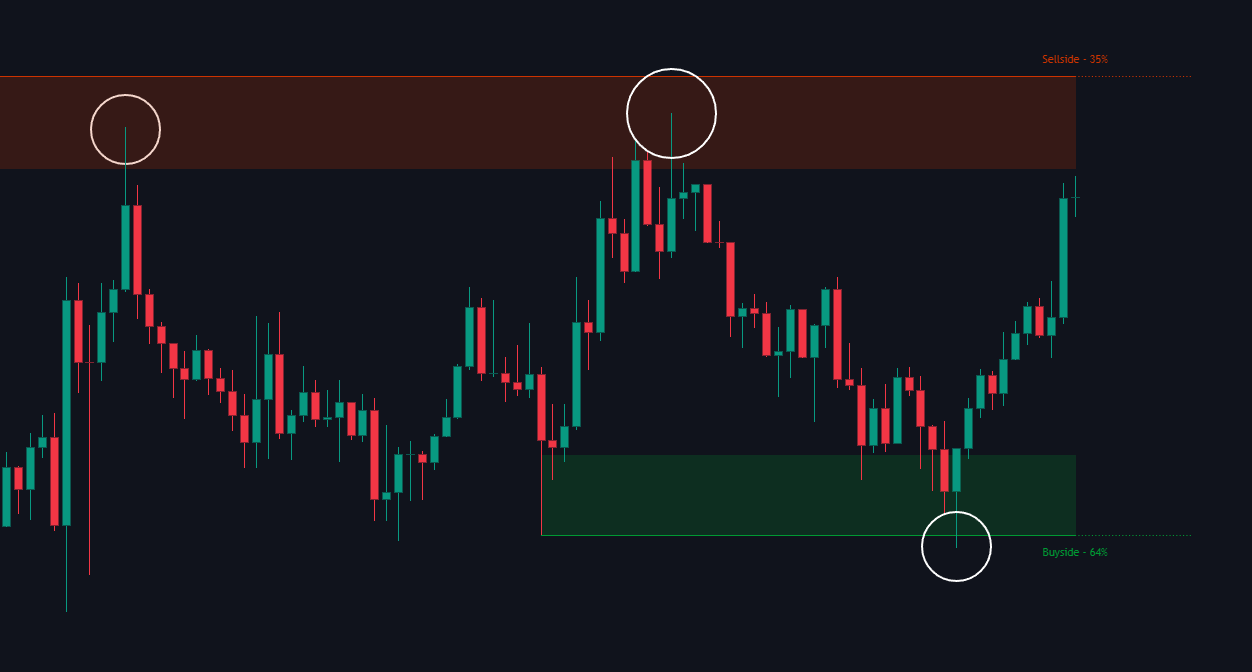
Each zone includes a percentage metric to quantify the relative strength of buyers or sellers in that region, aiding decision-making.
Dynamic Liquidity Map
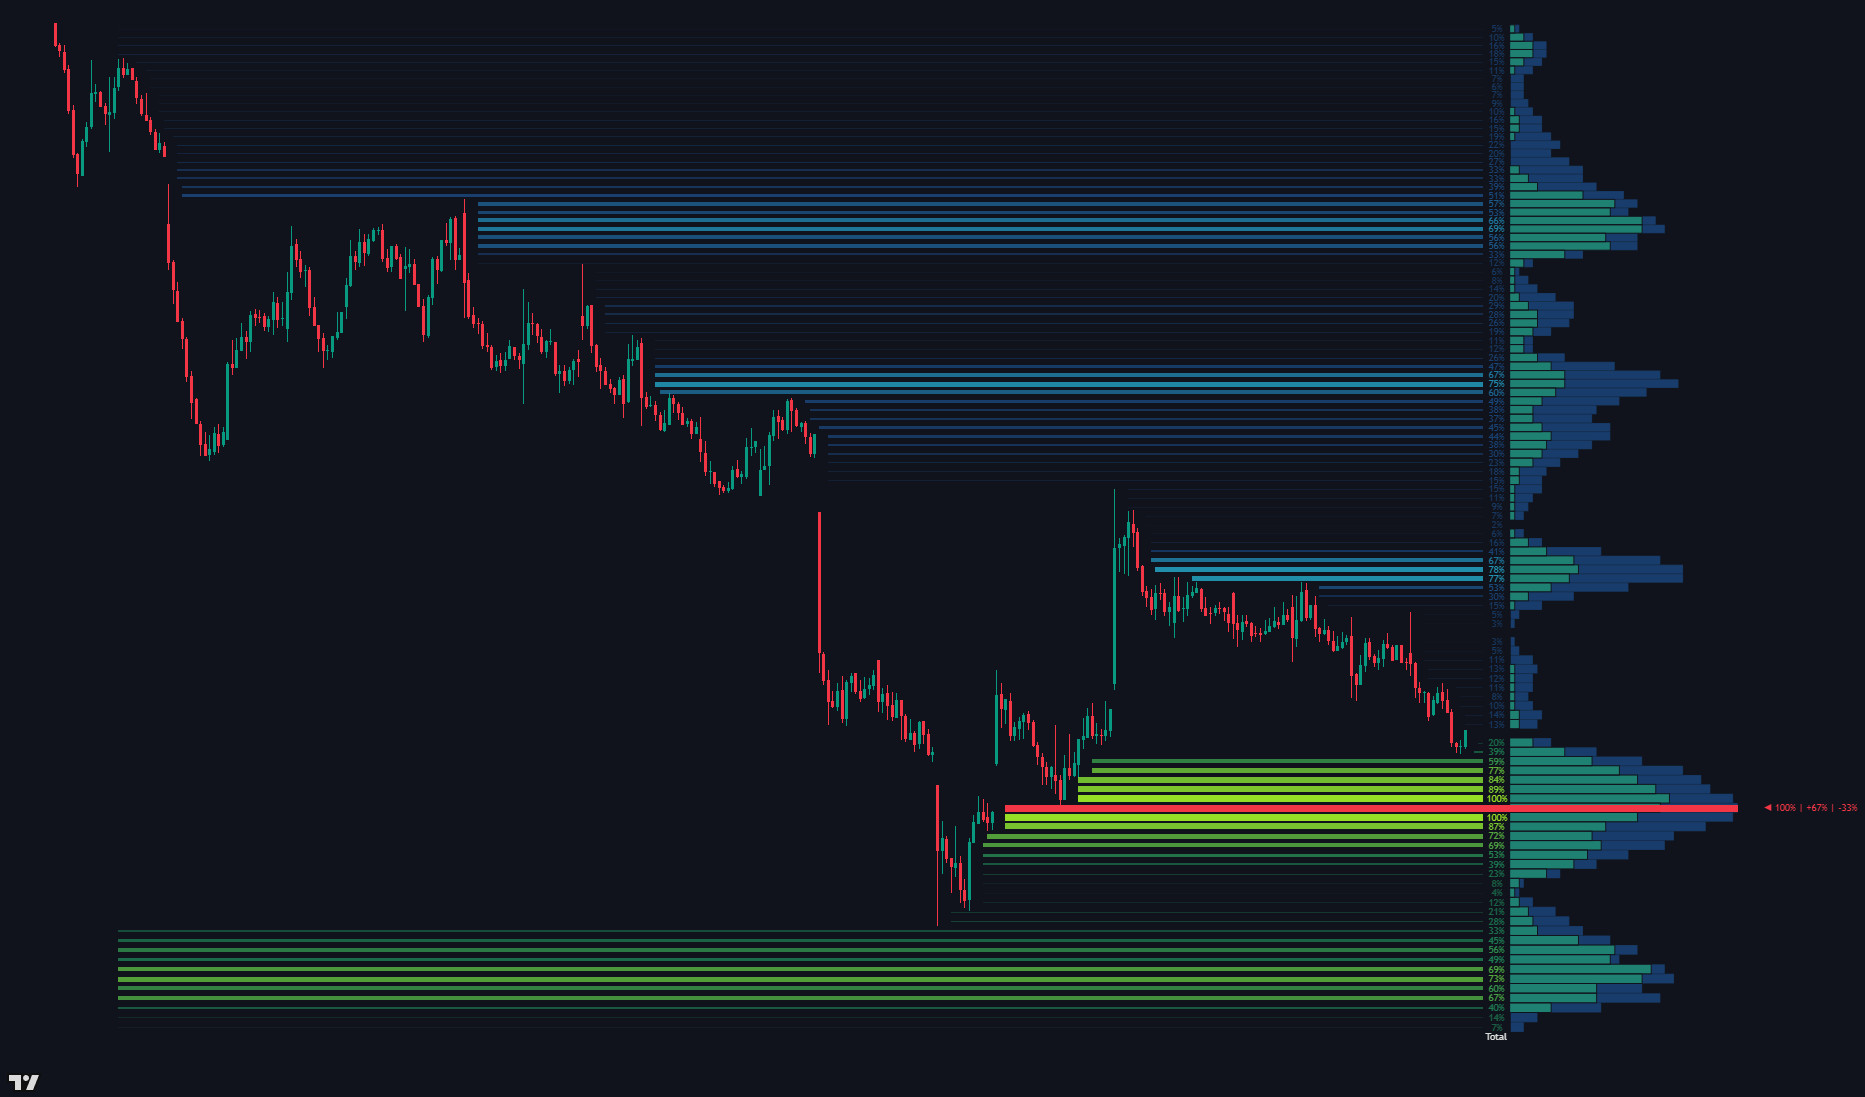
The Dynamic Liquidity Map is a sophisticated tool designed to identify where significant buy and sell orders are likely clustered. By analyzing historical price action and volume distribution, it highlights "areas of interest" that have not yet been mitigated by current price action.
Liquidity HeatMap
The heatmap projects horizontal lines from historical reversal points. These lines represent potential liquidity pools.
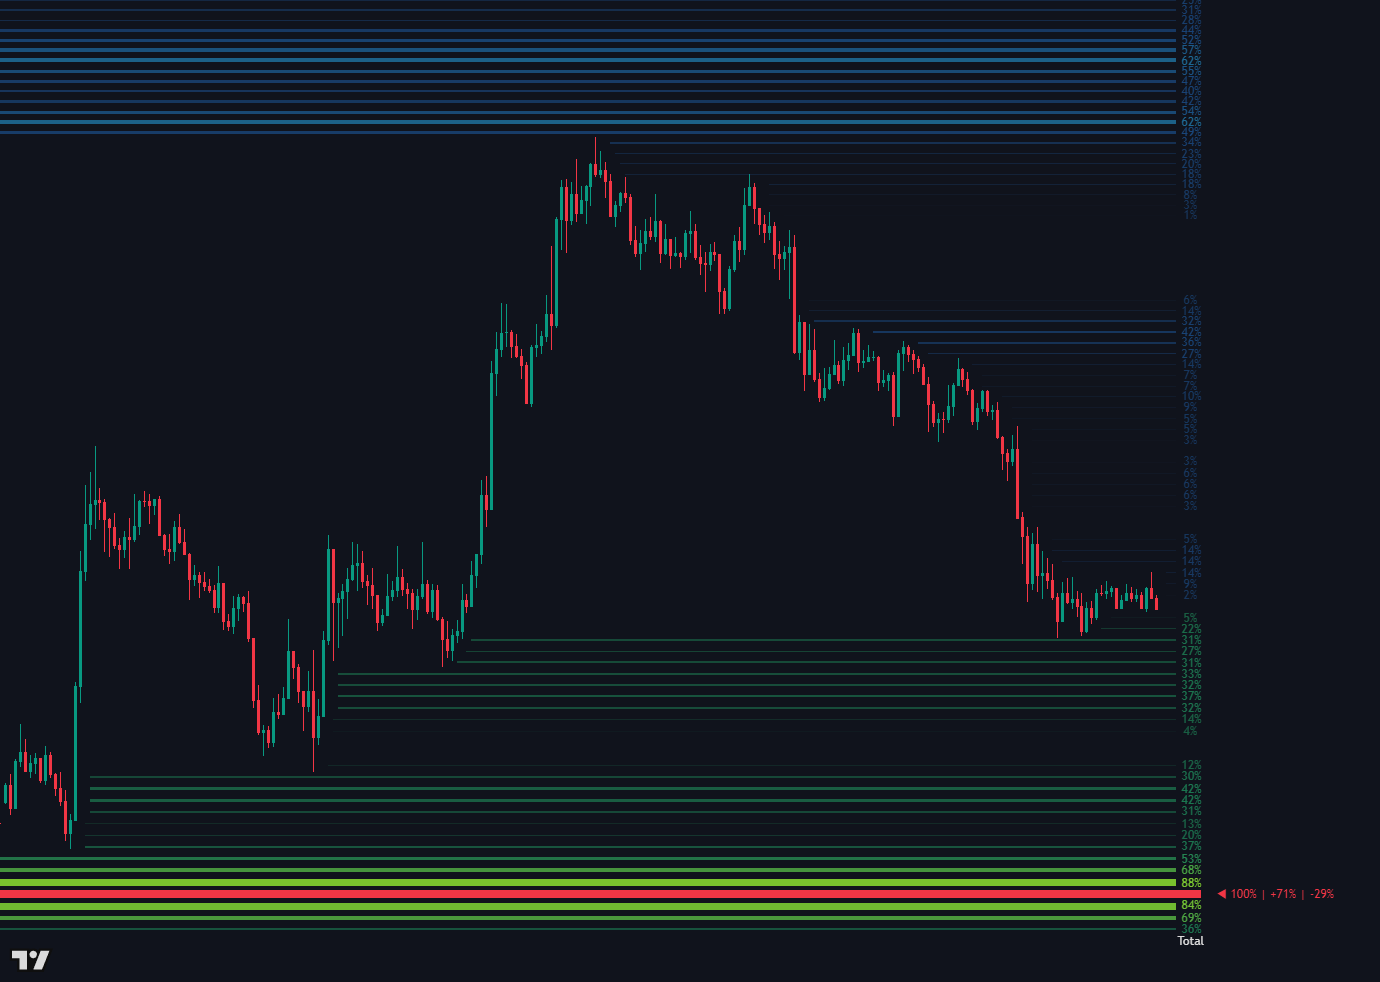
- Intensity Coloring: The lines use a gradient color system. Darker/faded colors indicate lower historical activity, while bright, vibrant colors indicate high-volume nodes or "liquidity explosions."
- Dynamic Mitigation: Lines are automatically removed (mitigated) once price crosses through them.
- Volume Labels: Significant levels are labeled with a percentage (e.g., 100%) indicating the relative strength of the liquidity at that specific price bin.
Liquidity Profile
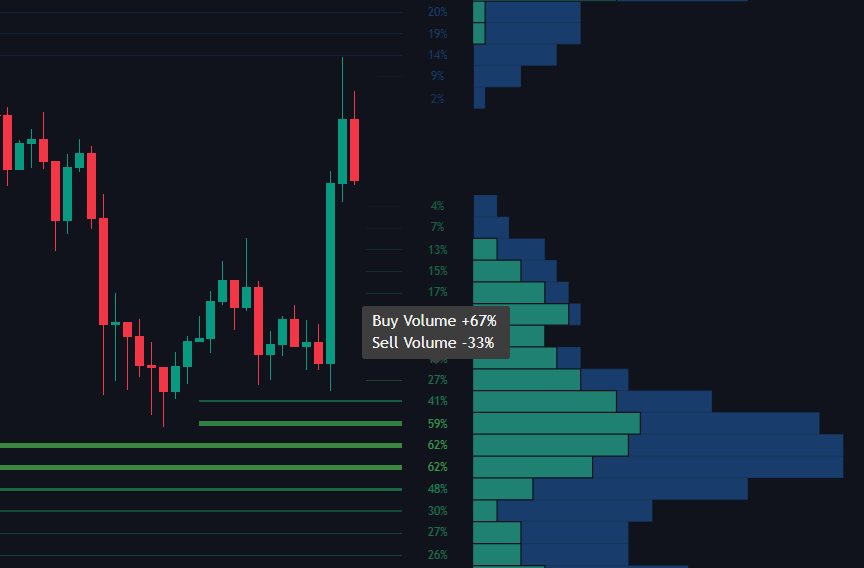
Two-Tone Liquidity Profile & Delta Distribution Tooltips
- Institutional Order Flow Mapping: Tracks the structural weight of resting institutional liquidity rather than basic historical traded volume.
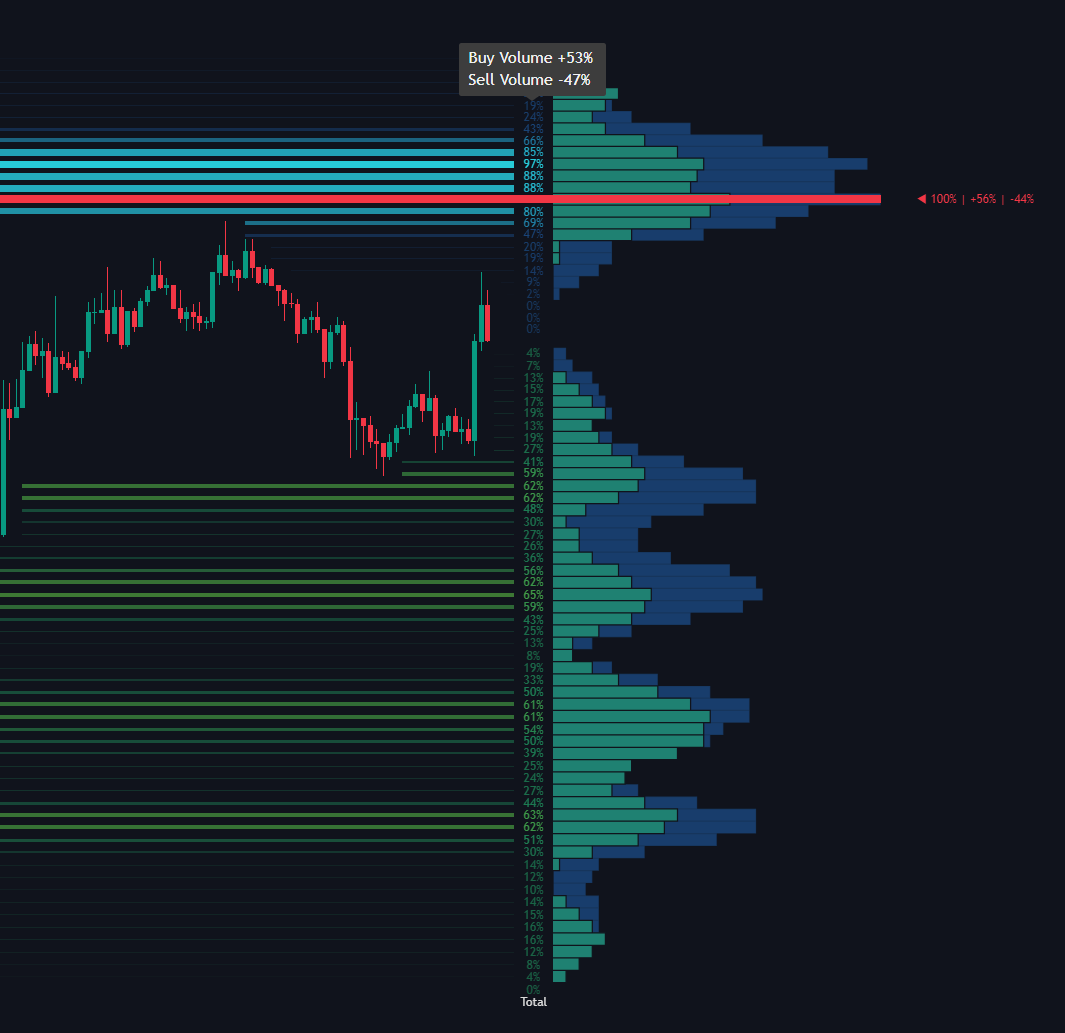
Buy/Sell Bar Segmentation: Horizontal spikes match clustered chart liquidity perfectly, now split into distinct buy and sell volume segments for real-time delta analysis.
Liquidity Bubbles (Visual Clusters)
When enabled, the "Bubbles" feature provides an immediate visual representation of volume intensity at pivot points.
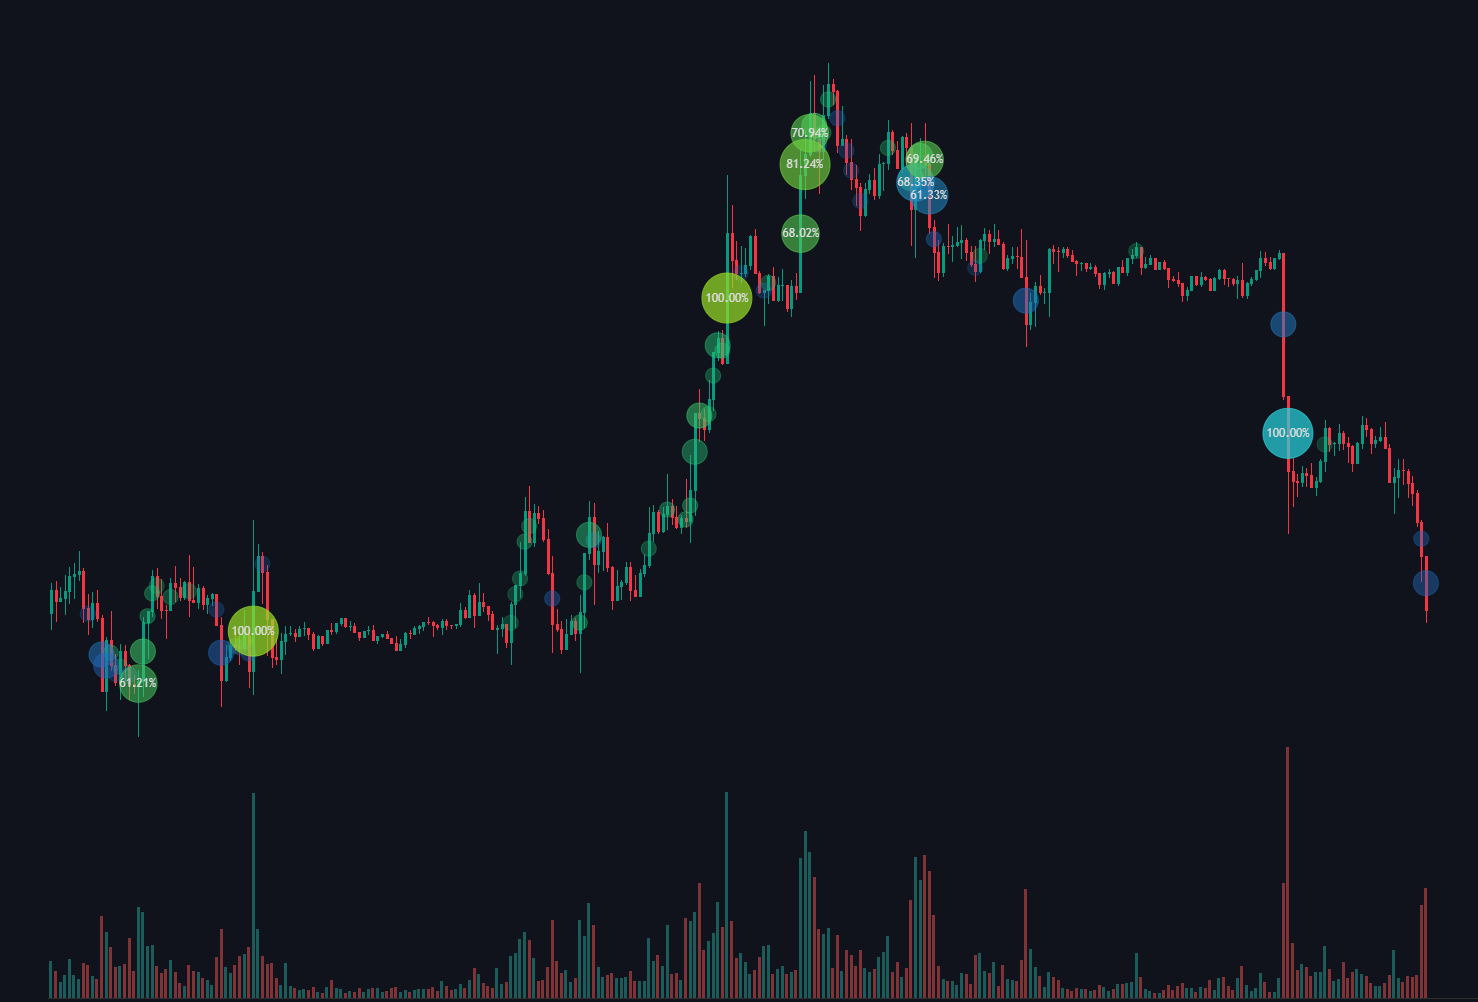
Size-Based Tiers:
The circles vary in size based on the relative volume of the pivot:
- Tiny: 20% - 40% Volume intensity.
- Small: 40% - 60% Volume intensity.
- Normal: 60% - 80% Volume intensity.
- Large (Huge): 80%+ Volume intensity (Ultra High Liquidity).
Color Logic:
The bubbles match the heatmap gradient, allowing you to quickly spot where the "smart money" has previously stepped in.
Settings
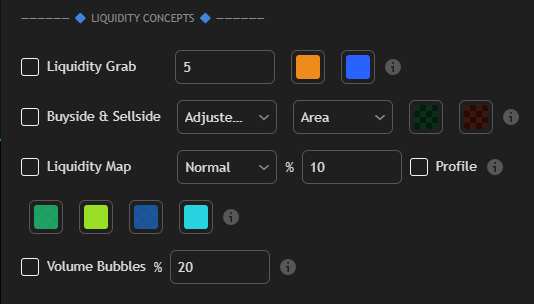
| Setting | Description |
|---|---|
| Liquidity Grab |
|
| Buyside & Sellside | Enabled via checkbox. Displays significant support and resistance zones. Users can toggle between Adjusted (refined) or Extreme (absolute) pivot points and choose between Area or Line visualization styles using the dropdown menus. |
| Liquidity Map |
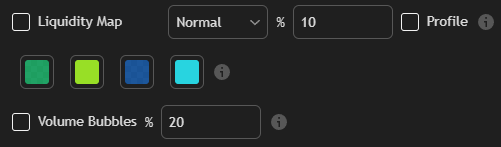
|
| Bubbles |
|
