
 X
X Facebook
 Discord
 Instagram
 YouTube
 ChatGPT
MACD Dashboard
The Dashboard provides a real-time overview of MACD-based signals across multiple timeframes in a compact, easy-to-read table. It helps you quickly scan for trend alignment, momentum shifts, and reversal opportunities without switching charts.
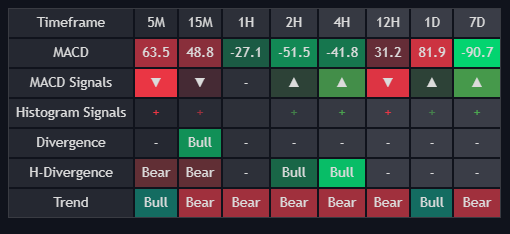
Dashboard Rows
Each row represents a different signal type:
| Row | Description |
|---|---|
| MACD | Current MACD value. Color indicates strength and direction (normalized). |
| MACD Signals | Displays ▲ (bullish) or ▼ (bearish) when a recent MACD reversal is detected. |
| Histogram Signals | Displays + when the histogram changes direction. |
| Divergence | Displays Bull or Bear when a valid MACD divergence is confirmed. |
| H-Divergence | Displays Hidden Bull or Bear when a valid MACD divergence is confirmed. |
| Trend | Displays Bull or Bear confirmed trend direction |
Signals are shown with a maximum history of 50 bars. Once a signal is older than 50 bars, it fades out and disappears.
The background color of each cell reflects how recent the signal is — newer signals have stronger color, older ones are dimmer.
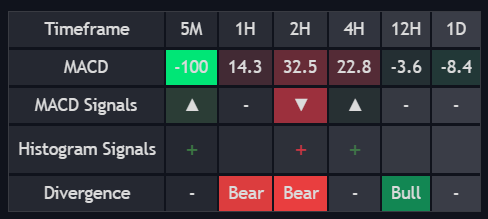
You can also hover your mouse over any signal to see a tooltip with the signal type and how many bars ago it occurred (e.g., "MACD Signal Down – 17 Bars Back").
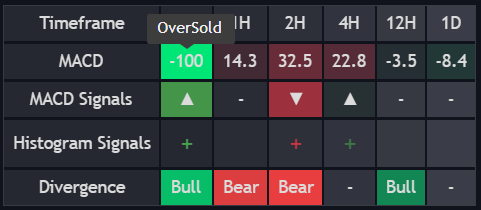
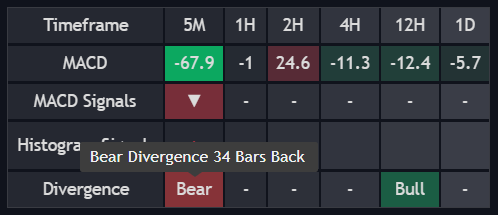
This makes it easy to:
- Confirm higher timeframe bias at a glance
- Time entries when multiple signals align
- Spot when a trend is weakening or momentum is shifting
Settings
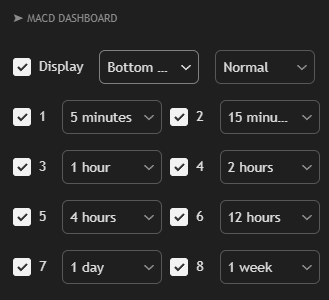
| Setting | Description |
|---|---|
| Display | Turns the dashboard on or off. |
| Position | Moves the dashboard to different corners of your chart (e.g., Bottom Right, Top Left) so it doesn't block your candles. |
| Size | Adjusts the overall scale (e.g., Normal or Compact) to better fit your screen size or resolution. |
| Timeframe Columns (1–6) | Sets which specific timeframes you want to track. Each column is independent, allowing for custom multi-timeframe monitoring. |
The Dashboard is your signal control center.
It tracks fresh MACD conditions across timeframes, filters out old data, and gives you immediate confirmation when signals align. Clean, visual, and built for quick decision-making.
