> For the complete documentation index, see [llms.txt](https://docs.bigbeluga.org/llms.txt).
> Markdown versions of documentation pages are available by appending `.md` to page URLs; this page
> is available as [Markdown](https://docs.bigbeluga.org/toolkits-pro-plus/nautilus-pro/wave-engine.md).
# Nautilus+ Wave Engine
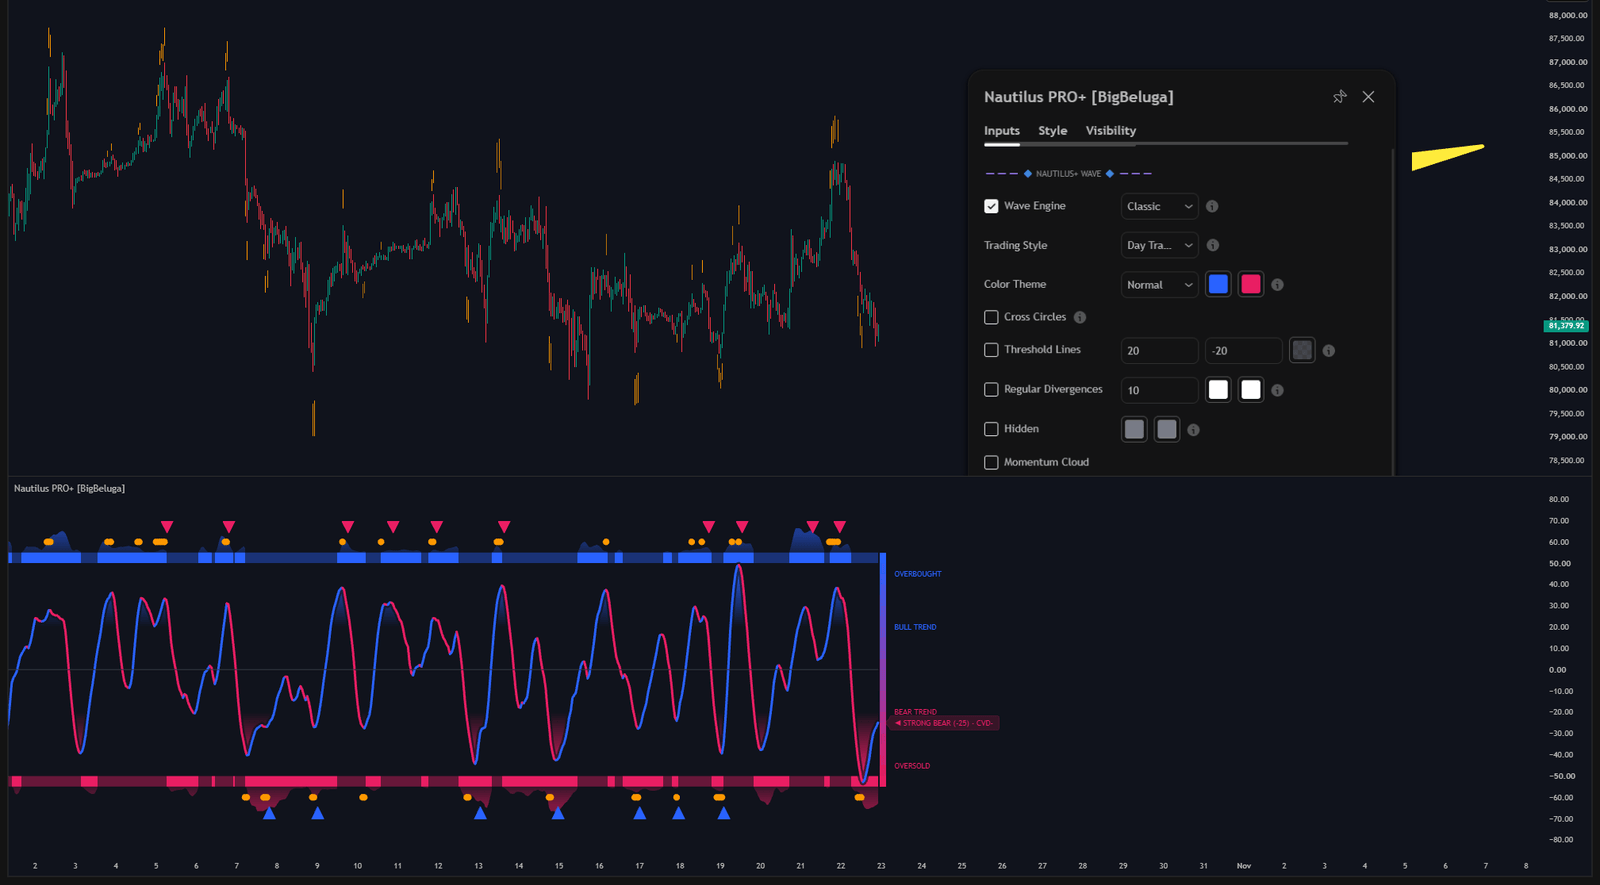
The Nautilus+ Wave is the core of the toolkit and the reason the rest of the pane can be trusted.
The Nautilus+ wave with its calculation modes and trading style presets
Standard oscillators measure how fast price is moving. The Nautilus+ Wave adapts to volatility and
trend efficiency, which keeps the reading meaningful in both fast expansions and long ranges.
## Three calculation modes
The **Wave Engine** dropdown switches how the wave is derived. The scale and the shape of the pane stay
the same, so you can compare the same market under different assumptions.
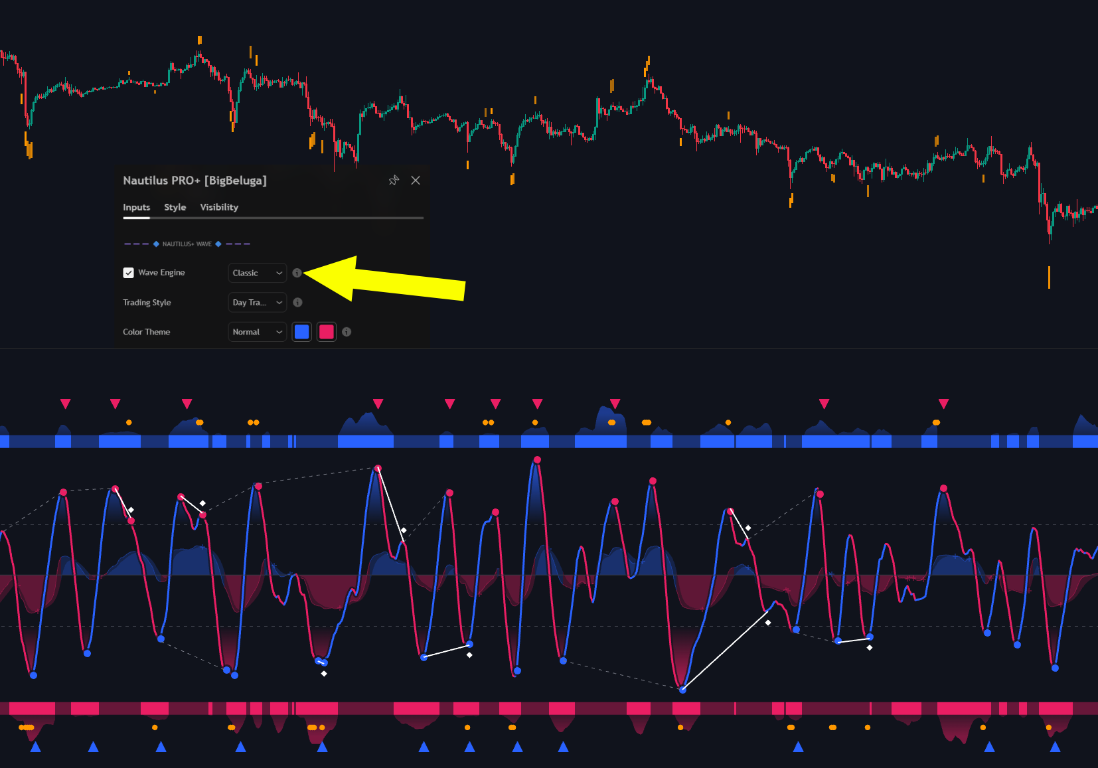
### Classic
Traditional momentum behaviour. It reacts to every swing, which makes it the most familiar reading and
the most talkative one.
Classic selected in the Wave Engine dropdown - fast, symmetrical swings across the whole pane
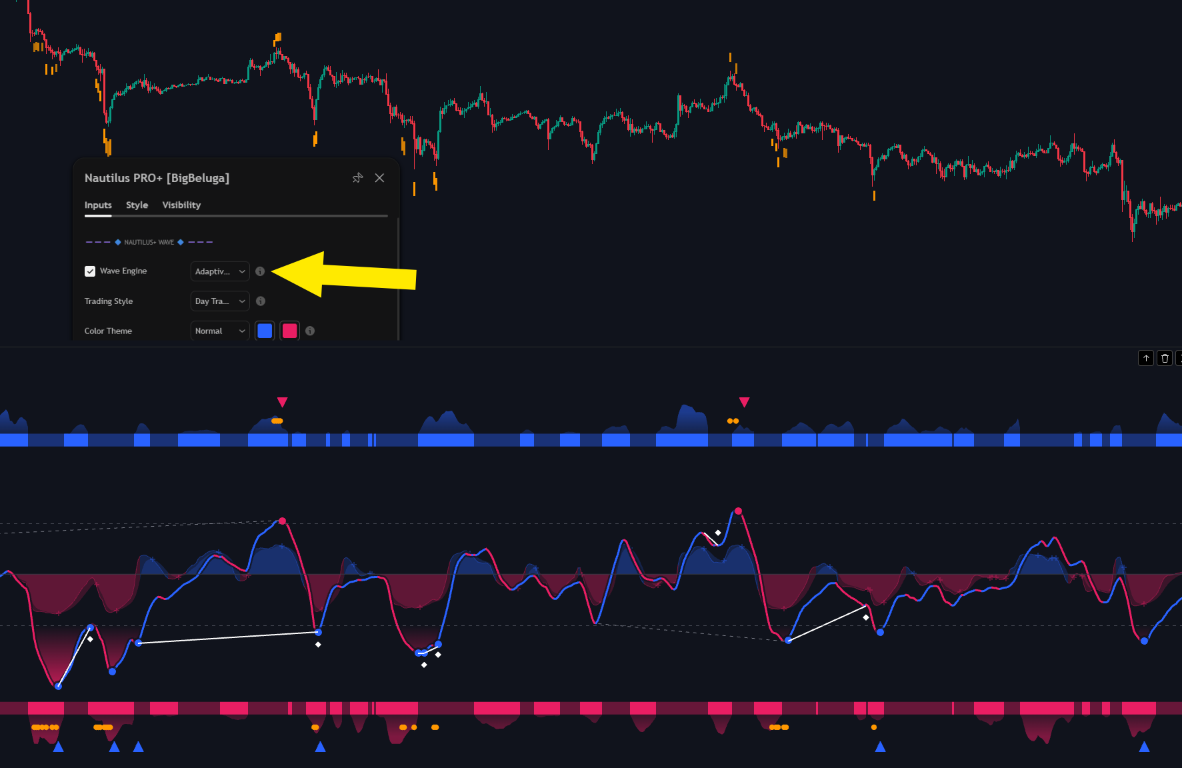
### Adaptive Trend
Range-damped stability. The wave smooths itself in chop, where false extremes are common, without
losing the swing structure that matters.
Adaptive selected in the Wave Engine dropdown - the same market with the noisy swings folded out
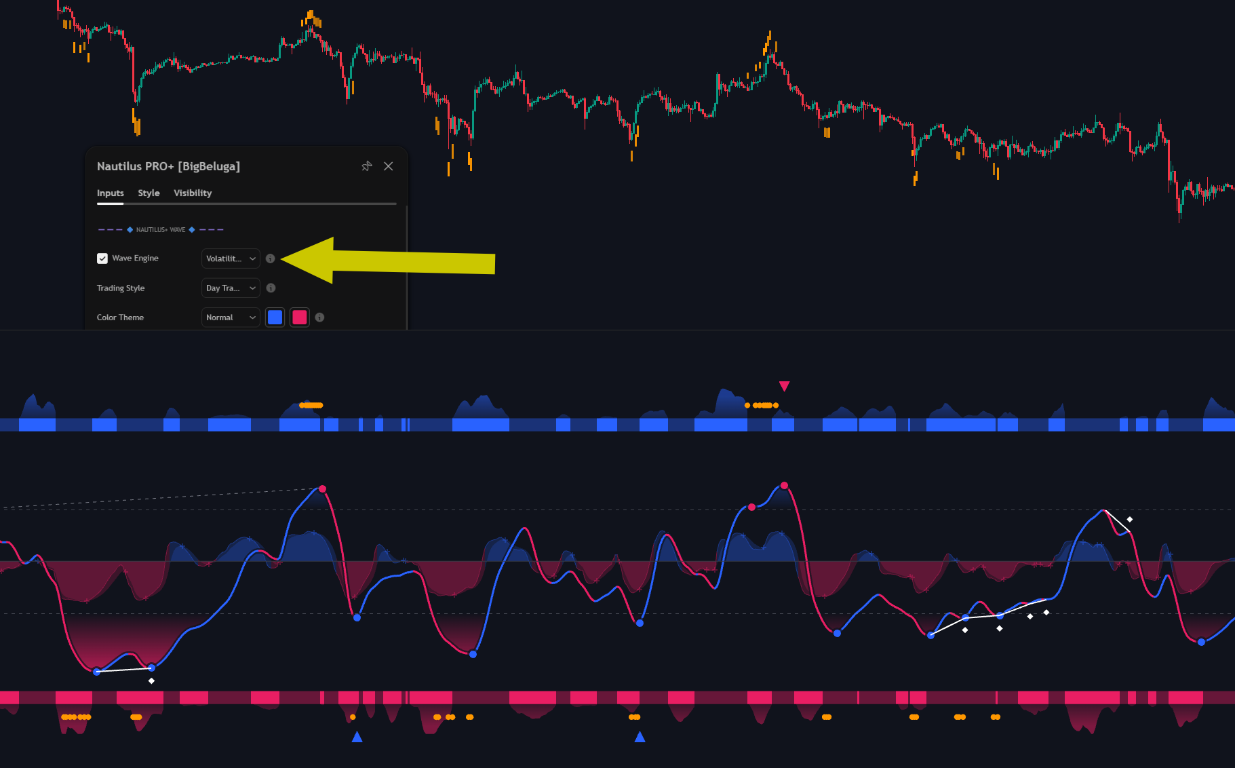
### Volatility Impulse
Smoothing that follows the volatility regime. The wave settles while volatility contracts and picks up
speed when the market expands, which keeps the momentum read clean through a breakout.
Volatility Impulse selected in the Wave Engine dropdown - a slower, cleaner wave while the market expands
## Trading style presets
The **Trading Style** dropdown recalibrates the engine in one click. There are three presets, and each
one is tuned for a different horizon rather than a different market:
- **Scalper** - the most reactive setting, built for very short holds
- **Day Trader** - the balanced default for intraday work
- **Swing Trader** - the slowest setting, for positions held across sessions
{% hint style="info" %}
Match the preset to the timeframe you actually trade. The swing setting on a one-minute chart produces
a wave that reacts far too slowly to be useful, and the scalper setting on a daily chart turns every
pullback into a signal.
{% endhint %}
## Regular and hidden divergences
Most divergence indicators mix two very different events into one signal. Nautilus PRO+ separates them,
and both are switched on from the same input group as the wave.
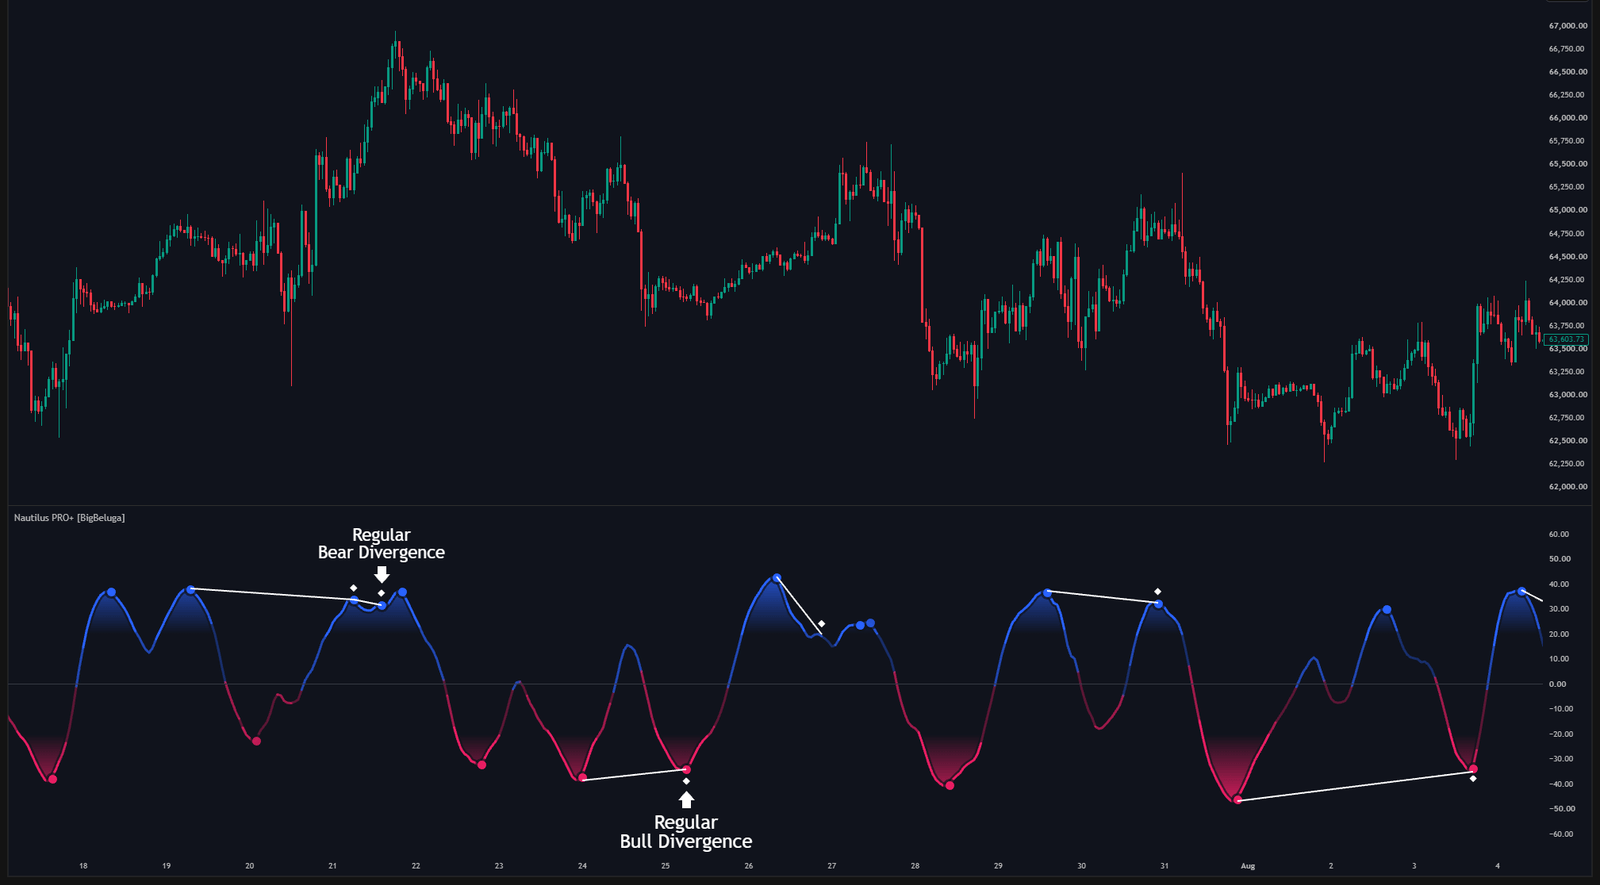
Regular divergence between price and the oscillator with the trigger candle marked
**Regular divergences** mark potential reversals and are drawn with solid lines.
- **Bearish** - price makes a higher high while the oscillator makes a lower high
- **Bullish** - price makes a lower low while the oscillator makes a higher low
They appear at the end of a move, when the last push had less momentum behind it than the one before.
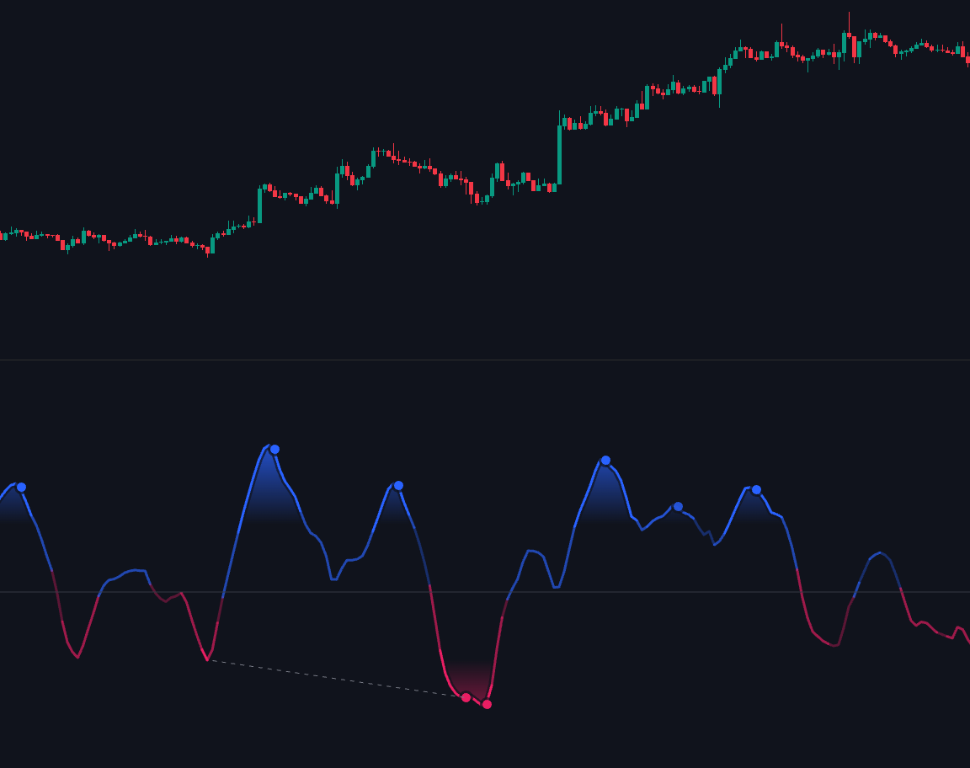
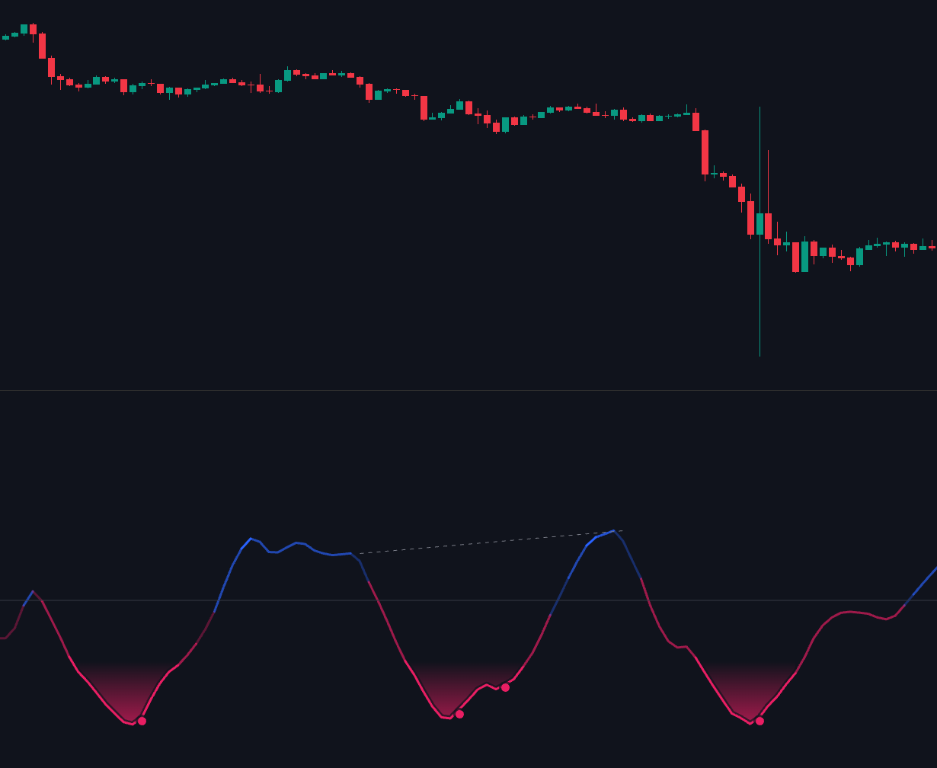
**Hidden divergences** mark continuations and are drawn with dashed lines.
- **Bullish hidden** - price makes a higher low while the oscillator makes a lower low, inside an
uptrend
- **Bearish hidden** - price makes a lower high while the oscillator makes a higher high, inside a
downtrend
Hidden bullish: price holds a higher low while the oscillator makes a lower low - the divergence argues for continuation of the uptrend
Hidden bearish: price leaves a lower high while the oscillator makes a higher high - the divergence argues for continuation of the downtrend
{% hint style="info" %}
Hidden divergences are the pullback entry inside a trend. They look like weakness on the oscillator
while the structure is still making progress, which is exactly what a healthy retracement looks like.
{% endhint %}
Both types mark the exact trigger candle with a diamond and use their own colours, so a chart with
several divergences stays readable. The lookback is set on the **Regular Divergences** row, and each
type is toggled independently.
## Momentum cloud and cross markers
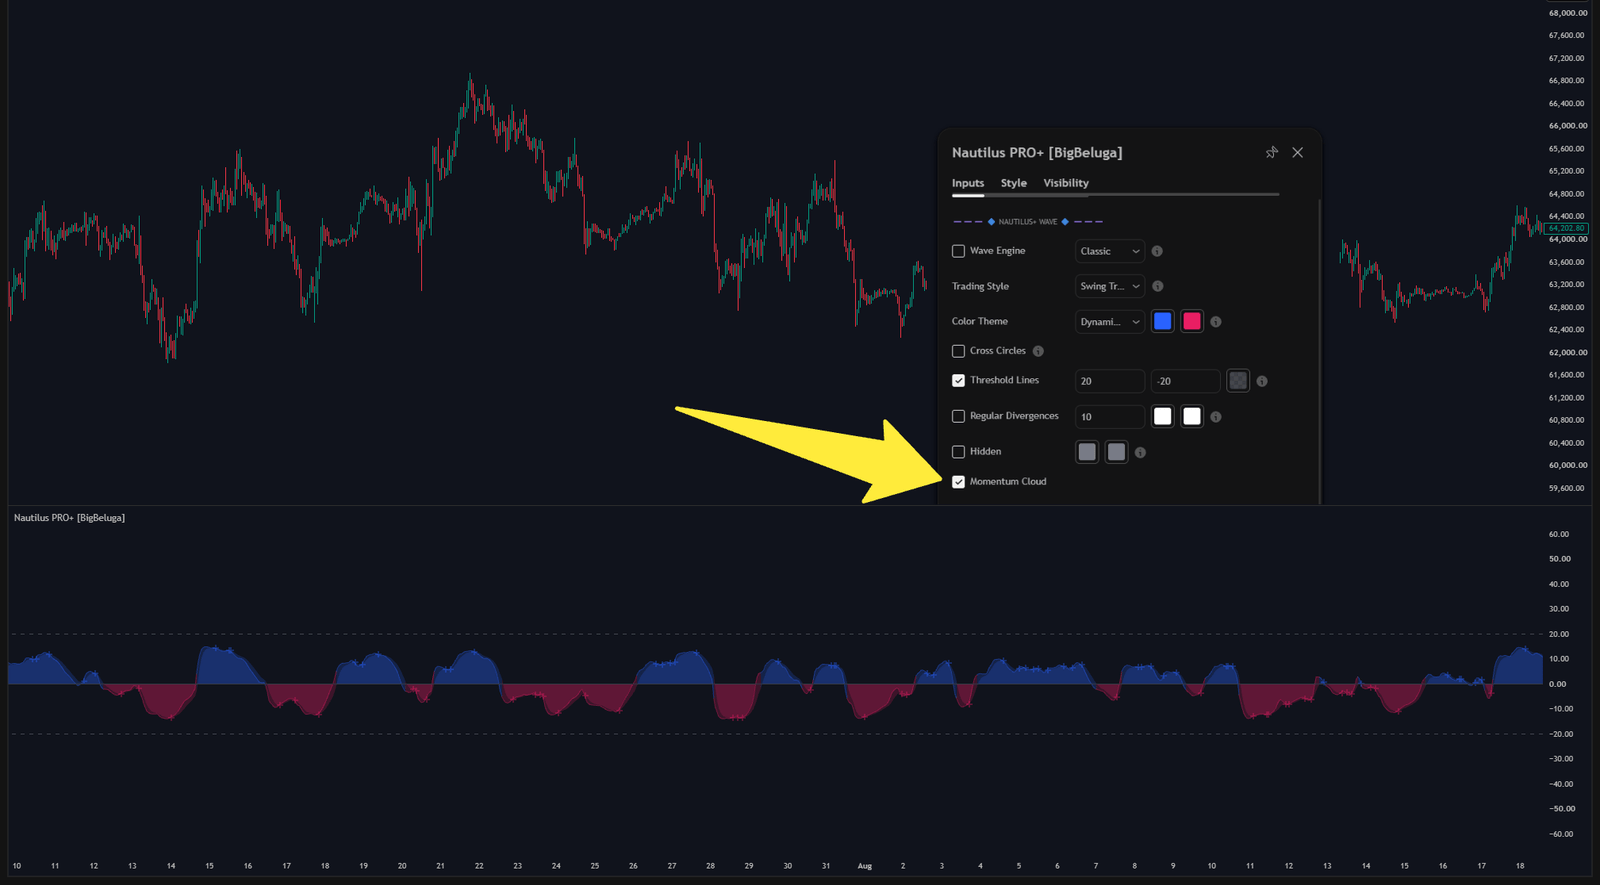
The momentum cloud plots two horizons of market force over the zero line and turns them into a
short-term timing tool.
The momentum cloud expanding through an efficient trend and contracting in chop
The cloud expands during high-efficiency trends and contracts when price is chopping. Its colour flips
with the direction of momentum, so a glance tells you whether the fast horizon is leading the slow one.
Reading the width matters as much as the colour:
- **Expanding cloud** — the trend is gaining strength, continuation is more likely
- **Flat cloud** — momentum is neutral, signals in the pane are less reliable
- **Collapsing cloud** — the trend is losing drive, expect a retest or a reversal
When the outer line crosses the signal line, the pane prints a cross marker. That is the short-term
momentum shift that usually precedes the larger move in the direction of the cloud.
{% hint style="info" %}
A cross against the cloud colour is a counter-trend signal. Treat it as a warning to manage an open
position, not as an invitation to reverse.
{% endhint %}
Cross markers also feed the strong confluence engine described in
[Reversals & Volume Exhaustion](/toolkits-pro-plus/nautilus-pro/reversals), where a wave cross plus a
CVD flip is what produces the highest-conviction triangles.
## Dynamic colouring
The **Color Theme** dropdown decides how the wave is coloured. Both themes use the same two base
colours set in the inputs — only the logic behind the shade changes.
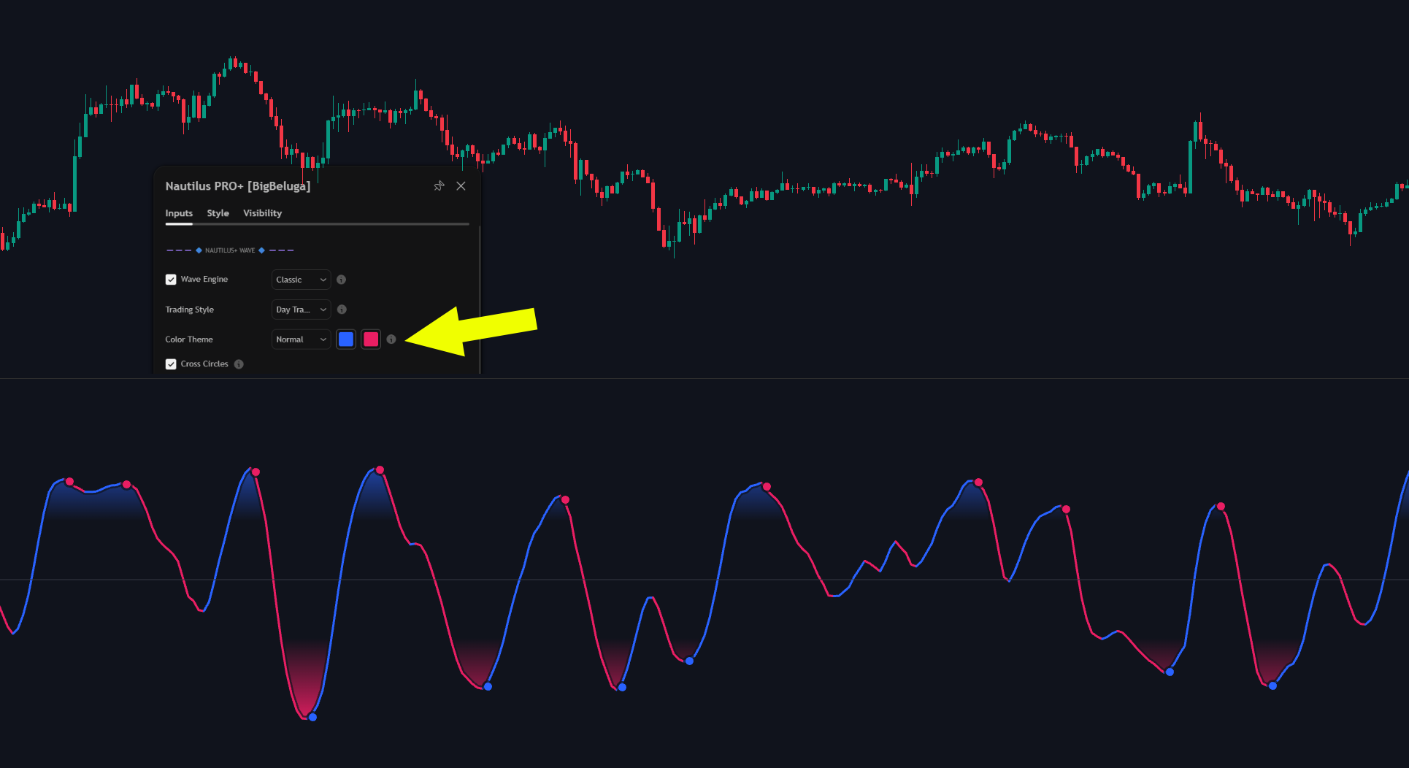
### Normal
The wave takes the bullish colour while the reading is above its smoothed line and the bearish colour
below it. Nothing else changes the shade, so the pane stays calm and easy to scan.
Normal theme selected in the Color Theme dropdown - every bullish swing is the same blue, every bearish swing the same red
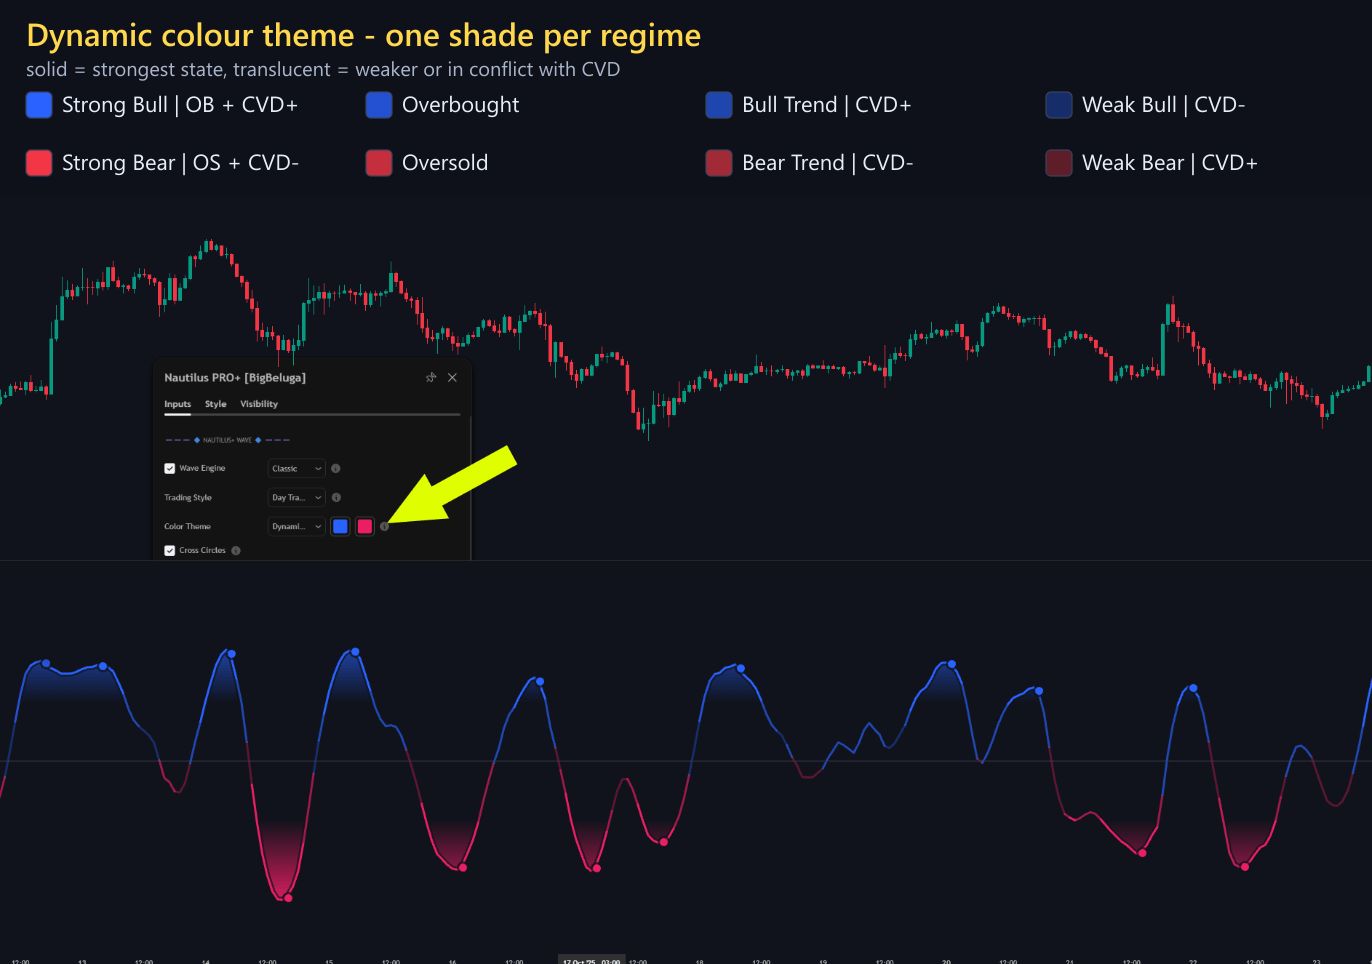
### Dynamic
The same base colours, but the shade now encodes the regime: how far the reading is from the
thresholds, and whether the rolling CVD agrees with it. Solid means the strongest state, translucent
means weaker or in conflict.
Dynamic theme selected in the Color Theme dropdown - the wave shade changes with the regime and with CVD agreement
| Shade | Condition | Reading |
| --------------------- | ---------------------- | ---------------------------------------------- |
| Solid bull colour | Overbought + CVD+ | Strong Bull - threshold and volume both bullish |
| Bull colour, 20% | Overbought | Overbought, no volume confirmation |
| Bull colour, 35% | Signal above 0 + CVD+ | Bull trend with volume behind it |
| Bull colour, 65% | Signal above 0, CVD- | Weak Bull - volume is against the trend |
| Solid bear colour | Oversold + CVD- | Strong Bear - threshold and volume both bearish |
| Bear colour, 20% | Oversold | Oversold, no volume confirmation |
| Bear colour, 35% | Signal below 0 + CVD- | Bear trend with volume behind it |
| Bear colour, 65% | Signal below 0, CVD+ | Weak Bear - volume is against the trend |
| Grey | No condition matches | Neutral reading |
That is why a wave rising with a faded colour deserves less trust than the same wave in solid colour:
the fade is the pane telling you the volume is not there.
## Settings
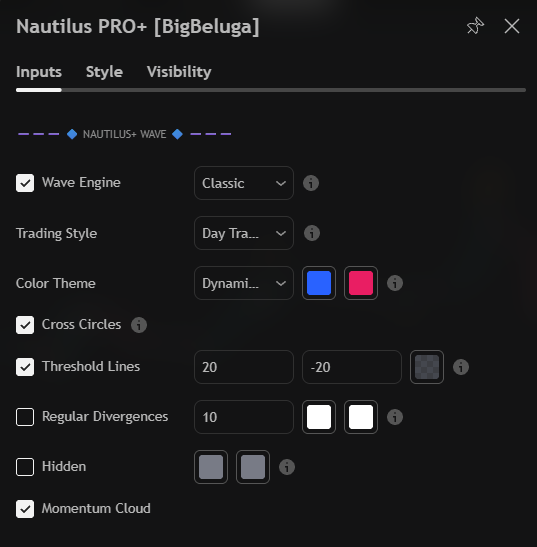
The NAUTILUS+ WAVE input group: wave engine mode, trading style, colour theme, cross circles, thresholds, divergences and the momentum cloud
| Settings | Description |
| ------------------- | -------------------------------------------------------------------- |
| Wave Engine | Classic, Adaptive Trend or Volatility Impulse. |
| Trading Style | Scalper, Day Trader or Swing Trader preset. |
| Color Theme | Normal (two-tone) or Dynamic (regime-shaded) colouring of the wave. |
| Cross Circles | Mark the wave extremes with circles. |
| Threshold Lines | Upper and lower overbought / oversold levels. |
| Regular Divergences | Enable solid-line reversal divergences and set their lookback. |
| Hidden | Enable dashed-line continuation divergences. |
| Momentum Cloud | Draw the momentum cloud behind the wave. |