> For the complete documentation index, see [llms.txt](https://docs.bigbeluga.org/llms.txt).
> Markdown versions of documentation pages are available by appending `.md` to page URLs; this page
> is available as [Markdown](https://docs.bigbeluga.org/toolkits-pro-plus/nautilus-pro/reversals.md).
# Reversals & Volume Exhaustion
Nautilus PRO+ detects reversals at two different levels of conviction, so a minor hook is never
mistaken for a real turn.
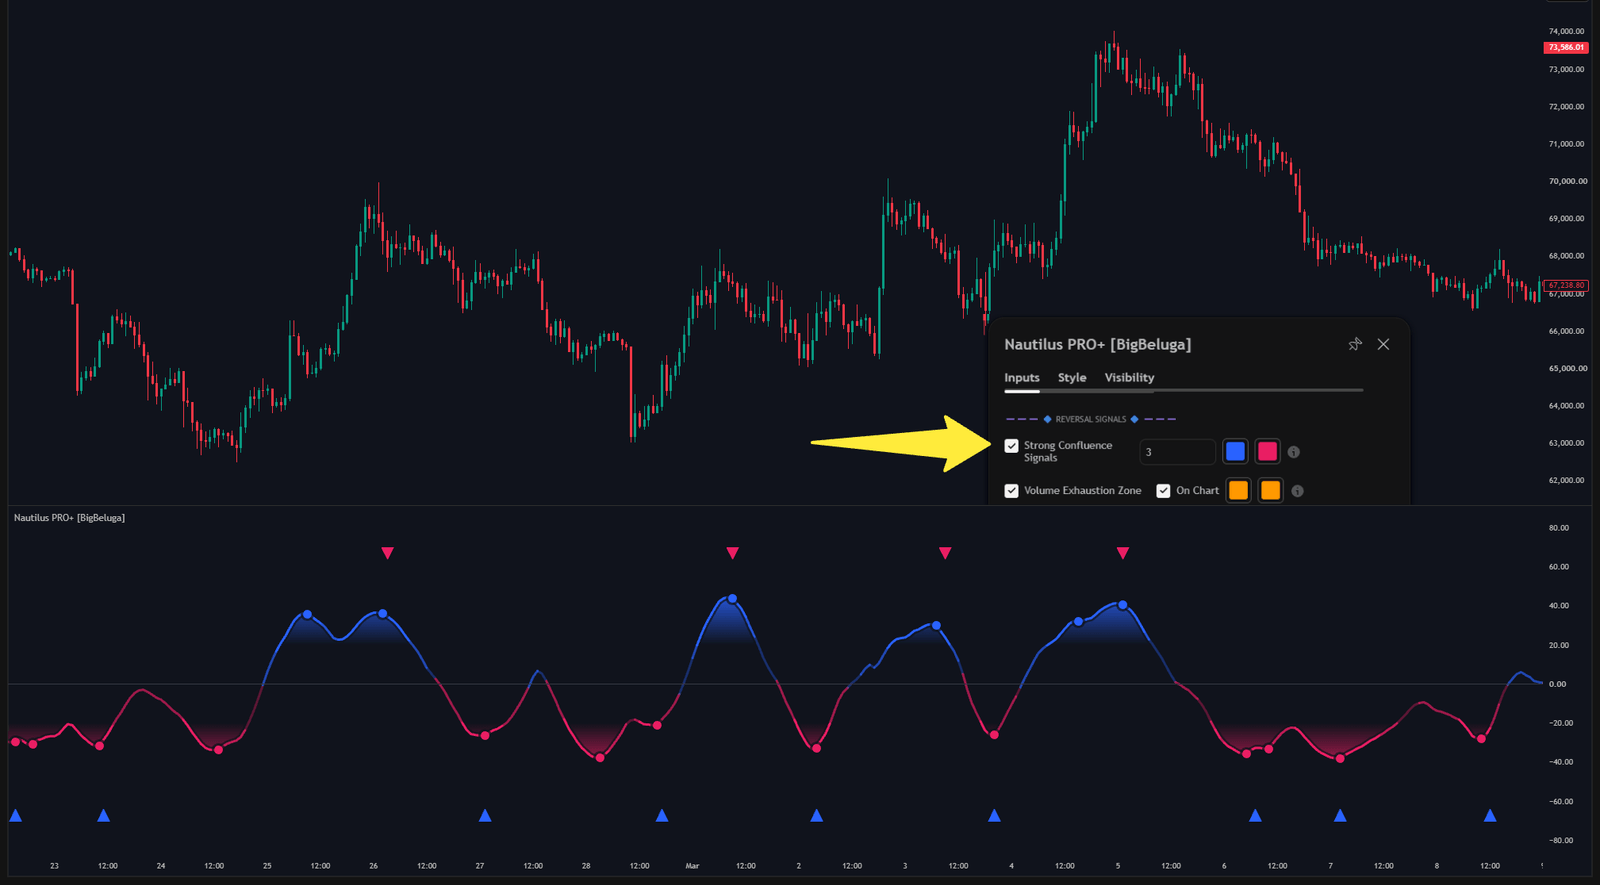
Strong confluence reversal triangles plotted alongside the confluence meter
## Strong confluence triangles
Triangles are the high-probability reversal markers. They fire only when both of these happen inside
a configurable sensitivity window:
1. the Nautilus wave leaves an overbought or oversold extreme and turns
2. the rolling CVD flips direction
Requiring both conditions filters the endless stream of exhaustion markers that appear when only
momentum turns but volume never confirms it.
## Volume exhaustion circles
Circles mark moments where price hooks back inside an extreme threshold zone while volume spikes.
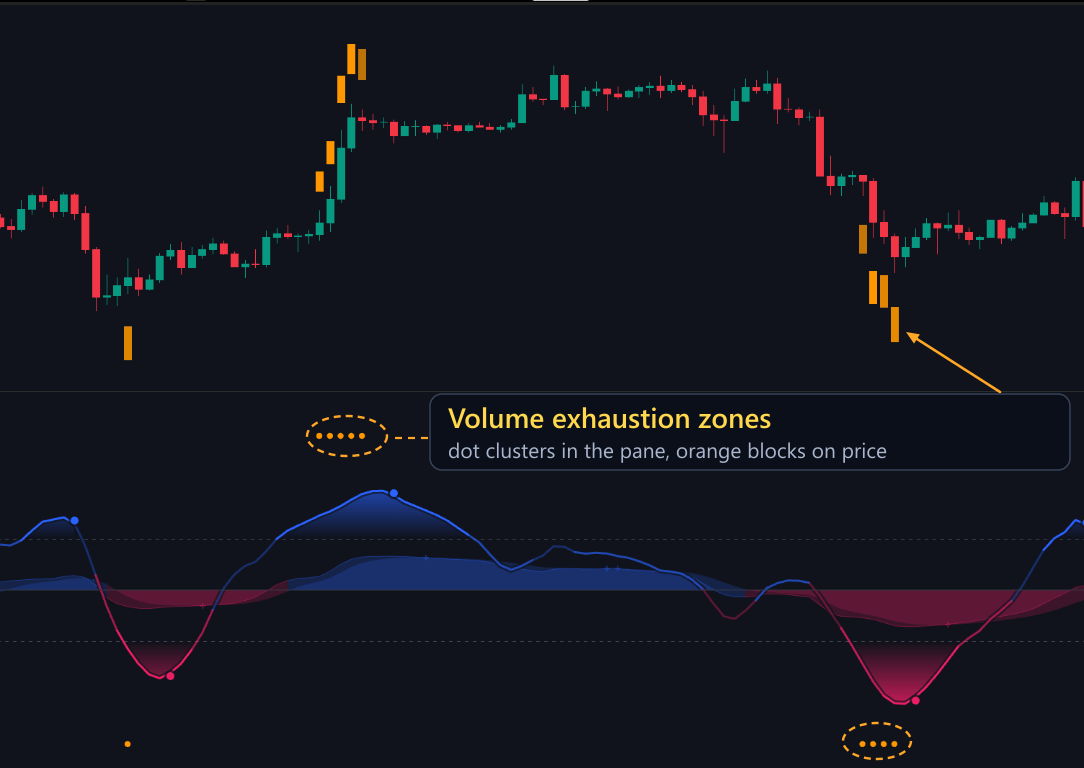
Exhaustion zones: dot clusters in the pane and the orange blocks projected onto the price chart
That combination — an extreme, a rejection and a volume burst — usually means aggressive traders were
absorbed at the top or the bottom of the move. With **On Chart** enabled the zone is also projected as
an orange block on the price chart, so the level stays visible once the oscillator has moved on.
{% hint style="info" %}
Exhaustion is the highest-risk point in a trend and the highest-reward point of a reversal. Size
accordingly: these markers are where stop placement matters most.
{% endhint %}
## Projection onto the price chart
When a volume exhaustion zone triggers, the toolkit can project a gradient block onto the main chart at
the level where the exhaustion occurred. The block stays there as a support or resistance reference
after the fact.
Reversal markers and exhaustion zones can be used independently as alert conditions or combined into
[custom alert sequences](/toolkits-pro-plus/nautilus-pro/custom-step-alerts).
## Settings
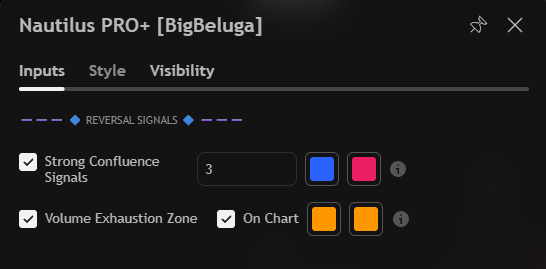
The REVERSAL SIGNALS input group: the confluence sensitivity, the exhaustion toggle with On Chart, and their colours
| Settings | Description |
| ------------------------- | -------------------------------------------------------------- |
| Strong Confluence Signals | Enable the strong confluence triangles and set the sensitivity. |
| Volume Exhaustion Zone | Enable the volume exhaustion markers. |
| On Chart | Project the exhaustion area onto the price chart. |
| Colours | Separate colours for the confluence and exhaustion markers. |