> For the complete documentation index, see [llms.txt](https://docs.bigbeluga.org/llms.txt).
> Markdown versions of documentation pages are available by appending `.md` to page URLs; this page
> is available as [Markdown](https://docs.bigbeluga.org/toolkits-pro-plus/nautilus-pro/cvd-bands.md).
# Confluence & CVD Bands
Momentum without participation is a trap. The confluence layer of Nautilus PRO+ shows who is actually
behind the wave.
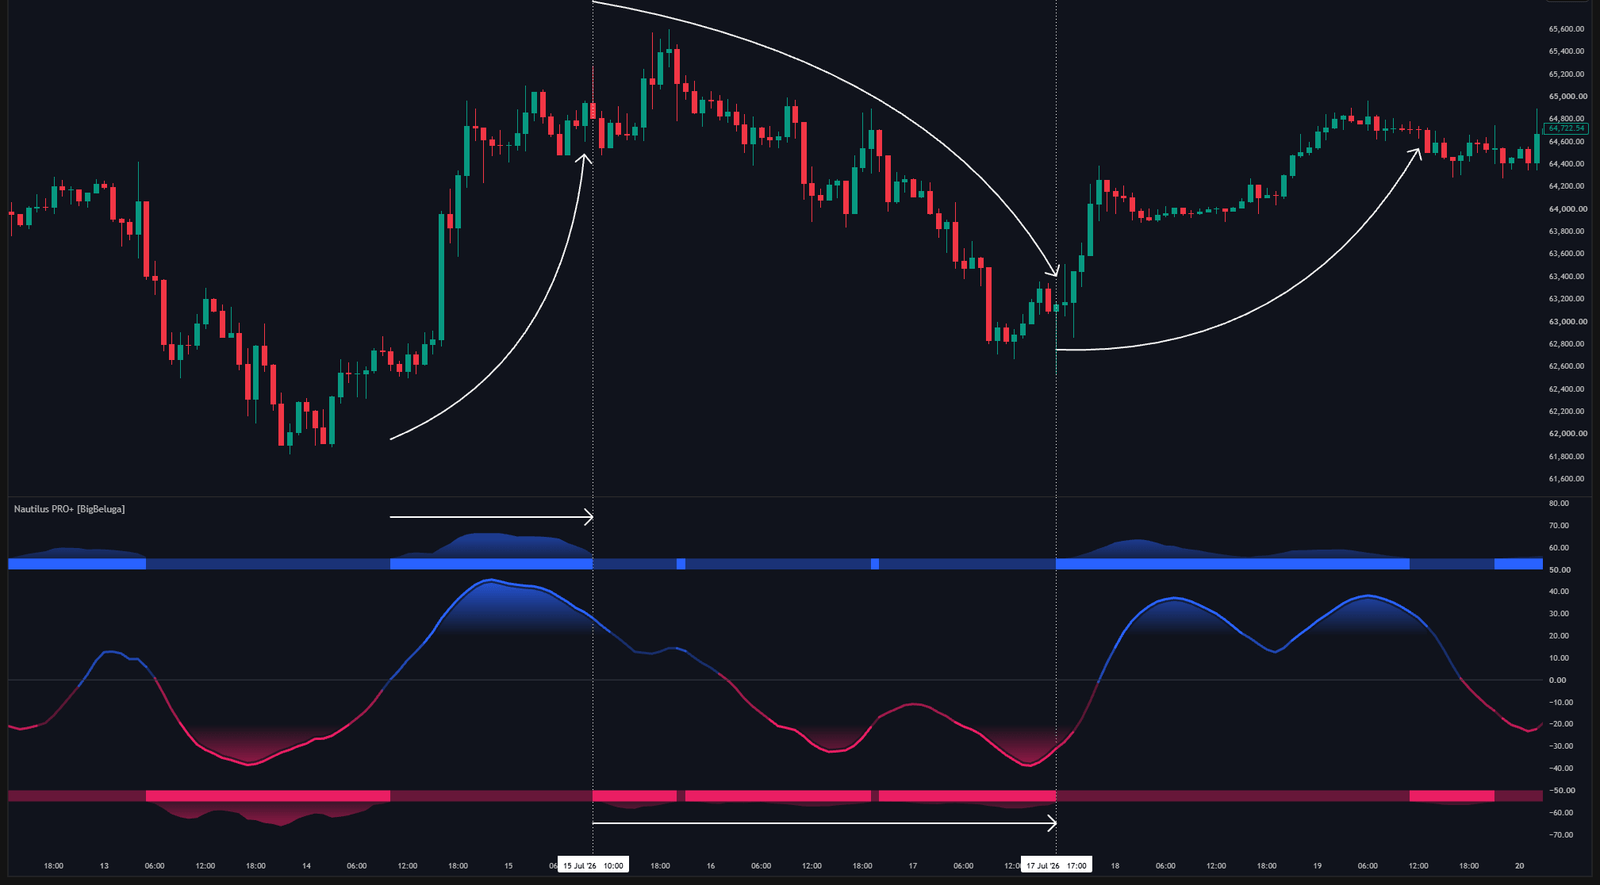
Rolling CVD bands expanding with volume aggression around the momentum cloud
## Rolling CVD
The engine accumulates aggressive buying minus aggressive selling over a rolling window instead of
the whole session. A rolling delta answers the practical question — is pressure building right now —
rather than mixing today's flow with flow from hours ago.
## CVD bands
The outer boundaries of the pane are driven by that rolling delta. The upper band activates when CVD
is positive, the lower band when it is negative, and both expand and contract with the size of the
aggression.
A wave pushing higher with an expanding upper band is a different trade from the same wave with a
quiet band. The first one has buyers; the second one has drift.
## Confluence meter
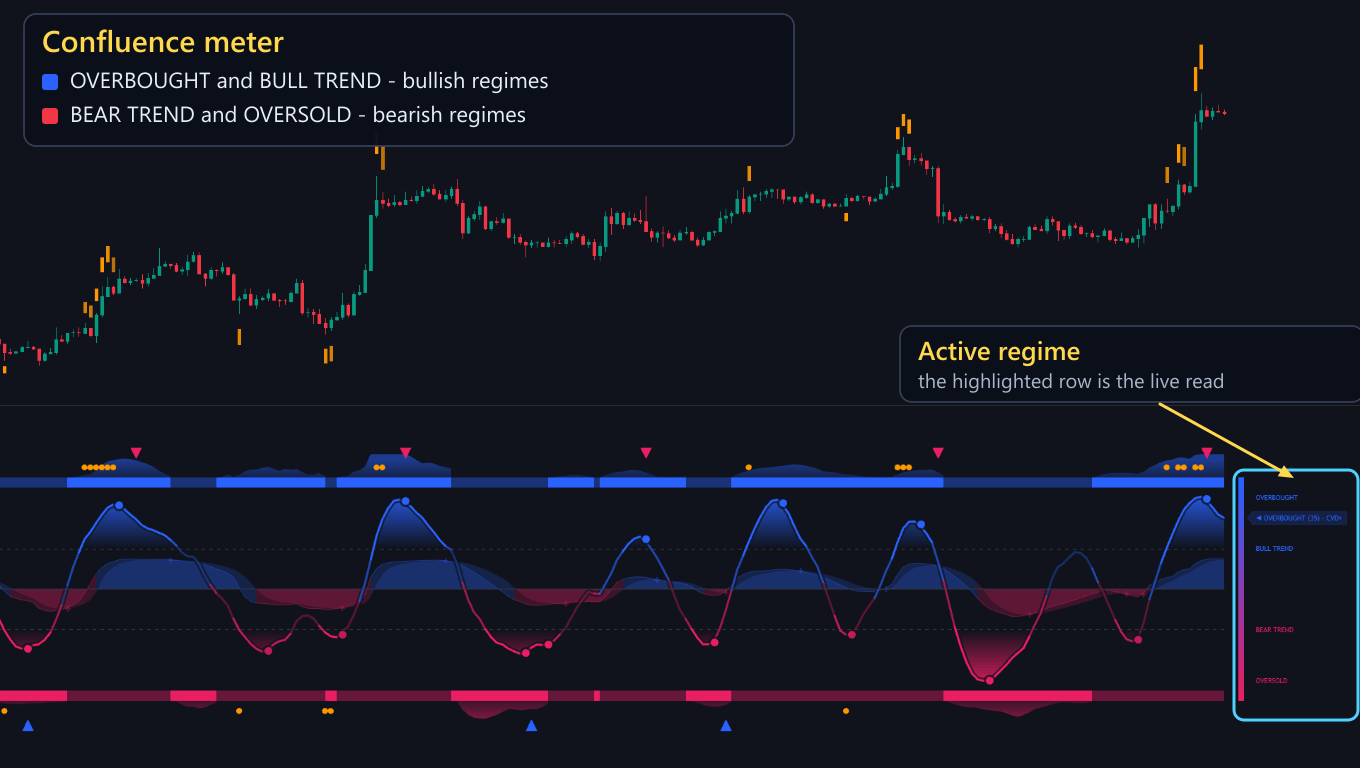
On the right side of the pane a vertical gauge names the current regime:
The confluence meter on the right of the pane: the bullish regimes in blue at the top, the bearish ones in red at the bottom, with the active row highlighted
- **OVERBOUGHT** — the wave is above the upper threshold
- **BULL TREND** — the wave is above zero but below the upper threshold
- **BEAR TREND** — the wave is below zero but above the lower threshold
- **OVERSOLD** — the wave is below the lower threshold
The marker rides the gauge at the current position and its label spells the whole state out: the
oscillator condition, a strength value in brackets, and the CVD direction — for example
`OVERBOUGHT (35) - CVD+` reads as an overbought wave, coloured at 35% weight, with cumulative delta
positive.
Because the CVD direction is part of the label, a confirmed reading and a conflicting one can never
look the same, which is the whole point of the meter.
{% hint style="info" %}
The meter is a summary, not a signal. Use it to decide whether the next marker is worth acting on,
then let the signals in the pane — crosses, divergences, confluence triangles — trigger the trade.
{% endhint %}
## Settings
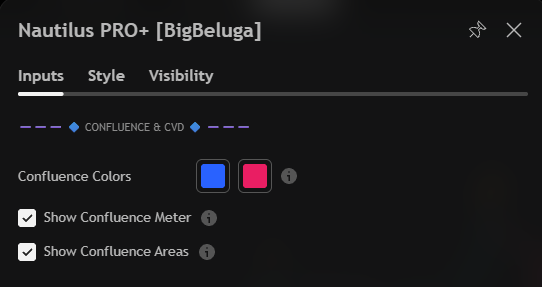
The CONFLUENCE & CVD input group: the two confluence colours and the meter and area toggles
| Settings | Description |
| --------------------- | ----------------------------------------------------------------- |
| Confluence Colors | Bullish and bearish colours used by the confluence layer. |
| Show Confluence Meter | Display the regime gauge on the right side of the pane. |
| Show Confluence Areas | Draw the shaded confluence areas inside the pane. |