> For the complete documentation index, see [llms.txt](https://docs.bigbeluga.org/llms.txt).
> Markdown versions of documentation pages are available by appending `.md` to page URLs; this page
> is available as [Markdown](https://docs.bigbeluga.org/toolkits-pro-plus/market-core-pro/cvd-divergence.md).
# CVD Divergence
Price tells you where the market went. Cumulative Volume Delta tells you which side paid for the move
— and when the two stop agreeing, the move is usually close to its end.
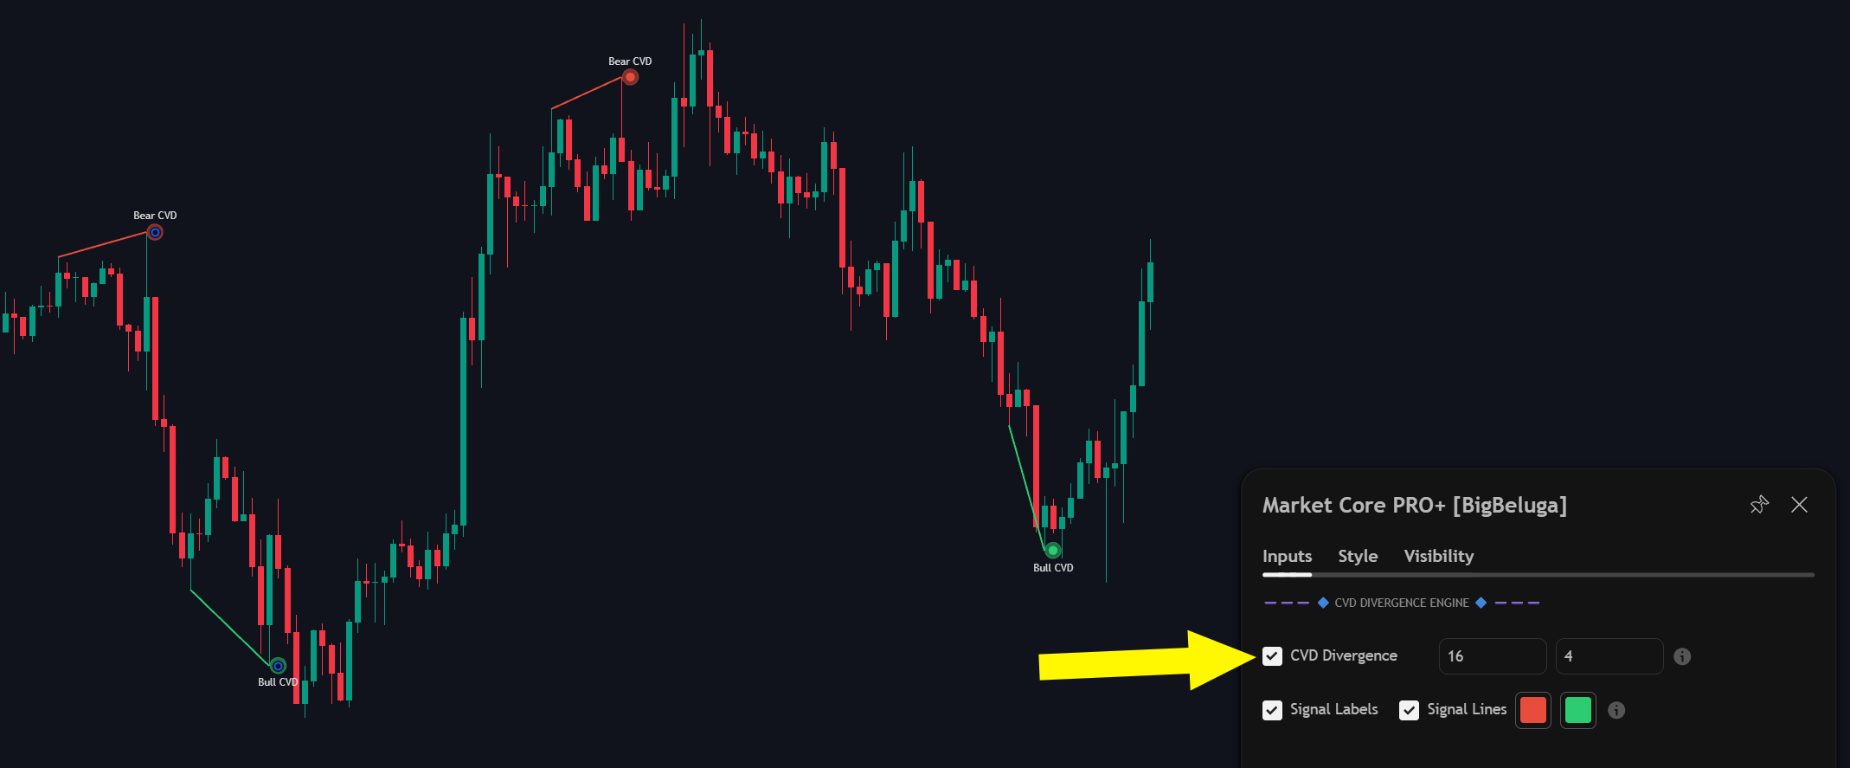
Bear and bull CVD divergences drawn between the pivots that created them
The divergence engine compares price swings with the underlying buying and selling pressure and marks
the points where the two diverge.
## How the engine reads pressure
Cumulative Volume Delta accumulates aggressive buying minus aggressive selling. In a healthy trend the
delta keeps making new extremes with price; when price makes a new high and the delta does not, the
breakout was not supported by real participation.
The comparison is made between consecutive pivots rather than between bars. The delta is smoothed
first, so a single large candle cannot create a divergence, and pivots have to be a minimum number of
bars apart before they are compared. A small ATR-based threshold filters the swings that are too
shallow to matter.
## Reading the markers
Each divergence is drawn between the two pivots and labelled on the chart:
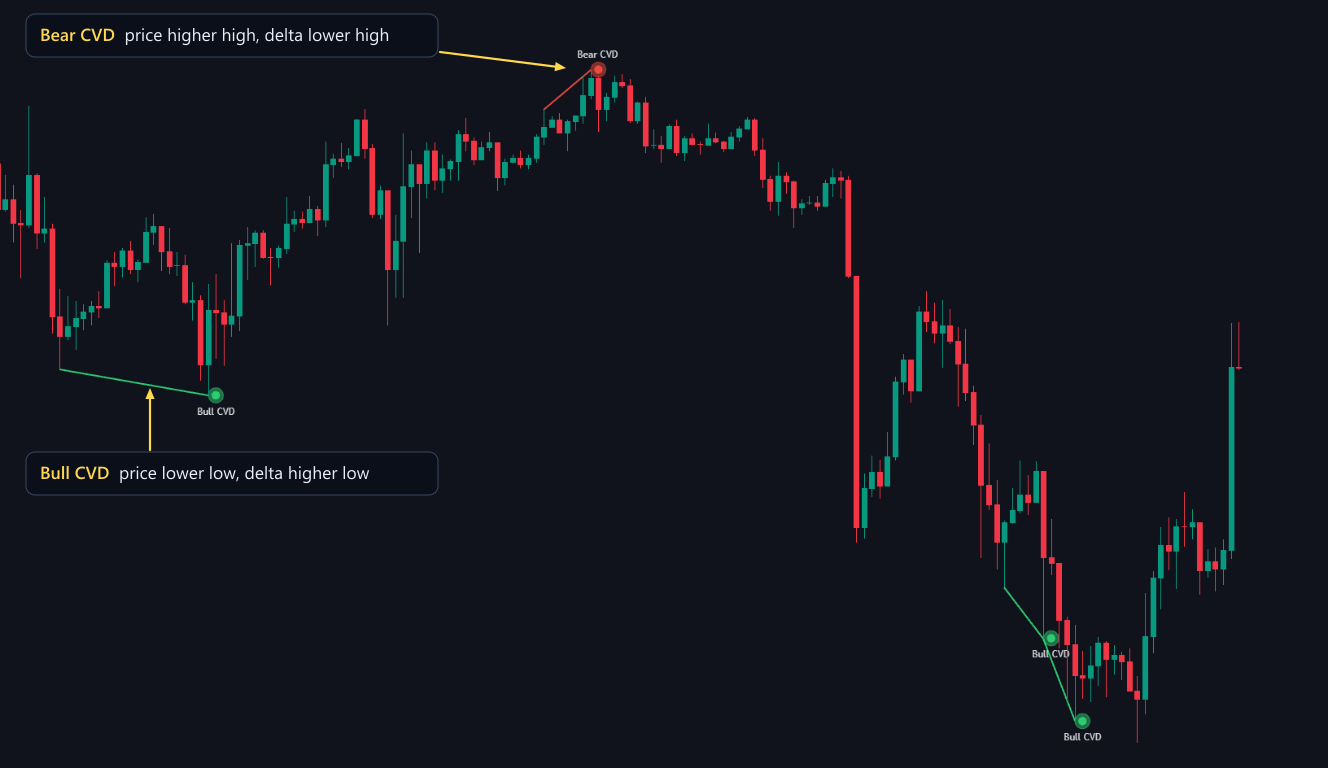
Bull CVD marks a lower low in price against a higher low in delta; Bear CVD marks a higher high in price against a lower high in delta
- **Bull CVD** — price made a lower low while the delta made a higher low.
- **Bear CVD** — price made a higher high while the delta made a lower high.
The label and the connecting line can be toggled independently, and the bullish and bearish colours
are configurable, so the chart keeps the markers you actually read.
A divergence on its own is a location, not a signal. It becomes actionable when it lines up with
something else on the chart:
- a divergence forming inside an active order block
- a divergence at the edge of a liquidity void
- a divergence right after a sweep of a swing high or low
{% hint style="info" %}
Bearish divergences form at the end of an advance, bullish ones at the end of a decline. Treat them
as exhaustion evidence and let the structure confirm the reversal before acting on them.
{% endhint %}
## Settings
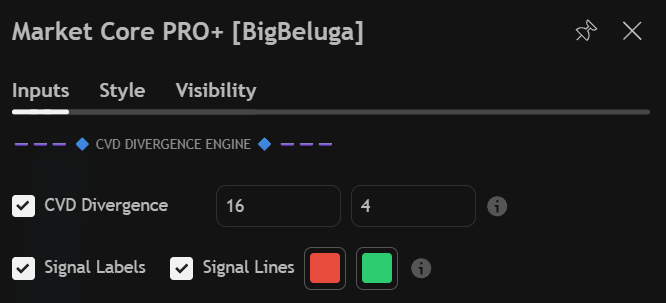
The Market Core PRO+ CVD divergence inputs
| Settings | Description |
| ------------------- | ------------------------------------------------------------------------------ |
| CVD Divergence | Enable or disable divergence detection. |
| Smoothing | Delta smoothing period. Higher values compare slower, cleaner delta swings. |
| Pivot spacing | Minimum distance between two pivots, in bars, before they are compared. |
| Signal Labels | Print the Bull CVD and Bear CVD labels on the chart. |
| Signal Lines | Draw the line between the two pivots that form the divergence. |
| Bearish / Bullish | Colours used for bearish and bullish divergences. |
Divergences are also available as an alert condition, or as a step inside a
[custom step alert sequence](/toolkits-pro-plus/market-core-pro/custom-step-alerts).