> For the complete documentation index, see [llms.txt](https://docs.bigbeluga.org/llms.txt). Markdown versions of documentation pages are available by appending `.md` to page URLs; this page is available as [Markdown](https://docs.bigbeluga.org/screeners/smart-money-concept-screener/market-structure-ms.md).
# Market Structure (MS)
### Overview
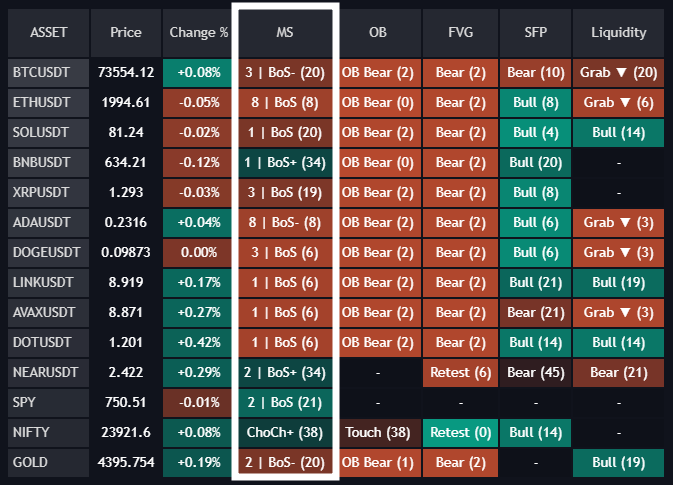
The MS column tracks institutional order flow transitions by monitoring structural breaks of swing highs and swing lows. It features automated consecutive streak counting and tracks signal age via a bar decay system.
#### [**Market Core Market Structure**](/main-toolkits/market-core-pro-tm/market-structure.md)
### Table Values & States
* ChoCh (+ / -): Change of Character. The very first initial structural shift in trend. A `+` suffix denotes a positive volume delta (buying volume dominance greater than 55%), while a `-` suffix denotes a negative volume delta (selling volume dominance greater than 55%).
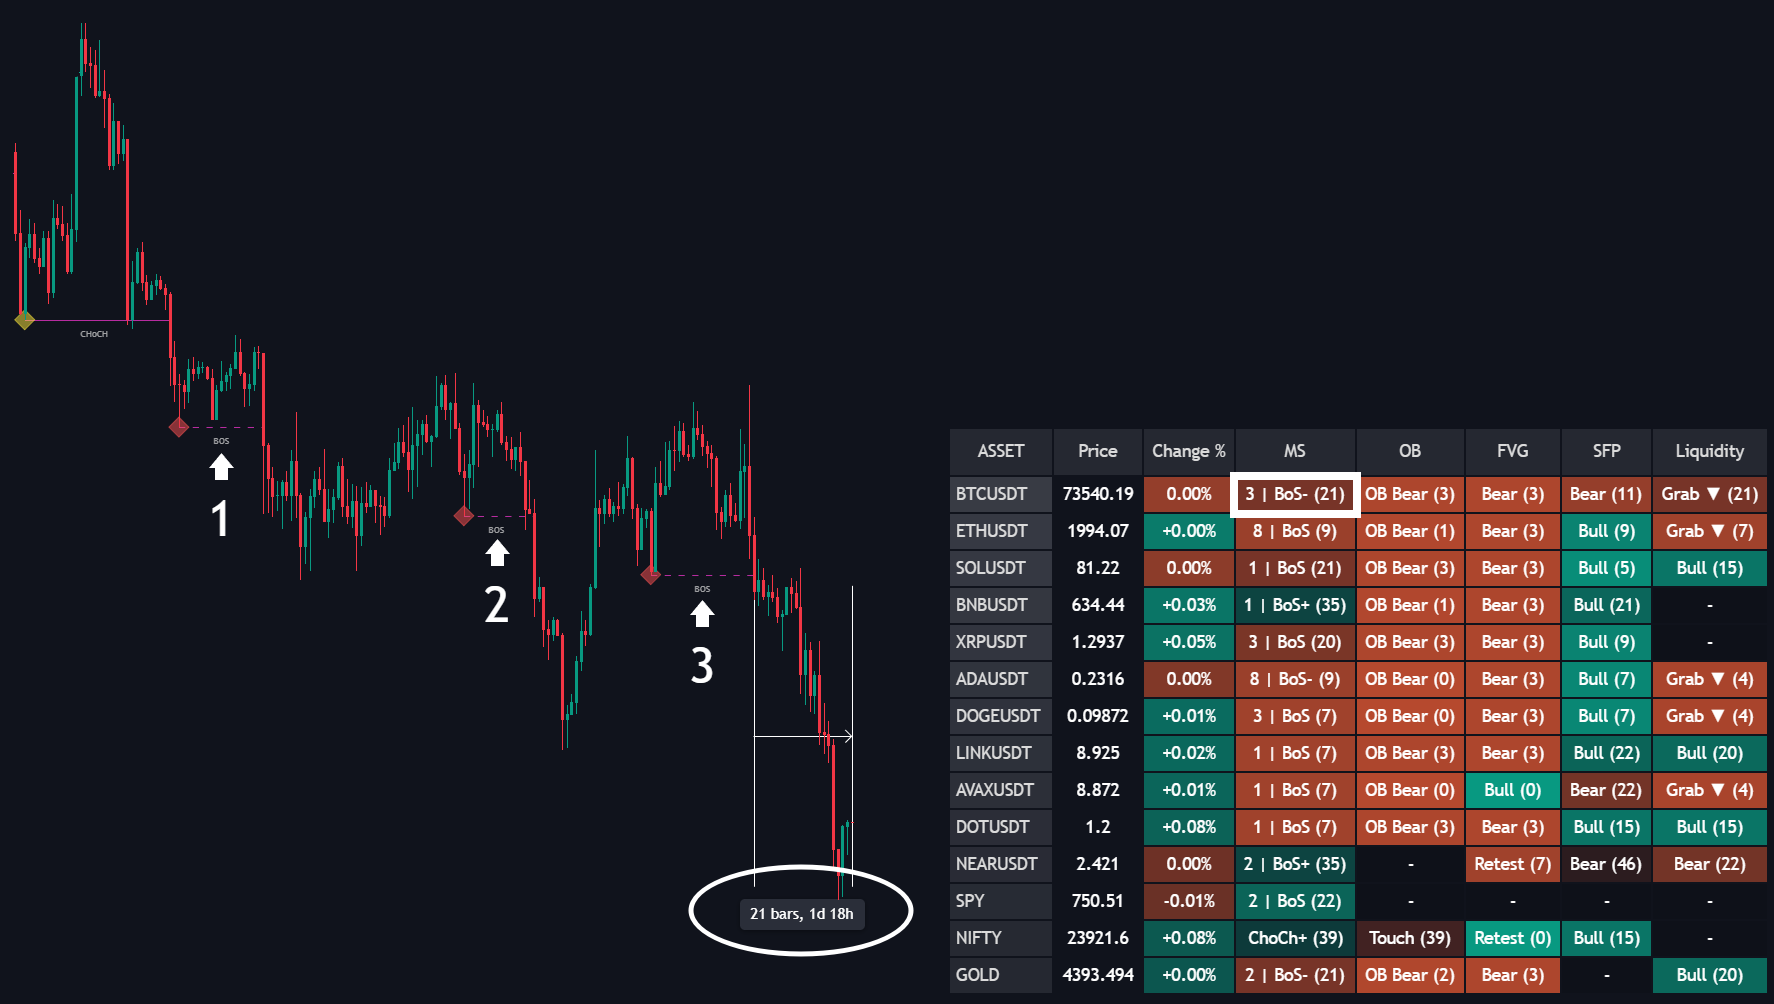
* \[Count] | BoS (+ / -): Break of Structure. Confirms trend continuation. The integer prefix automatically counts exactly how many times the asset has sequentially broken structure in that direction (e.g., `3 | BoS+`).
* (# bars ago): A trailing number in parentheses showing exactly how many bars have passed since the structural event printed.
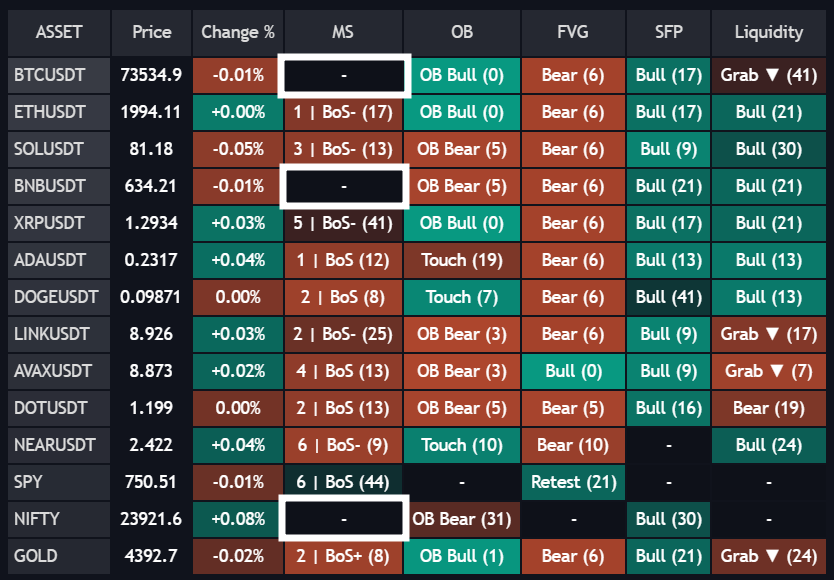
* Dash `-`: No active market structure signals within your configured Signals Lookback window.
### Interface Visuals
* Teal Cells: Bullish structural continuation or reversal trends.
* Red Cells: Bearish structural continuation or reversal trends.
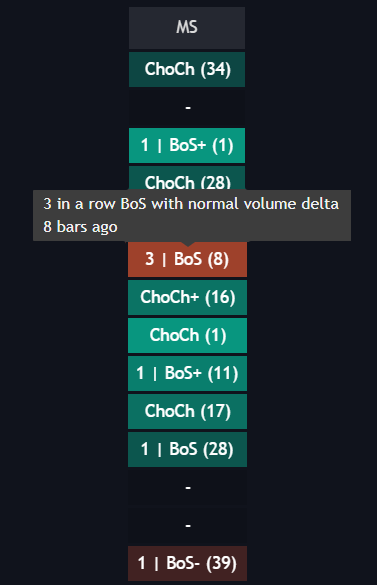
* Tooltips: Hovering over the cell reveals the exact context: `[Streak Count] in a row BoS with [positive/negative/normal] volume delta [X] bars ago`.
### How to Use It
* Catch Trend Reversals (ChoCh): When an asset flips from a dash `-` to a fresh ChoCh+ (1), it is your cue that the bearish trend has ended. Drop to a lower timeframe immediately to look for an entry, as institutional order flow has flipped bullish.
* Ride Strong Trends (BoS Streaks): Use the consecutive count to gauge trend maturity. An asset showing `1 | BoS+` is a fresh, reliable continuation play. If an asset shows `5 | BoS+`, the trend is highly extended—warn yourself to stop buying breakouts and instead wait for a deep retracement.