> For the complete documentation index, see [llms.txt](https://docs.bigbeluga.org/llms.txt). Markdown versions of documentation pages are available by appending `.md` to page URLs; this page is available as [Markdown](https://docs.bigbeluga.org/screeners/nautilus-mean-reversion-screener/nautilus-signals.md).
# Signals (Buy/Sell)
The first row of the matrix is the one most traders watch: a `BUY` or a `SELL` when the asset is stretched far enough to be worth a reversal attempt. In the Nautilus Mean Reversion Screener this is the row that decides whether an asset is worth opening at all.
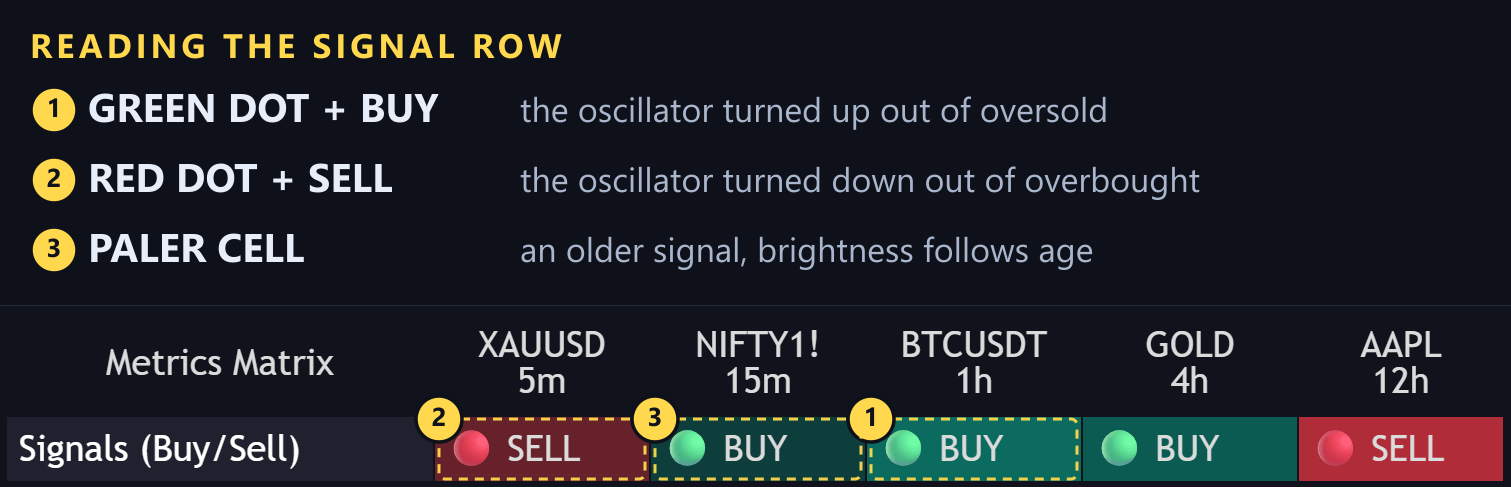
Buy and sell signals across five assets, each coloured by direction and faded by age
## What the signal is
The trigger comes from the Nautilus wave engine. A **Buy** prints when the oscillator turns up out of an oversold reading, a **Sell** when it turns down out of an overbought one. It is a mean reversion trigger, so the expectation is a move back toward the middle of the range — not a new trend.
That distinction matters when you size a position. A mean reversion entry is taken against the current move.
## Direction colours
* **BUY** — green text with a green dot
* **SELL** — red text with a red dot
The dot is the same idea as the cell shade: the fresher the event, the brighter it reads.
## Reading the age
Brightness is age. A cell is at full strength on the bar the signal printed and fades from there, until it drops out of the matrix once it passes the **Signals Lookback**.
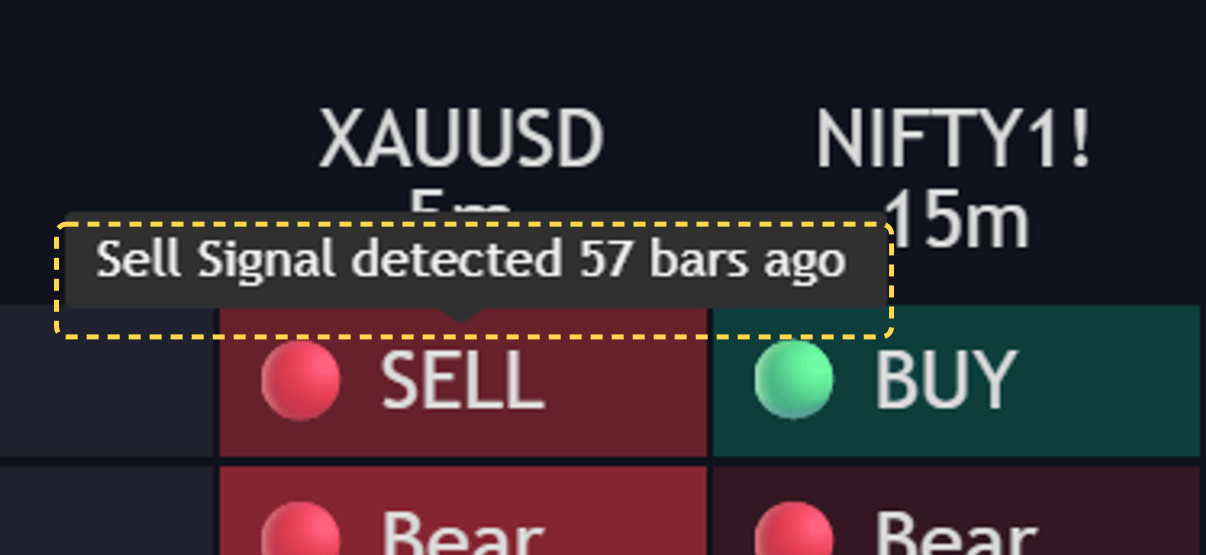
Hovering the XAUUSD cell reports the exact age: Sell Signal detected 57 bars ago
The tooltip is the only place the exact number appears, so hover before you act on a pale cell — a two-bar-old signal and a fifty-bar-old one look similar at a glance and mean very different things.
## Sensitivity presets
The whole engine is calibrated by one setting — the trading style preset:
| Preset | Character |
| --- | --- |
| **Scalper** | Fast — more signals, shorter holds |
| **Day Trader** | Balanced — the default |
| **Swing Trader** | Broad — fewer signals, bigger swings |
Switching the preset changes what counts as stretched for every row in the table, not just this one.
{% hint style="info" %}
Pick the preset from the timeframe you scan most, not from your temperament. A scalper preset on a one-day column produces a signal almost every other candle, which defeats the point of a screener.
{% endhint %}
## Using the row
* **A fresh signal on one asset** is a single reading. Useful, but not a setup on its own.
* **A fresh signal plus a divergence and a positive flow reading** in the same column is why the matrix exists.
* **A signal against Trend Sync** is the weaker version — the structure disagrees with the reversal attempt.
The row also drives the `Buy / Sell Signals` alert, so any asset that triggers appears in your alerts with its ticker, timeframe and price.