> For the complete documentation index, see [llms.txt](https://docs.bigbeluga.org/llms.txt). Markdown versions of documentation pages are available by appending `.md` to page URLs; this page is available as [Markdown](https://docs.bigbeluga.org/screeners/nautilus-mean-reversion-screener.md).
# Nautilus Mean Reversion Screener
Six markets of exhaustion in one table.
The **Nautilus Mean Reversion Screener** watches up to six symbols and timeframes at once. Every column is one asset; every row is one reading of how stretched that asset is — signals, divergences, extremes, trend agreement, money flow and volume delta.
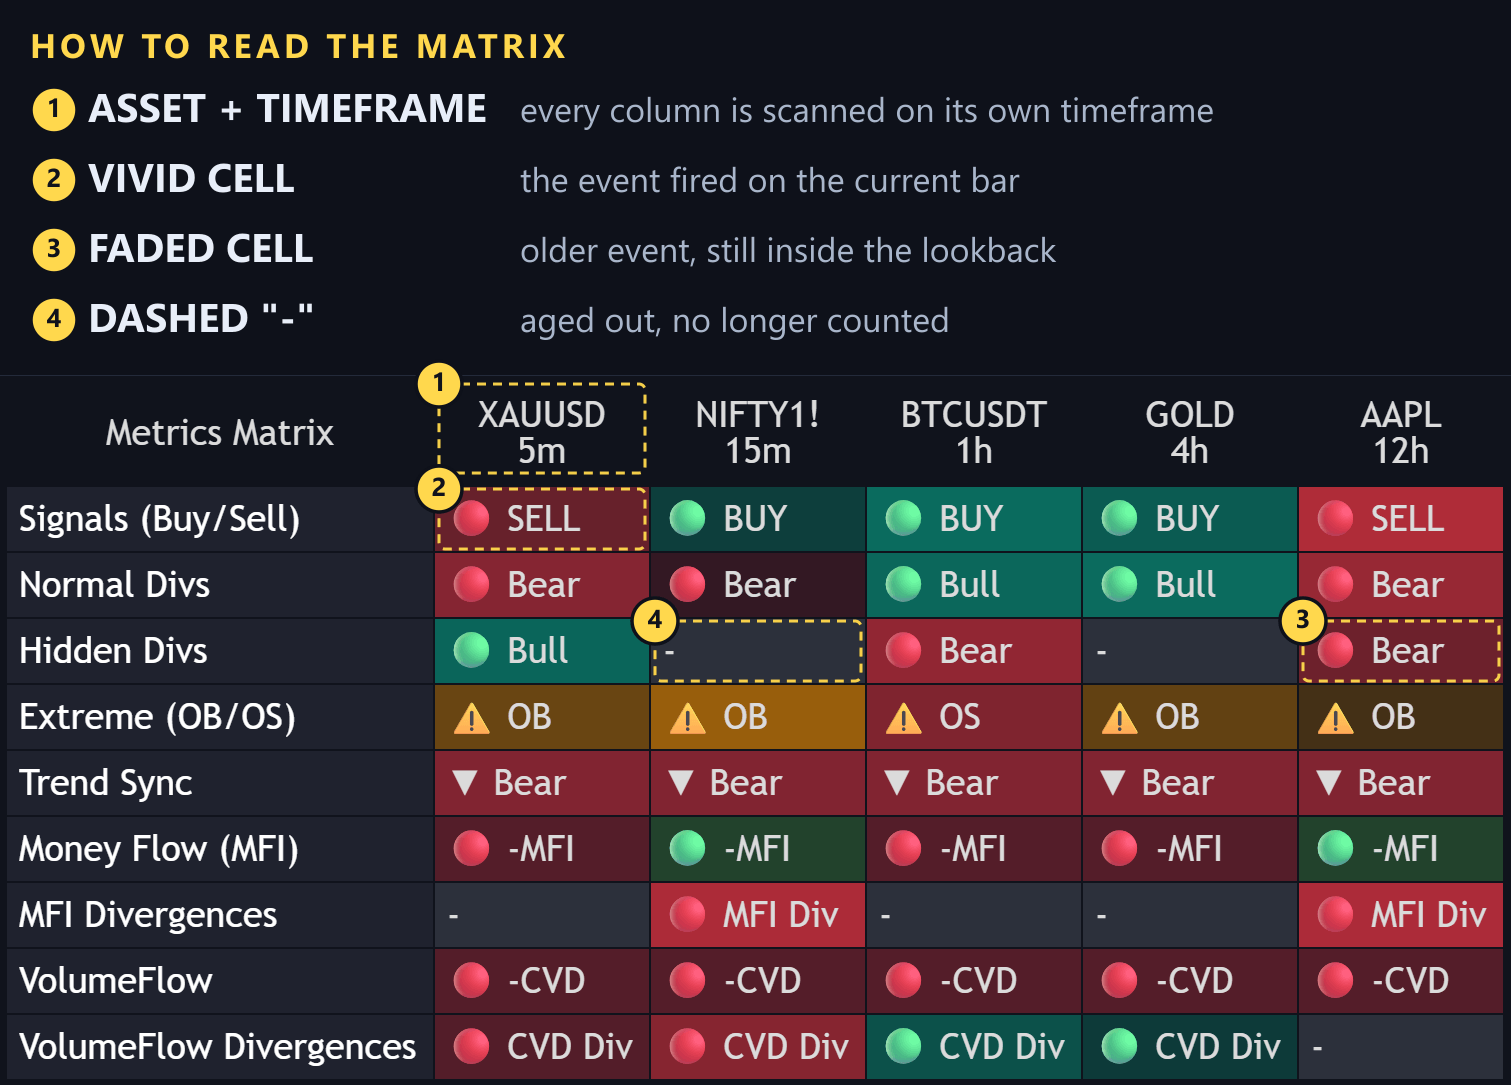
The metrics matrix: one column per asset with its own timeframe, nine readings deep
Nothing here is a price chart. The screener answers one question over and over: **where is the market overextended right now**, and how fresh is that reading.
## Two panels, one scan
* **Metrics matrix** — a table of assets against metrics, colour-coded, with the age of every signal in bars. It is documented below.
* **[Relative Rotation Graph](/screeners/nautilus-mean-reversion-screener/relative-rotation-graph)** — the same assets plotted by oscillator stretch and money flow, with a trail showing where each one came from.
The table tells you *what* fired. The graph tells you *where in the rotation* the asset sits. Reading them together is the point.
## The matrix
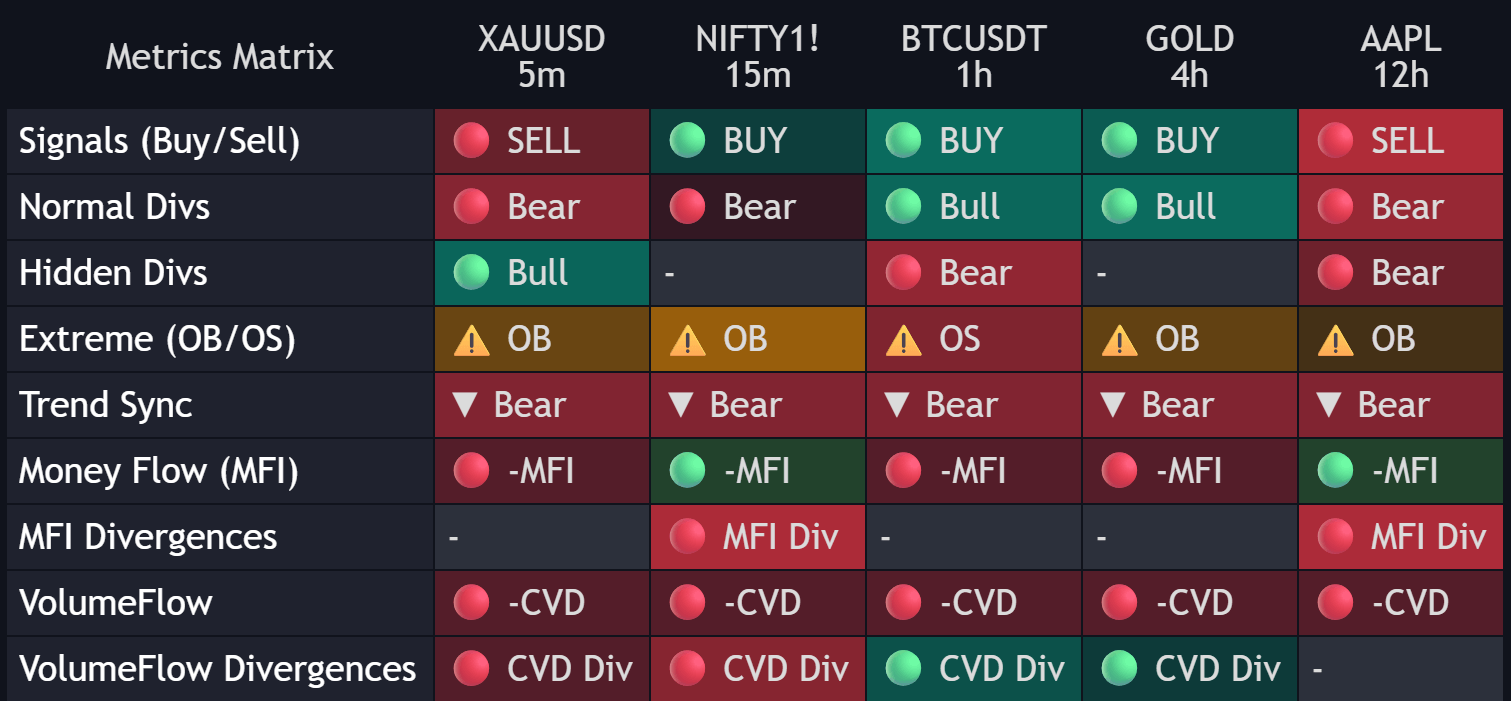
Each column is one asset, with its ticker and timeframe in the header. Each row is one metric, evaluated independently for every column — a one-day chart and a five-minute chart sit side by side without interfering.
Five asset columns against nine metric rows, every cell coloured by state and faded by age
### The columns
Because the header shows the timeframe, a `1 day` column and a `5 minutes` column never get confused — the same signal means something different on each. A column disappears entirely when its symbol slot is disabled.
### The rows
| Row | Shows |
| --- | --- |
| **[Signals (Buy/Sell)](/screeners/nautilus-mean-reversion-screener/nautilus-signals)** | The core mean reversion trigger for the selected preset |
| **[Normal Divs](/screeners/nautilus-mean-reversion-screener/divergences-and-extremes)** | A classic divergence between price and the oscillator |
| **[Hidden Divs](/screeners/nautilus-mean-reversion-screener/divergences-and-extremes)** | A continuation divergence inside a trend |
| **[Extreme (OB/OS)](/screeners/nautilus-mean-reversion-screener/divergences-and-extremes)** | The oscillator leaving overbought or oversold |
| **[Trend Sync](/screeners/nautilus-mean-reversion-screener/trend-sync)** | Whether the broader structural bias agrees |
| **[Money Flow (MFI)](/screeners/nautilus-mean-reversion-screener/money-flow-and-volume-flow)** | Inflow or outflow, with a `+` or `-` for expanding or cooling |
| **[MFI Divergences](/screeners/nautilus-mean-reversion-screener/money-flow-and-volume-flow)** | Price and money flow disagreeing |
| **[VolumeFlow](/screeners/nautilus-mean-reversion-screener/money-flow-and-volume-flow)** | Cumulative volume delta, aggressive buyers against sellers |
| **[VolumeFlow Divergences](/screeners/nautilus-mean-reversion-screener/money-flow-and-volume-flow)** | Price and delta disagreeing |
Every row can be switched off. See [Settings](/screeners/nautilus-mean-reversion-screener/settings).
## Reading the colours
Vivid means fresh — the signal fired on the current bar (`0` bars ago). As bars pass, the cell fades out, and when the age crosses the **Signals Lookback** it becomes `-`. Hovering a cell prints the exact bar count and the context, for example *Sell Signal detected 57 bars ago*.
So a bright column is a market that just moved. A faded column is history you can ignore.
## Layout
Three inputs shape the panel: **Display Screener** shows or hides it, **Position** moves it, and **Size** changes the text size so more columns fit in view. If the table overlaps your candles, change the position rather than moving your chart.
## How to use it
{% stepper %}
{% step %}
### Hunt for confluence
Look for a column where several cells light up at once — a Buy signal, a bullish Normal Div and a positive MFI on the same asset. That is the highest-probability mean reversion setup the screener can show.
{% endstep %}
{% step %}
### Watch the rotation
Open the Relative Rotation Graph and find the asset moving into **Improving**. Then check the table: if a fresh signal already fired on that asset, the turn is being confirmed rather than predicted.
{% endstep %}
{% step %}
### Spot exhaustion inside strength
An **Extreme (OB/OS)** trigger on an asset sitting in **Leading** is a trend that has run out of room. That is a pullback warning, not a reversal call.
{% endstep %}
{% step %}
### Let it scan
Tick the events in [Alert Settings](/screeners/nautilus-mean-reversion-screener/alerts) and step away. The alert fires on whichever asset trips first, and it carries the ticker, the timeframe and the price.
{% endstep %}
{% endstepper %}
## Setup
{% stepper %}
{% step %}
### Add the screener
Add **Nautilus Mean Reversion Screener [BigBeluga]** to any chart.
{% endstep %}
{% step %}
### Pick assets
Enable up to six slots and give each one a ticker and a timeframe. Mixing timeframes is encouraged — the screener handles them independently.
{% endstep %}
{% step %}
### Choose a preset
**Scalper**, **Day Trader** or **Swing Trader** recalibrates every engine at once. See [Settings](/screeners/nautilus-mean-reversion-screener/settings).
{% endstep %}
{% step %}
### Shape the panels
Position and size the table, and switch the Relative Rotation Graph on or off depending on how much room the chart has.
{% endstep %}
{% step %}
### Add alerts
Tick the events you care about in **Alert Settings**, then create a normal TradingView alert on the indicator.
{% endstep %}
{% endstepper %}
The Nautilus engines behind the rows are the same ones documented in the [Nautilus PRO+](/toolkits-pro-plus/nautilus-pro) toolkit, so the concept pages there explain what each reading means.