> For the complete documentation index, see [llms.txt](https://docs.bigbeluga.org/llms.txt). Markdown versions of documentation pages are available by appending `.md` to page URLs; this page is available as [Markdown](https://docs.bigbeluga.org/main-toolkits/nautilus-oscillator-pro-tm/volume-flow.md).
# Volume Flow
VolumeFlow (CVD) Histogram is a sub-pane technical indicator that visually maps the net institutional buying and selling pressure behind price action.
By converting raw Cumulative Volume Delta into a responsive oscillator, it reveals hidden accumulation and distribution phases that traditional volume bars completely miss.
#### How to Read VolumeFlow
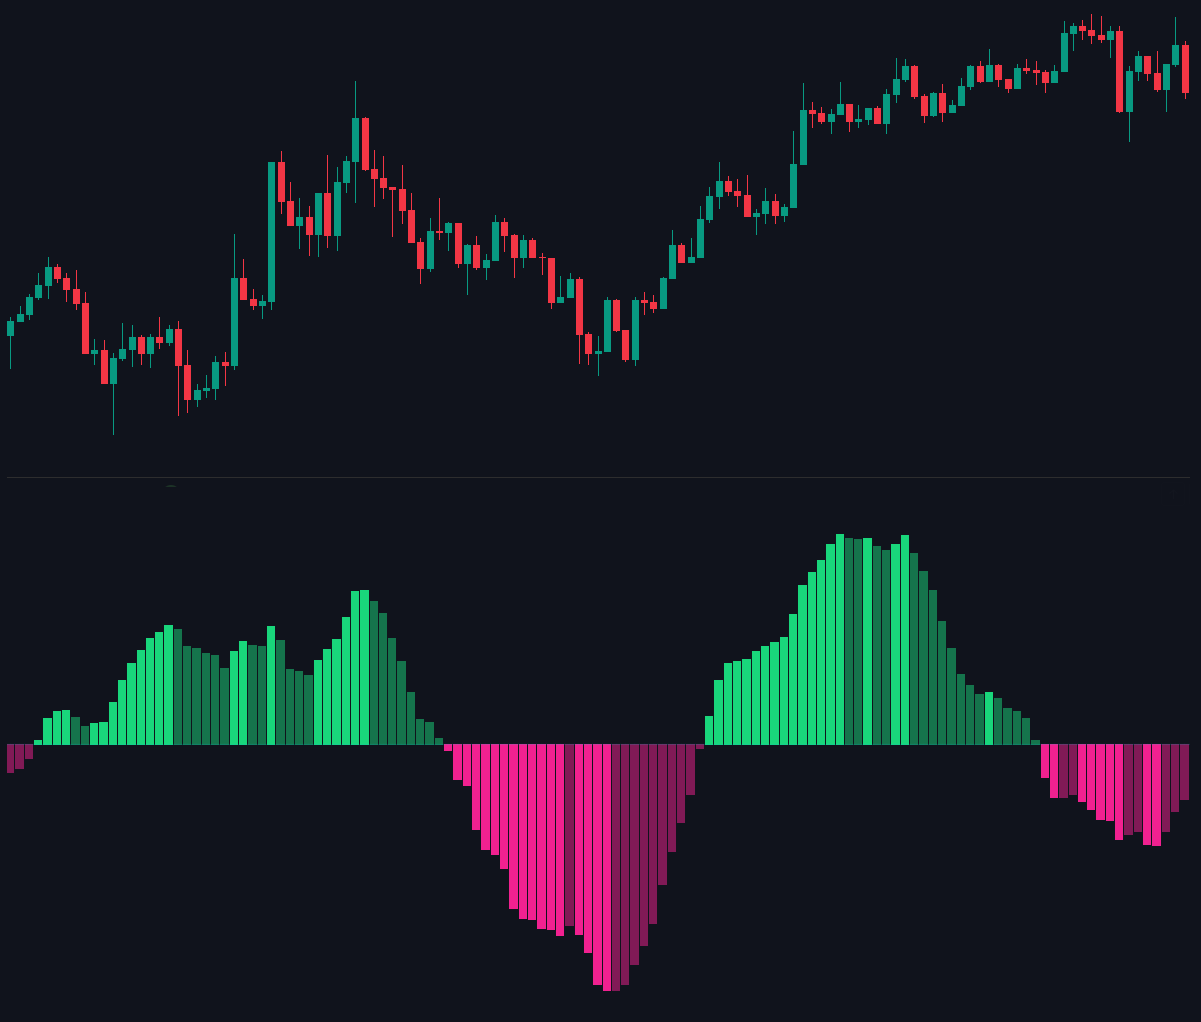
The indicator oscillates around a baseline, separating bullish and bearish control:
* Above 0 Line (Green Waves): Dominant aggressive buying pressure.
* Bright Green: Fast volume expansion; strong bullish momentum.
* Dark Green: Buying pressure is cooling off.
* Below 0 Line (Magenta Waves): Dominant aggressive selling pressure.
* Bright Magenta: Fast volume expansion; strong bearish momentum.
* Dark Magenta: Selling pressure is cooling off.
### Divergence
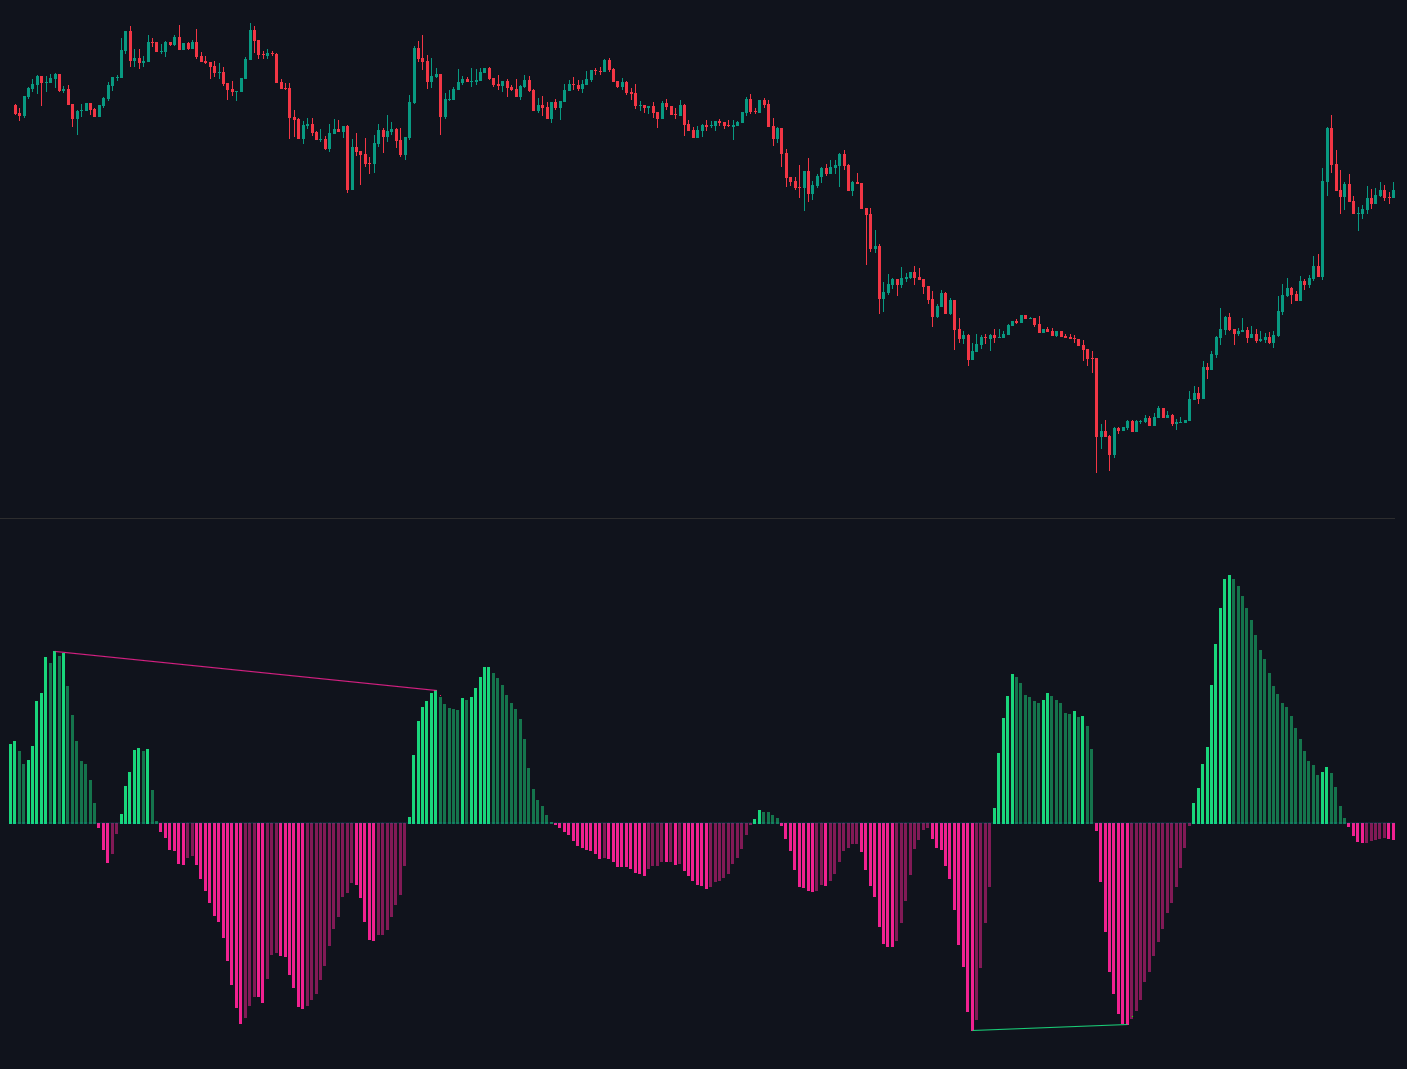
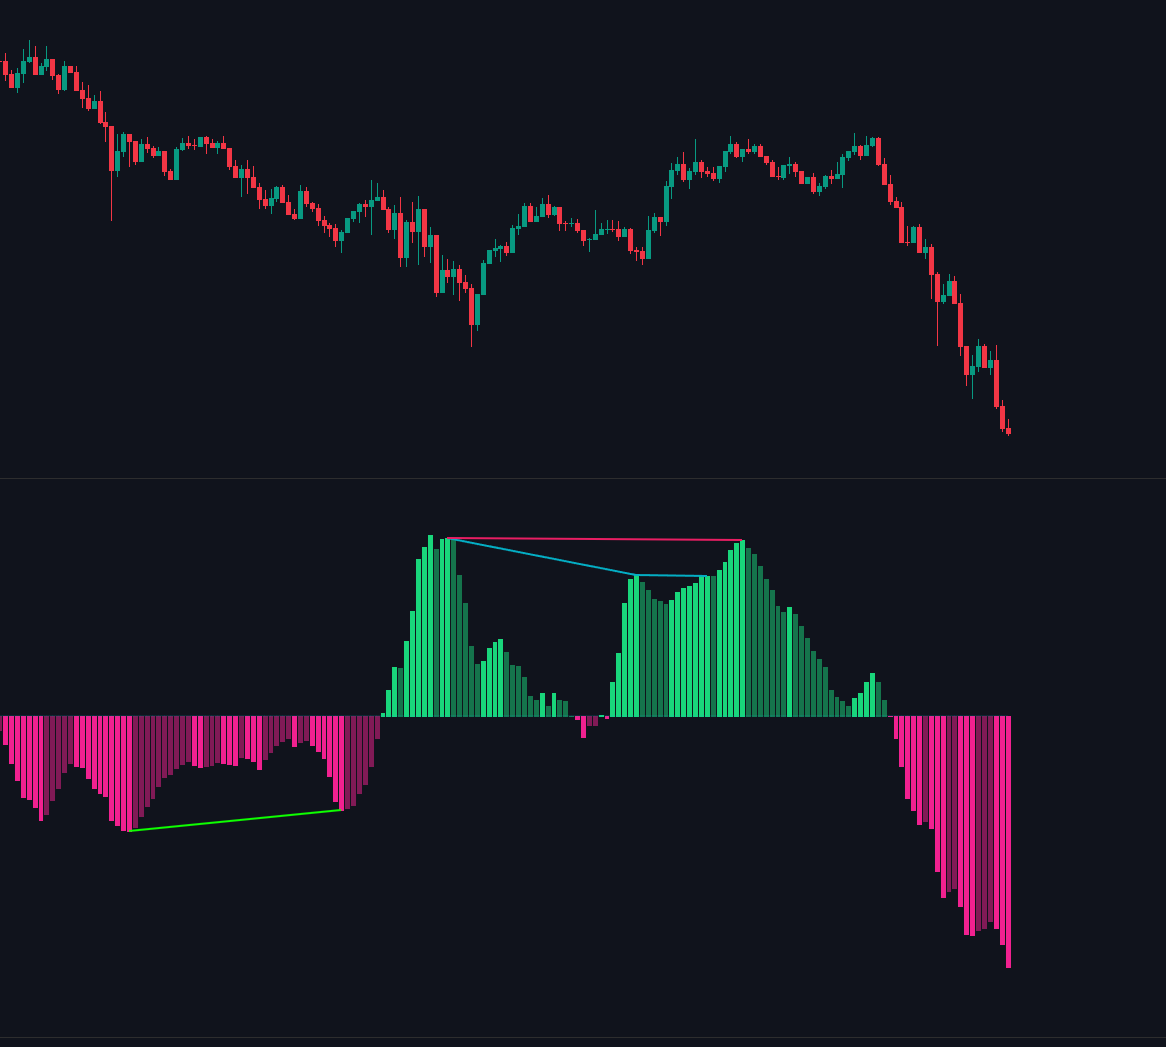
The system detects both bullish and bearish divergences between price and the VolumeFlow oscillator. Divergences highlight weakening momentum and potential reversal points.
#### Bearish Divergence
{% hint style="info" %}
Triggered when: Price forms a higher high, but VolumeFlow forms a lower high.
{% endhint %}
Interpretation:
* Buying pressure is fading even as price pushes higher.
* Suggests distribution or weakening bullish momentum.
* Often appears before short-term tops or trend pullbacks.
#### Bullish Divergence
{% hint style="info" %}
Triggered when: Price forms a lower low, but VolumeFlow forms a higher low.
{% endhint %}
Interpretation:
* Selling pressure is fading even as price pushes lower.
* Suggests accumulation or weakening bearish momentum.
* Often appears before short-term bottoms or trend reversals.
{% hint style="info" %}
These divergences are plotted visually on the oscillator, making it easy to identify momentum exhaustion zones.
{% endhint %}