> For the complete documentation index, see [llms.txt](https://docs.bigbeluga.org/llms.txt). Markdown versions of documentation pages are available by appending `.md` to page URLs; this page is available as [Markdown](https://docs.bigbeluga.org/main-toolkits/nautilus-oscillator-pro-tm/signals-dashboard.md).

# Signals Dashboard

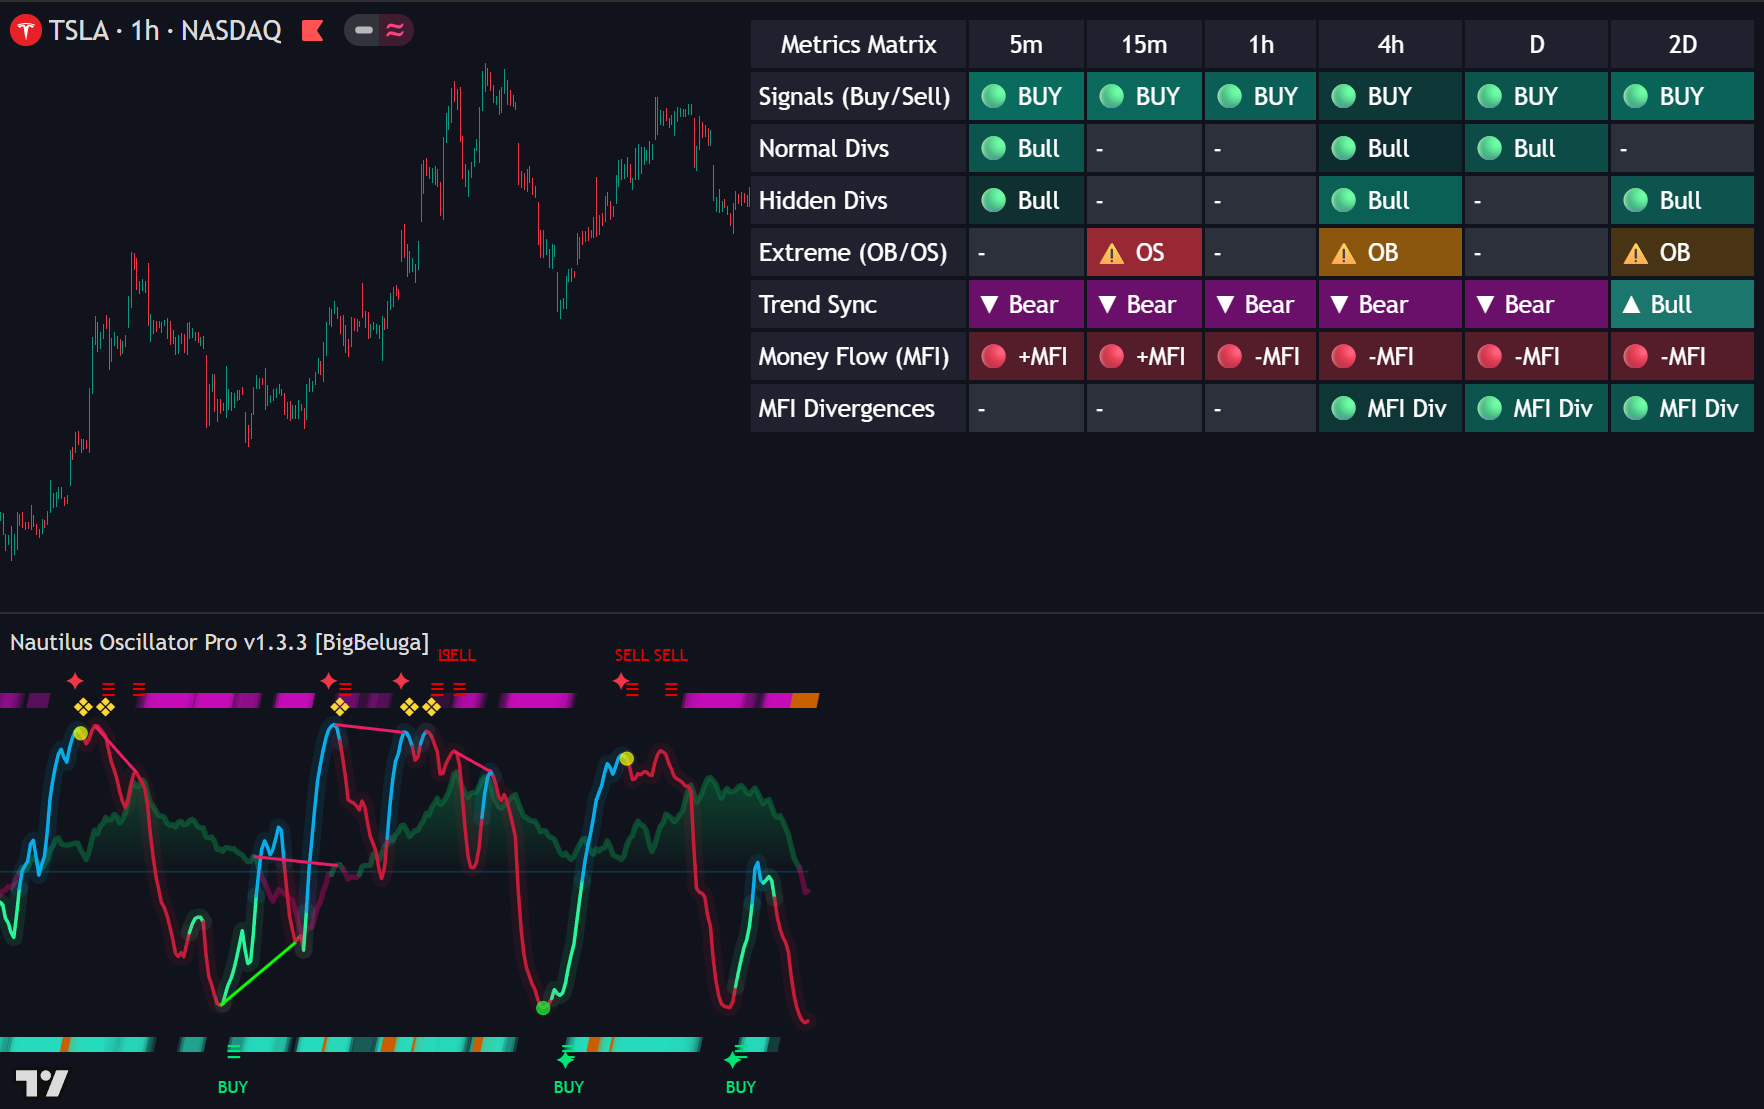
The Signals Dashboard is a powerful multi-timeframe panel that packs real-time data from the Nautilus core modules into a single, compact table.&#x20;

<figure><img src="/assets/8796389b8723f9f3f4c0075e08ff4132c316a460e4b99f6a07be67460ff3ce8c.png" alt=""><figcaption></figcaption></figure>

It allows you to track market conditions, momentum shifts, and reversal opportunities across up to six independent timeframes at once, eliminating the need to constantly flip through different charts.

## How It Works

Dashboard populates a dynamic grid containing essential trading metrics:

[Signals (Buy/Sell)](/main-toolkits/nautilus-oscillator-pro-tm/signals.md#buy-and-sell-signals): Displays active `BUY` or `SELL` signals.

<div align="left" data-with-frame="true"><figure><img src="/assets/d56eb38ae101503ae1b5b3938d264a637dcd005a3e290fb340b66d055836148f.png" alt="" width="253"><figcaption></figcaption></figure></div>

[Normal Divs](/main-toolkits/nautilus-oscillator-pro-tm/divergence-detection.md#normal-divergence): Highlights standard `BULL` or `BEAR` divergence alerts.

<div align="left" data-with-frame="true"><figure><img src="/assets/06f7f0624b9daa0274b45caef52e9a4bd54aec9a934bbba8e1c7e689ed752381.png" alt="" width="251"><figcaption></figcaption></figure></div>

[Hidden Divs](/main-toolkits/nautilus-oscillator-pro-tm/divergence-detection.md#hidden-divergence): Captures hidden continuation divergences.

<div align="left" data-with-frame="true"><figure><img src="/assets/740f085feb2174f1591d4f86463044b7b1842cfa1ec3d2c2eccb4755d7ff954b.png" alt="" width="345"><figcaption></figcaption></figure></div>

[Extreme (OB/OS)](/main-toolkits/nautilus-oscillator-pro-tm/signals.md#yellow-diamonds-overbought-and-oversold): Identifies extreme Overbought (OB) or Oversold (OS) territories.

<div align="left" data-with-frame="true"><figure><img src="/assets/d9c272004776047d5dd1970c5794e0b396d3cdfa94d374afa3366cb0f95ef799.png" alt="" width="427"><figcaption></figcaption></figure></div>

[Trend Sync](/main-toolkits/nautilus-oscillator-pro-tm/trendsync.md): Tracks overall market trend direction (`▲ Bull` / `▼ Bear`).

<div align="left" data-with-frame="true"><figure><img src="/assets/1c49bb11804275704dcdaaf7d858eceb139dd3cbab84ab59f07dc7ca31120335.png" alt=""><figcaption></figcaption></figure></div>

[The Money Flow (MFI) ](/main-toolkits/nautilus-oscillator-pro-tm/money-flow.md)row tracks volume-weighted capital flow across 4 distinct states based on its position relative to the zero line and its current direction (`+` for rising, `-` for declining).

<div align="left" data-with-frame="true"><figure><img src="/assets/cf895b8fd0a366657b666a9fe3bcfd035c3cf6d180f3ec5f5c20bfc99dff7080.png" alt="" width="563"><figcaption></figcaption></figure></div>

| **Label** | **MFI Value** | **Momentum** | **Context**                                           |
| --------- | ------------- | ------------ | ----------------------------------------------------- |
| 🟢 +MFI   | Above 0       | 📈 Rising    | Bullish Expansion: Strong capital inflow.             |
| 🟢 -MFI   | Above 0       | 📉 Declining | Bullish Slowdown: Positive flow, but cooling off.     |
| 🔴 +MFI   | Below 0       | 📈 Rising    | Bearish Slowdown: Negative flow, but pulling back up. |
| 🔴 -MFI   | Below 0       | 📉 Declining | Bearish Expansion: Strong capital outflow.            |

[MFI Divergences](/main-toolkits/nautilus-oscillator-pro-tm/money-flow.md#divergence): Tracks price-to-volume discrepancies directly on the dashboard, signaling potential market reversals when price action and volume-weighted capital flow disconnect.

<div align="left" data-with-frame="true"><figure><img src="/assets/d48bf2d0d84d977f7c056838defe2280bd2f288dab3f0ea6e78a7ff19712f279.png" alt=""><figcaption></figcaption></figure></div>

[VolumeFlow (CVD)](/main-toolkits/nautilus-oscillator-pro-tm/volume-flow.md): The VolumeFlow (CVD) row tracks cumulative volume delta across 4 distinct states based on its position relative to the zero line and its current direction ($$ $+$ $$ for rising/increasing cumulative buying volume, $$ $-$ $$ for declining/increasing cumulative selling volume).

<div align="left" data-with-frame="true"><figure><img src="/assets/817a82bbefc60260c095a21990305f2c9962b593bc638cb689ceb91b3c0a322f.png" alt=""><figcaption></figcaption></figure></div>

| **Label** | **CVD Value** | **Momentum** | **Context**                                                                       |
| --------- | ------------- | ------------ | --------------------------------------------------------------------------------- |
| 🟢 +CVD   | Above 0       | 📈 Rising    | Bullish Expansion: Strong volume inflow and aggressive market buying.             |
| 🟢 -CVD   | Above 0       | 📉 Declining | Bullish Slowdown: Positive volume delta, but buying pressure is cooling off.      |
| 🔴 +CVD   | Below 0       | 📈 Rising    | Bearish Slowdown: Negative volume delta, but selling pressure is pulling back up. |
| 🔴 -CVD   | Below 0       | 📉 Declining | Bearish Expansion: Strong volume outflow and aggressive market selling.           |

VolumeFlow Divergences: As shown in the dashboard layout, VolumeFlow Divergences track price-to-volume discrepancies directly on the dashboard. This signals potential market reversals when price action and cumulative volume flow disconnect (e.g., price making a higher high while CVD makes a lower high).

**1. Lookback Buffer**

To keep your charts clean and highly relevant, the dashboard only displays active signals that have occurred within a user-defined lookback window. If a signal is older than the configured buffer limit, it is automatically filtered out and replaced with a neutral dash (`-`).

<div align="left" data-with-frame="true"><figure><img src="/assets/ee68d6c5227869fe538260332017d0b778ec27c19377b4009cd7b11118cb9b0c.png" alt=""><figcaption></figcaption></figure></div>

**2. Hover Tooltips**

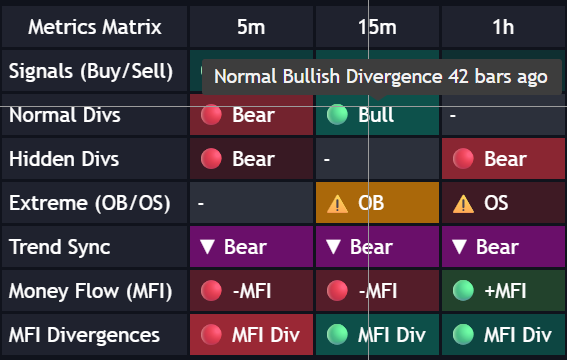
Hovering your mouse cursor over any filled data cell reveals an on-screen tooltip showing:

<div align="left" data-with-frame="true"><figure><img src="/assets/e350a2eee24b7f8742a02f32b10bbb649d3e3ac78ac6846a7897f0262d546dc1.png" alt=""><figcaption></figcaption></figure></div>

## Settings

<div align="left" data-with-frame="true"><figure><img src="/assets/b4035360e5efe4b7c86e1e6896a5207ffeb4652eece1f38f2c1131c7955234cc.png" alt="" width="485"><figcaption></figcaption></figure></div>

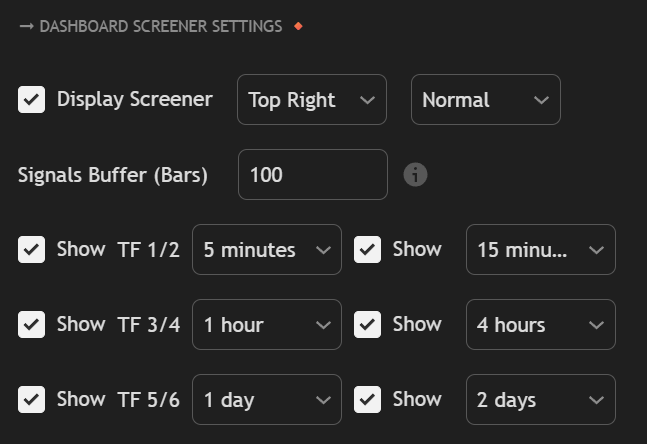
* Display Screener: Toggle the checkbox to turn the dashboard on or off. Use the dropdowns to adjust its screen position (e.g., Top Right) and visual scaling/size (e.g., Normal).
* Signals Buffer (Bars): Defines the maximum lookback window for tracking triggers. For example, setting this to `100` means a signal will only appear on the dashboard if it occurred within the last 100 bars.
* Show TF 1/2 to 5/6: Check the boxes to enable up to six independent multi-timeframe columns simultaneously. Each dropdown lets you map a custom timeframe (from intraday choices like 5 minutes up to macro intervals like 2 days).