> For the complete documentation index, see [llms.txt](https://docs.bigbeluga.org/llms.txt). Markdown versions of documentation pages are available by appending `.md` to page URLs; this page is available as [Markdown](https://docs.bigbeluga.org/main-toolkits/market-waves-pro-tm/market-dashboard.md).
# Market Dashboard
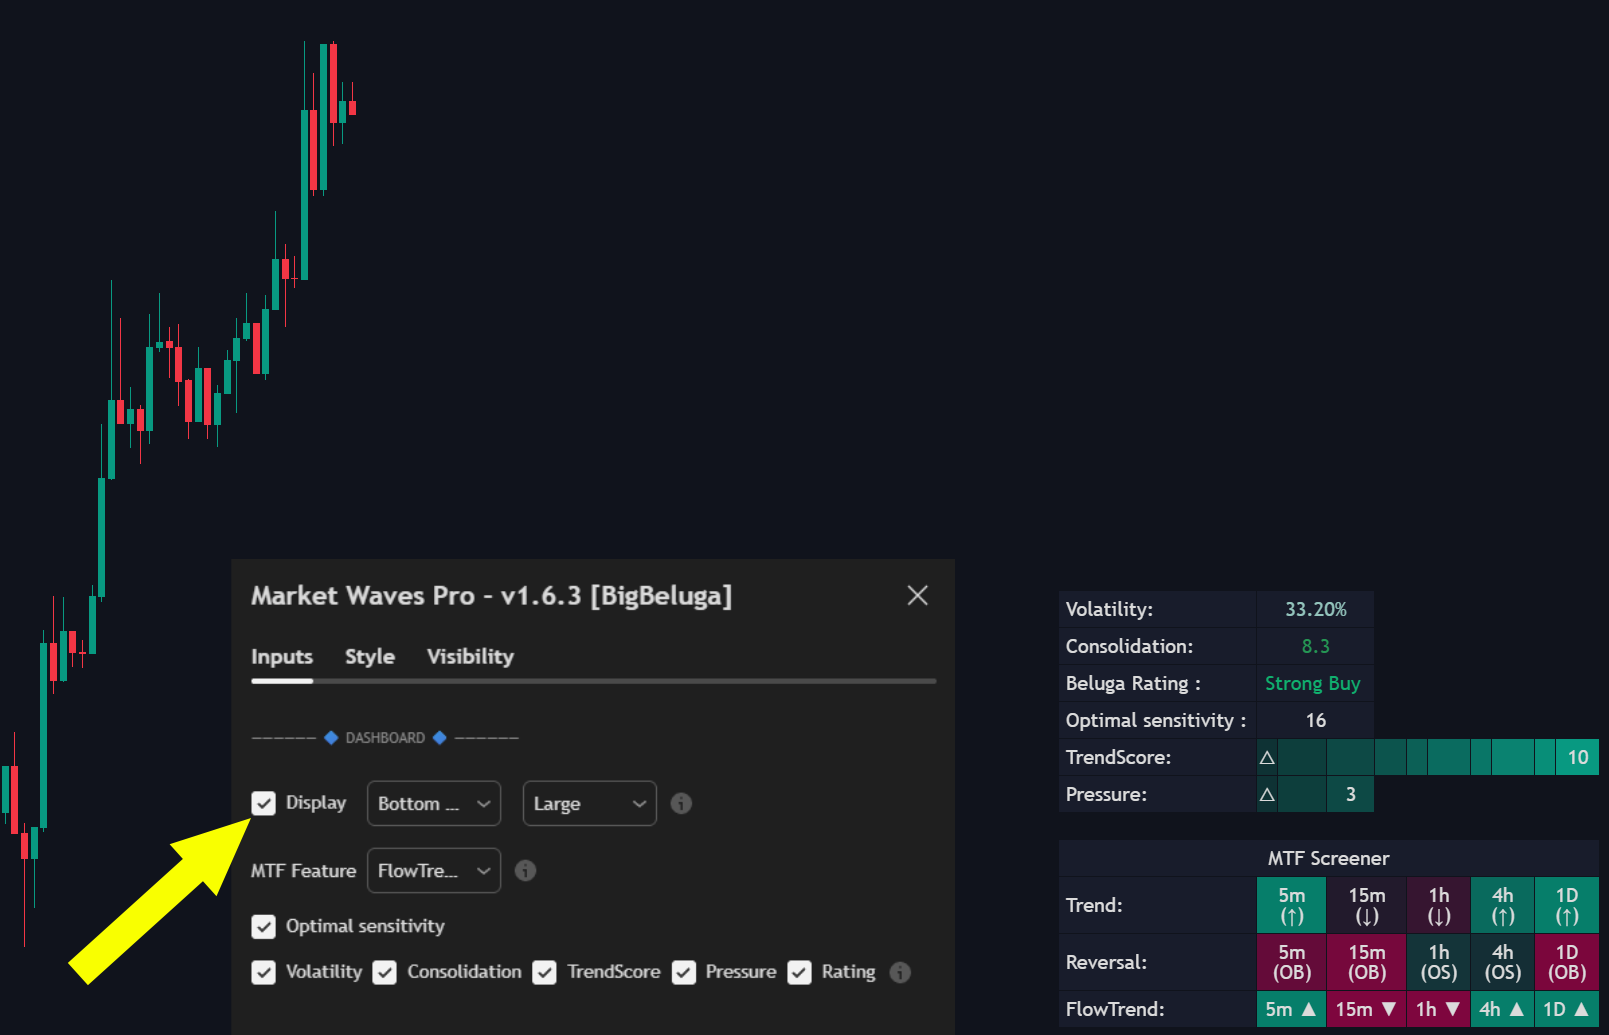
The dashboard provides a comprehensive view of market dynamics, assisting traders in assessing real-time conditions.
Each metric offers a precise quantification of key market characteristics, facilitating well-informed trading decisions.
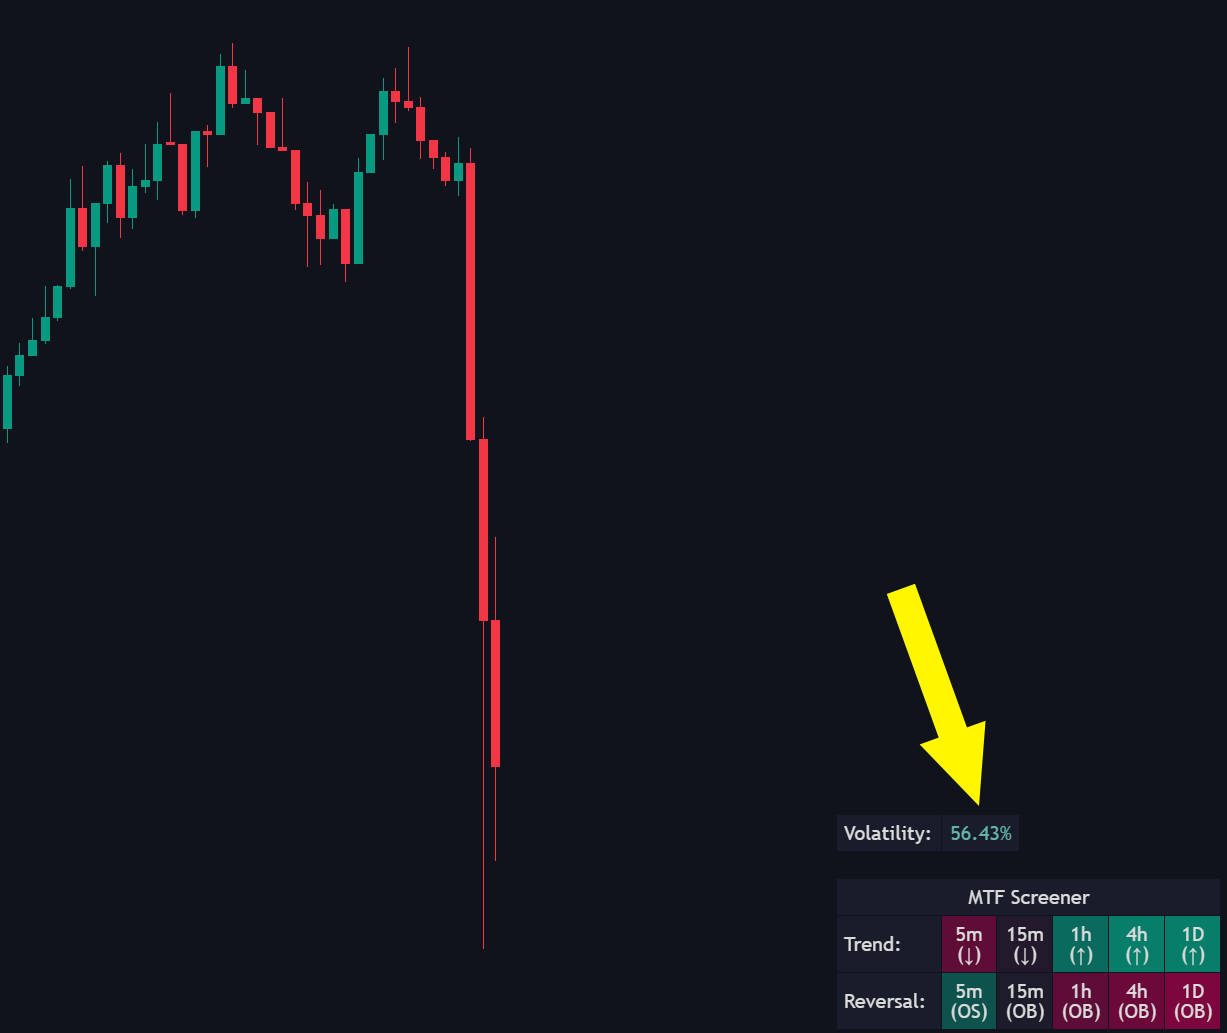
## **Volatility**
Displays the percentage of current market volatility, ranging from 0% (calm) to 100% (extremely volatile), indicating the level of price activity.
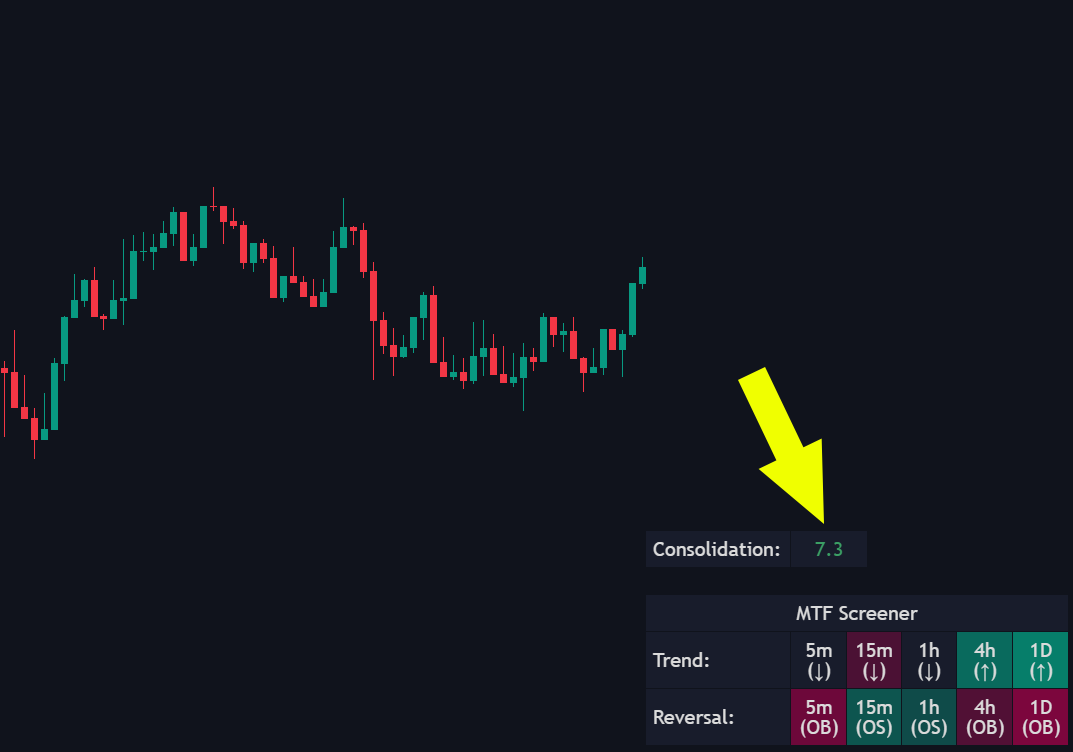
## **Consolidation**
Quantifies the degree of price compression or range-bound movement on a scale of 0 to 10, where higher values signal tighter consolidation.
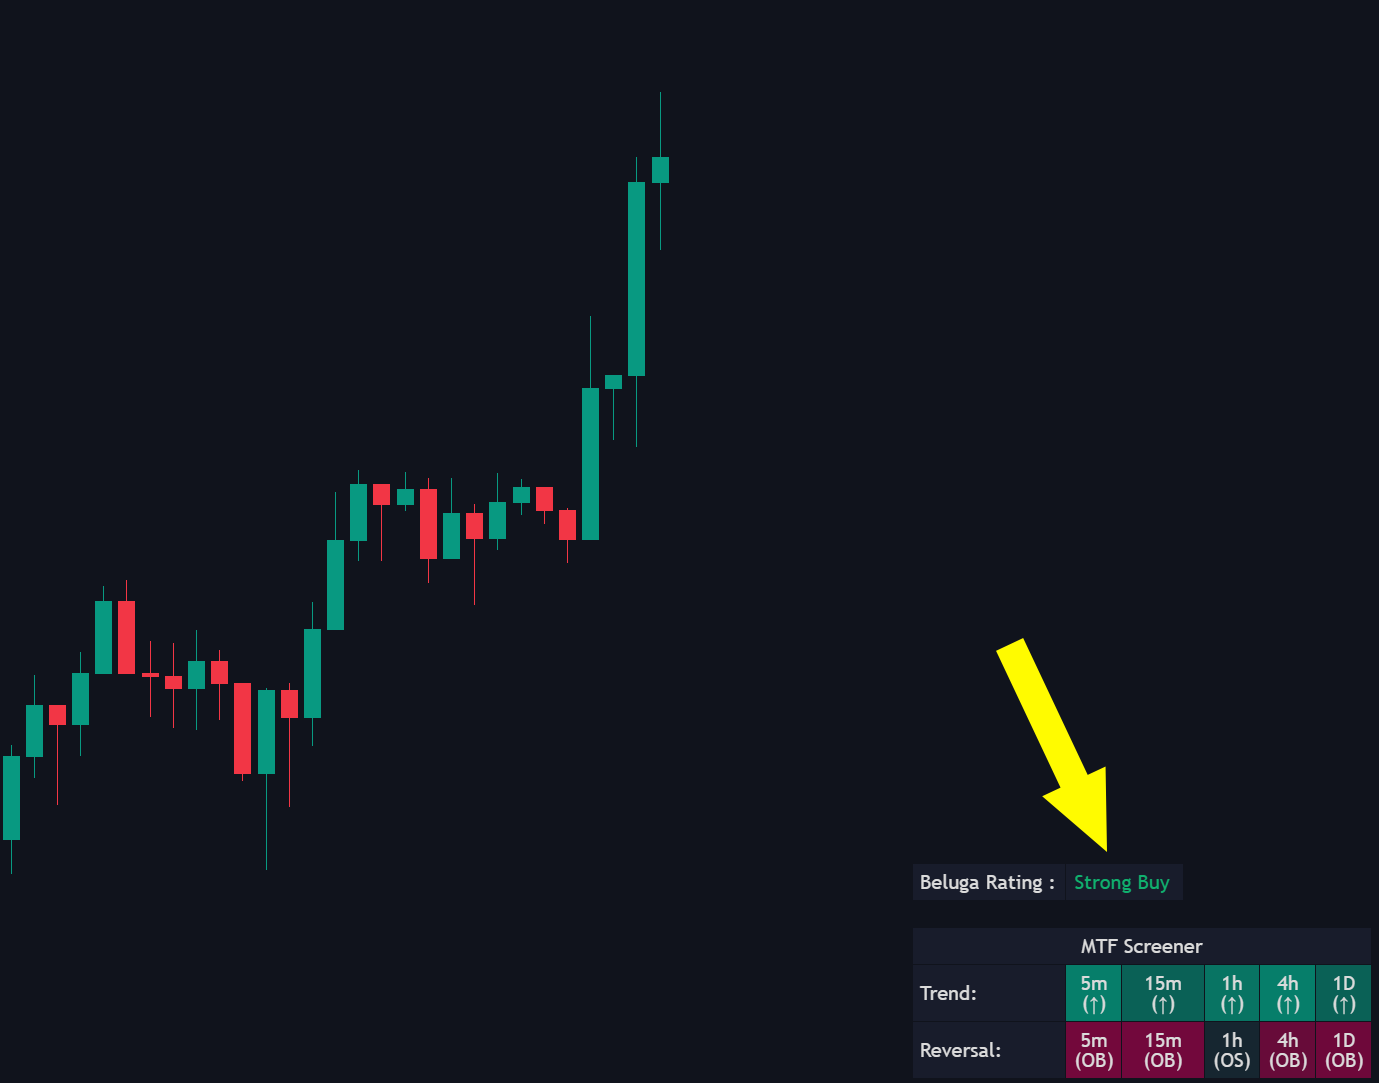
## Beluga Rating
The BigBeluga Rating is a real-time technical sentiment tool that analyzes multiple built-in indicators to classify market bias into five intuitive states: **Strong Buy**, **Buy**, **Neutral**, **Sell**, and **Strong Sell**.
{% hint style="info" %}
It combines insights multiple technical indicators into one simplified rating, helping traders quickly understand the overall technical outlook without needing to review each signal individually.
{% endhint %}
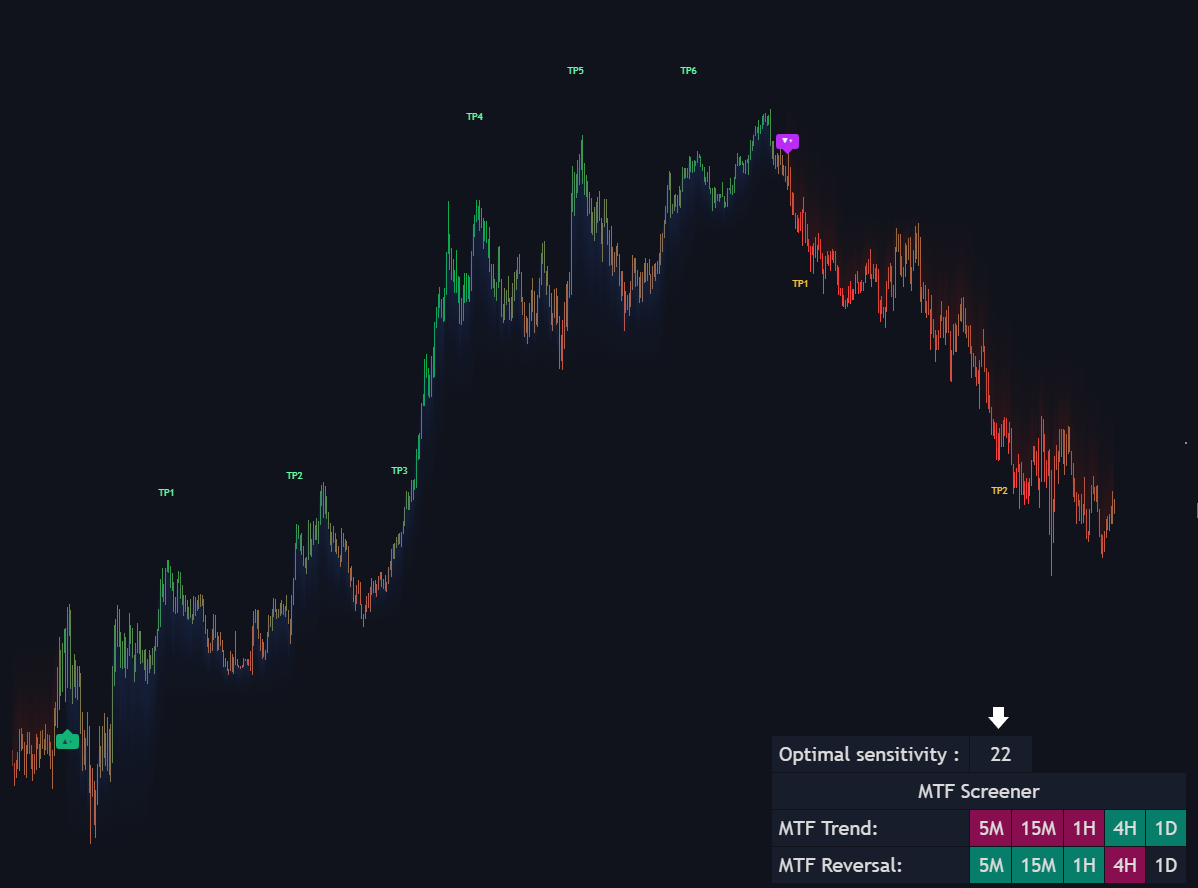
## **Optimal Sensitivity Display**
The Optimal Sensitivity Display is a new feature added to the dashboard when [Auto Optimization](/main-toolkits/market-waves-pro-tm/trend-signals.md#auto-optimization) is enabled in Market Waves Pro.
It shows the exact sensitivity value that Auto Optimization has determined to be most effective based on recent market performance of [Trend Signals feature](/main-toolkits/market-waves-pro-tm/trend-signals.md).
{% hint style="success" %}
The Optimal Sensitivity value now appears directly in the dashboard panel. This allows users to:
* the best-performing signal sensitivity setting in real-time.
* Manually input this value into the "Signals" field if they want to lock it in.
* Turn off Auto Optimization and use this value to ensure alerts remain consistent over time.
{% endhint %}
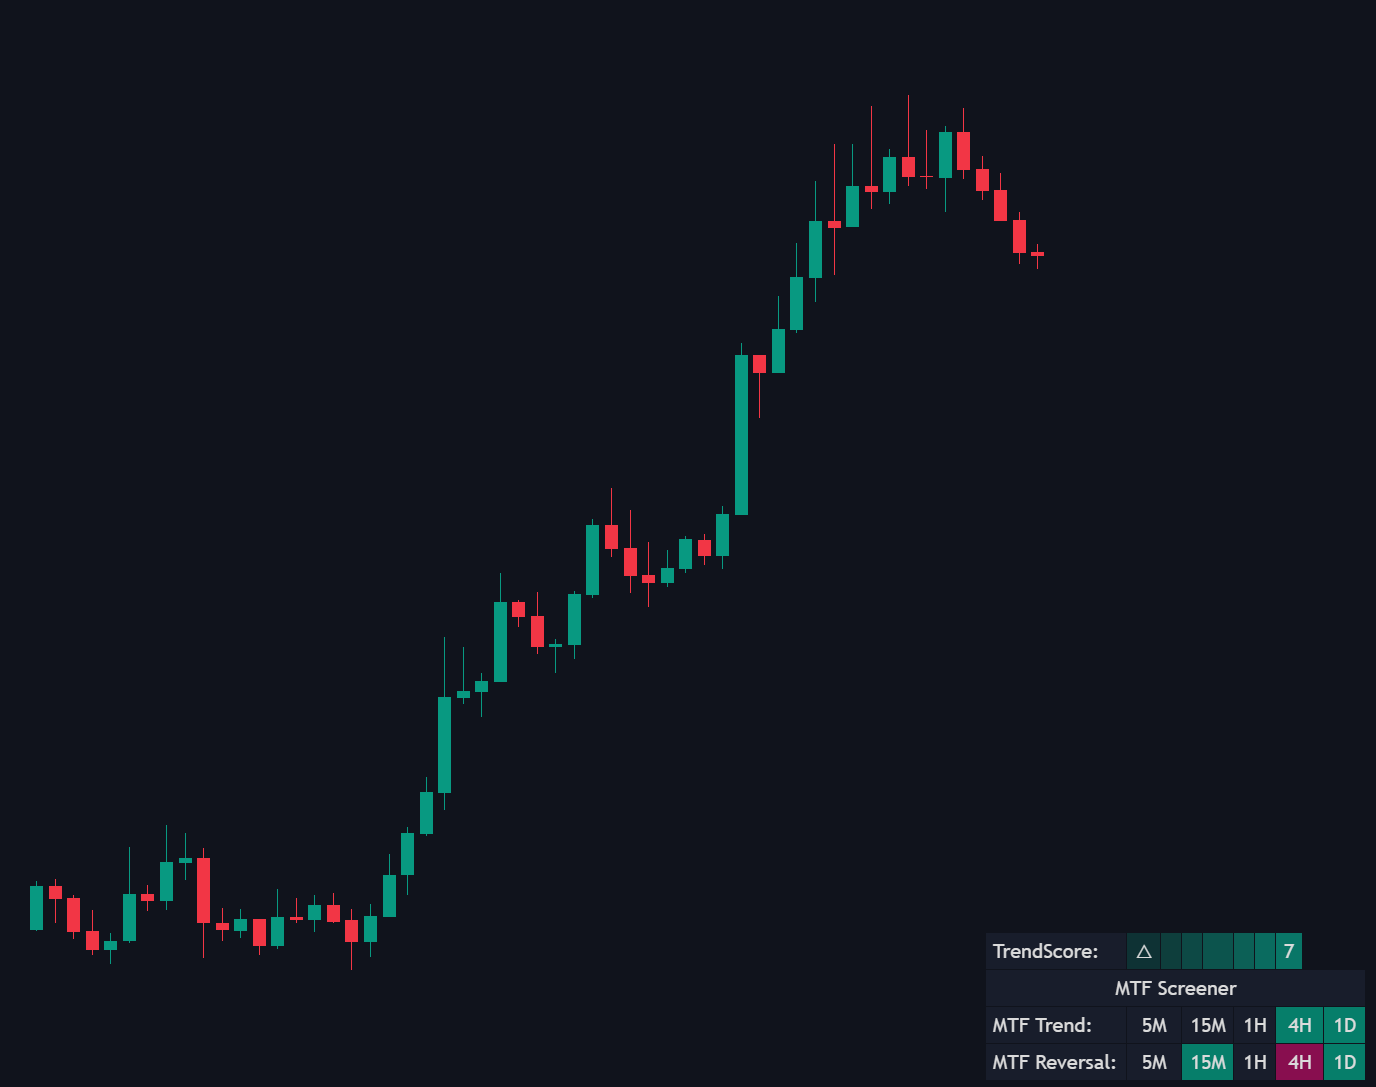
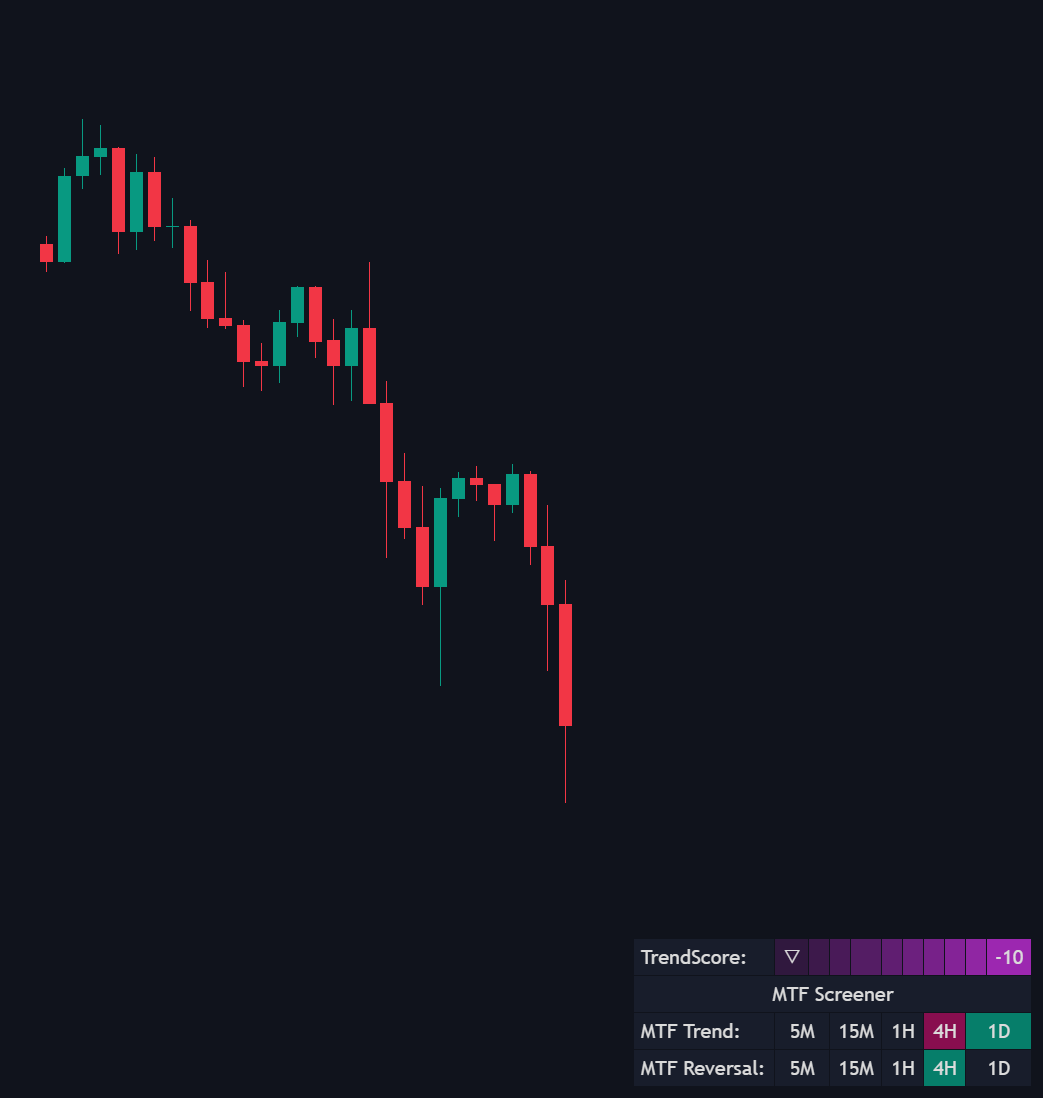
## **Trend Score**
Represents the strength of the current market trend, with values ranging from -10 (strong bearish trend) to +10 (strong bullish trend). A neutral or ranging market shows as a gray cell with a wave symbol.
Trendscore Up Trend
TrendScore Down Trend
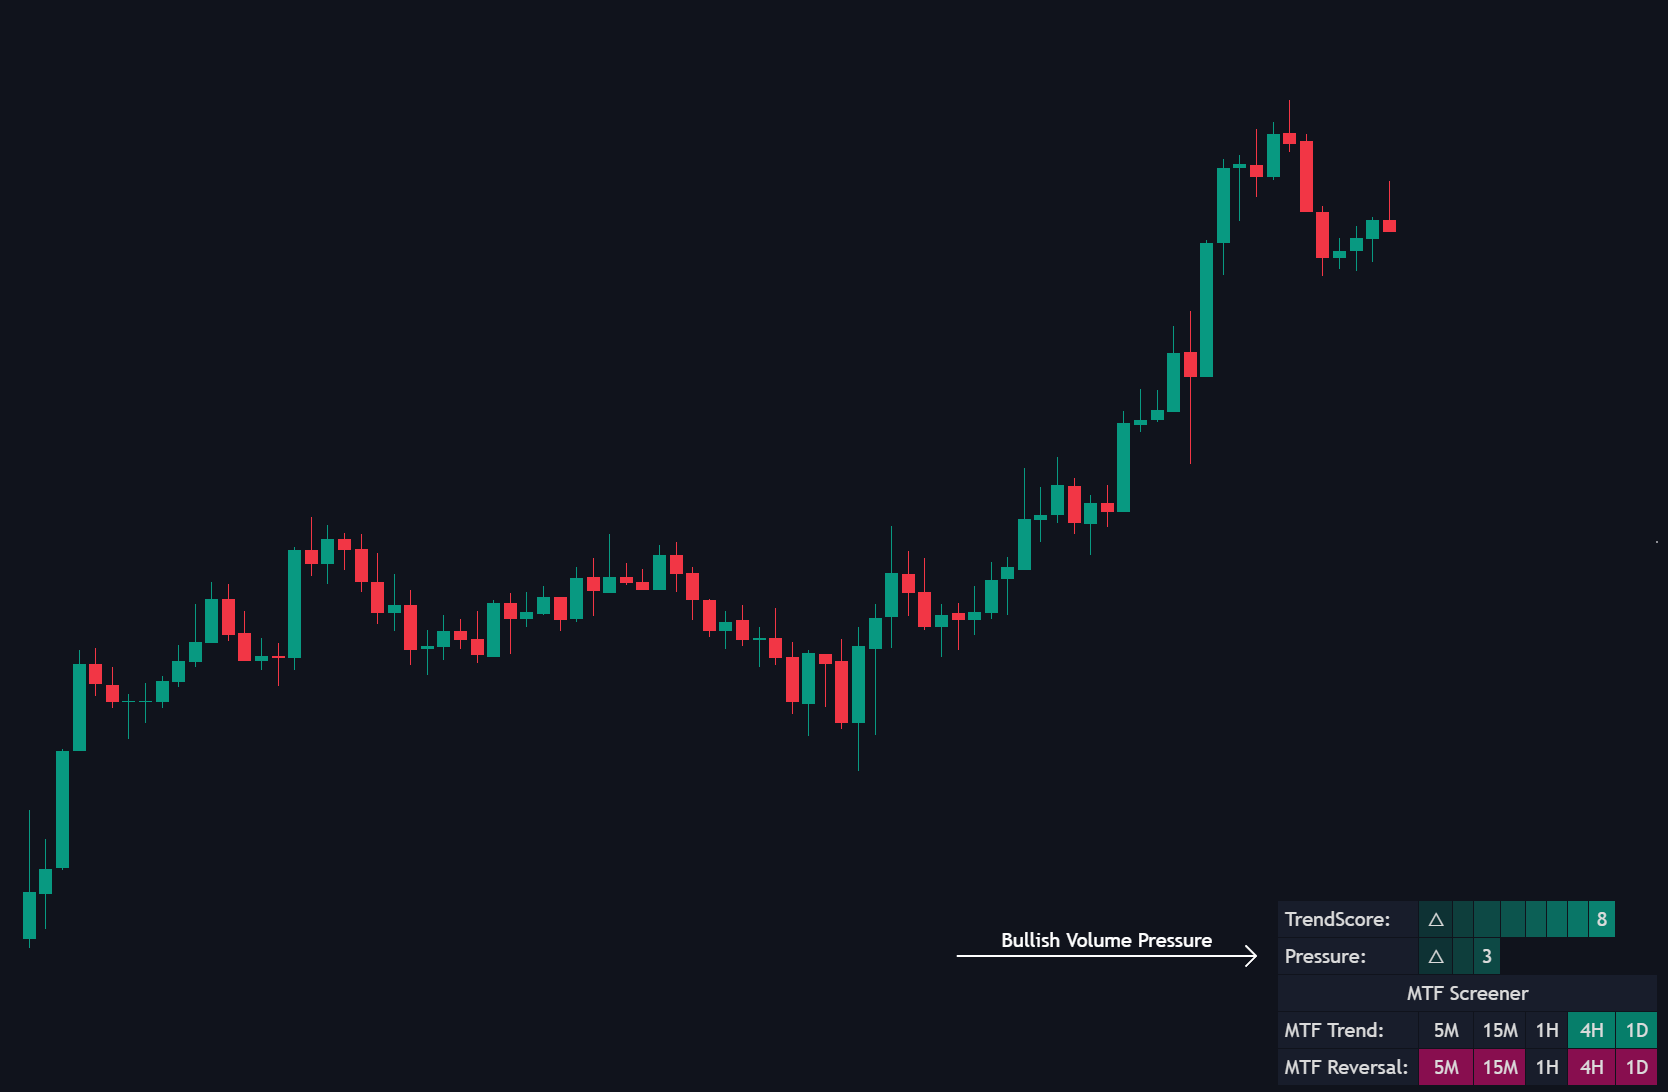
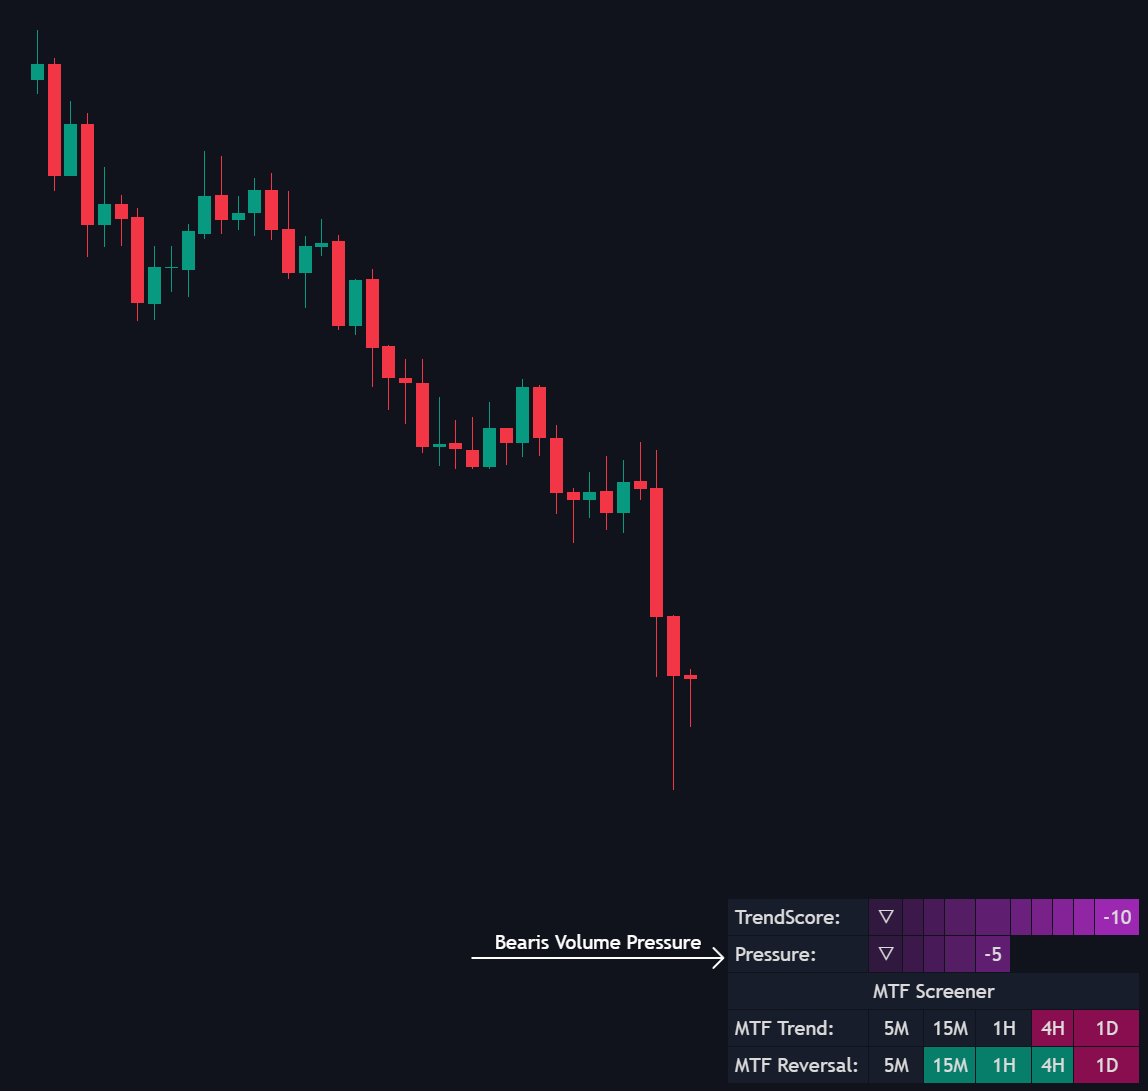
## **Pressure**
Volume Pressure calculates the net difference between aggressive buying and selling, but only during confirmed trending conditions.
Bullish Pressure During Up Trend
Bearish Pressure During Down Trend
{% hint style="info" %}
Reflects the delta volume pressure of buying versus selling activity on a scale of -10 (dominant selling) to +10 (dominant buying). A zero value appears as a gray cell with a wave, signaling indecision or a balanced market.
{% endhint %}
##
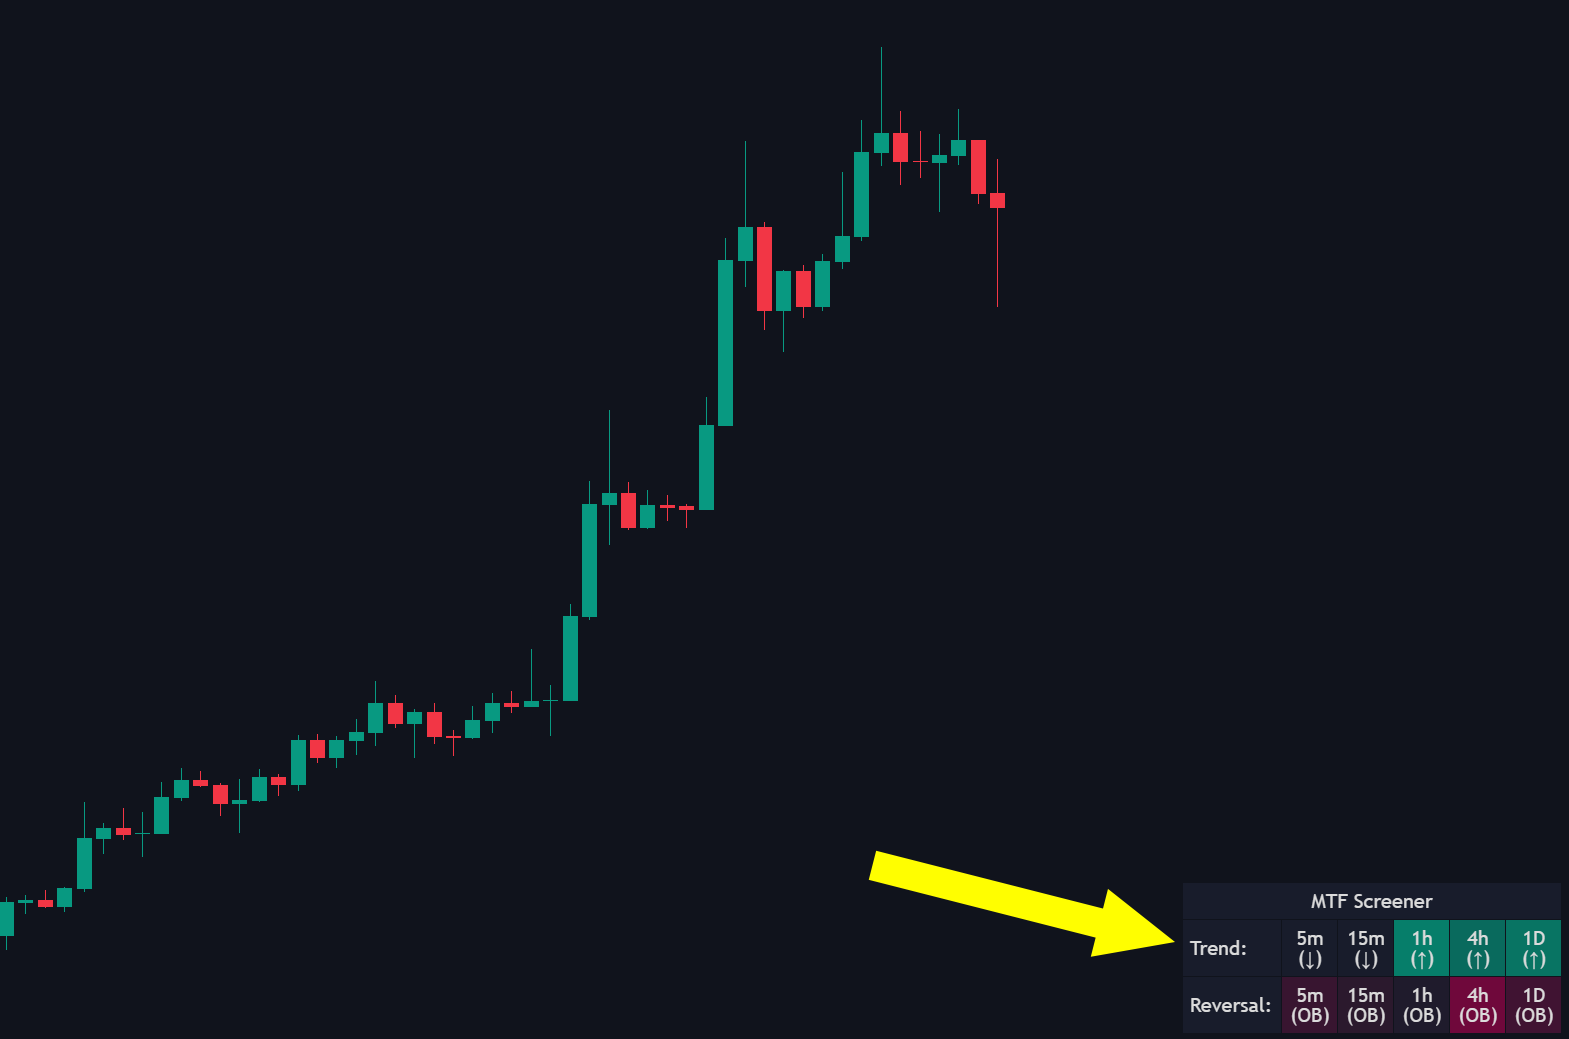
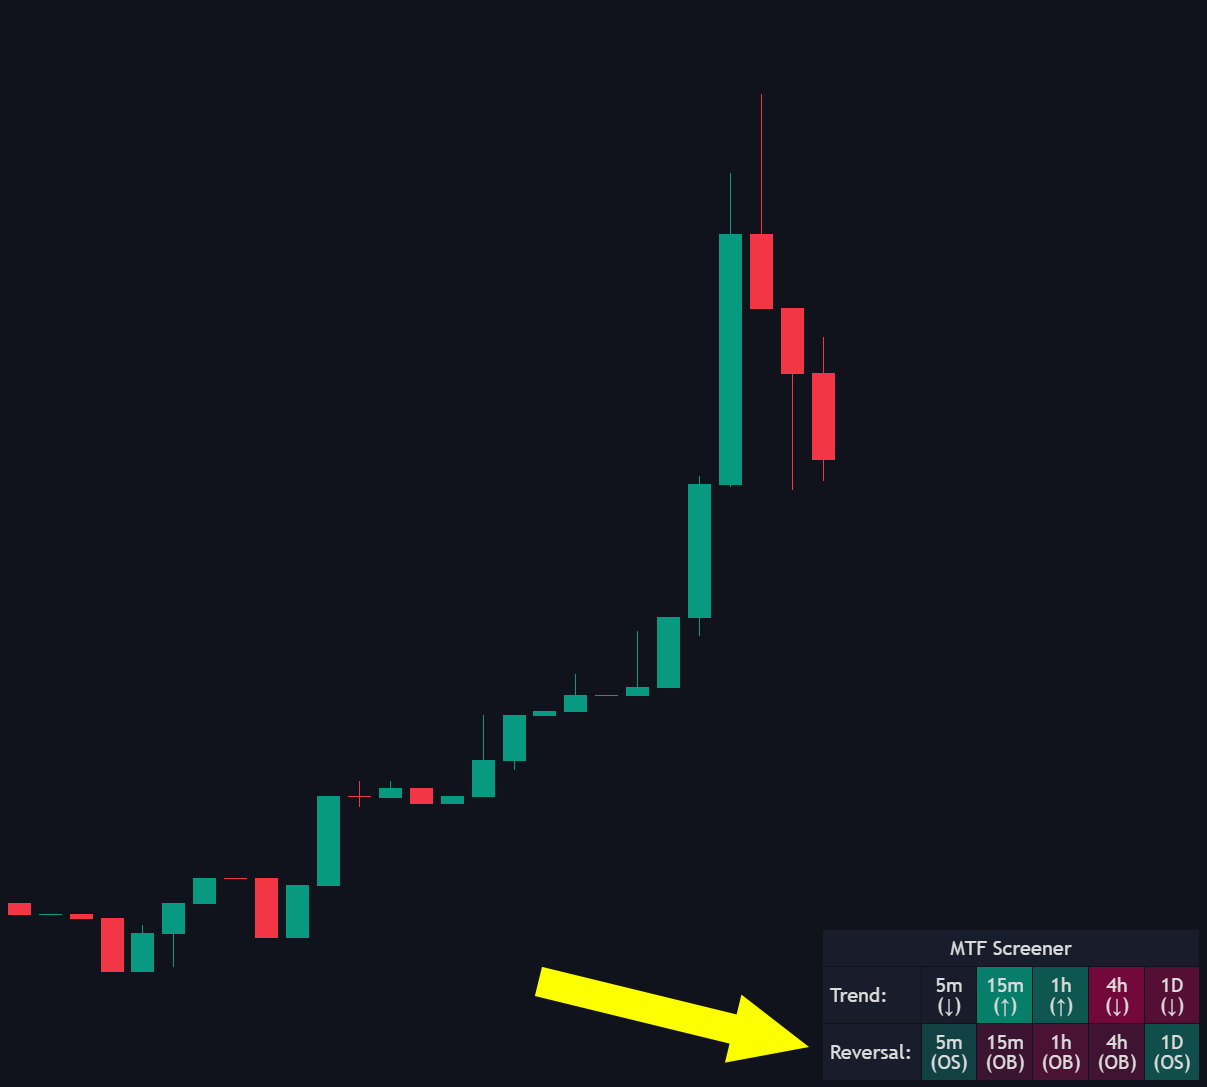
## **Multi Timeframe Screener**
#### **MTF Trend**:
Monitors trend direction across multiple timeframes (e.g., 5M, 15M, 1H, 4H, 1D). Green indicates a bullish trend, red signifies bearishness.
#### **MTF Reversal**:
Detects potential market reversals across timeframes. Green cells indicate upward reversal potential, while red cells point to downward reversal likelihood.
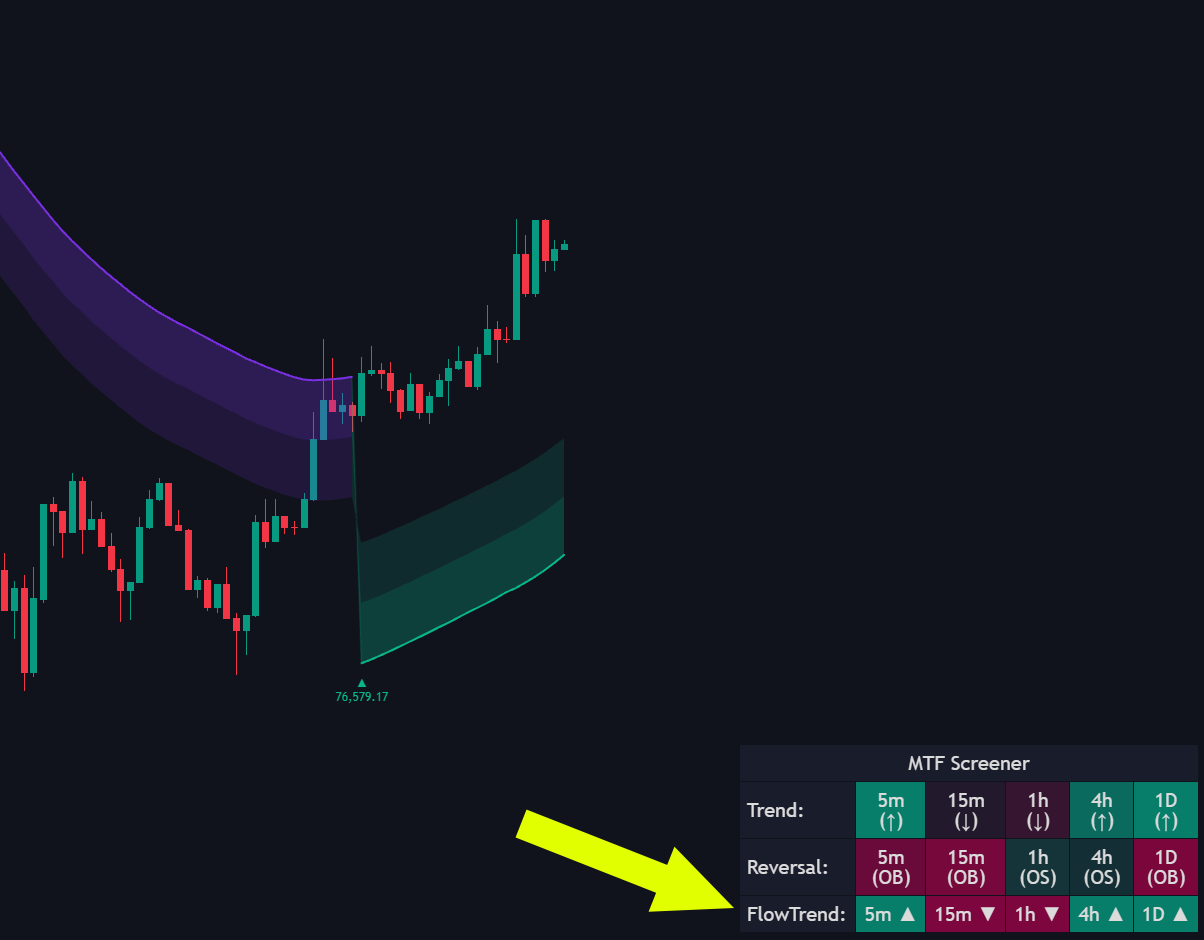
### MTF Feature Selection
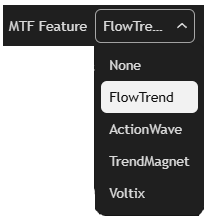
The MTF Feature dropdown allows you to customize the bottom row of your Multi-Timeframe Screener by selecting a specific toolkit component to track.
Customizable Logic: Choose between FlowTrend, ActionWave, TrendMagnet, or Voltix to monitor their real-time status across all timeframes.
{% hint style="info" %}
MTF Dashboard: Dynamic Timeframe Scaling Matrix
The multi-timeframe dashboard automatically adjusts its displayed rows based on the active chart's resolution:
* Seconds Charts (< 60s): Scales from 1s up to 1m (1S, 5S, 15S, 45S, 1m)
* 1-Minute Chart (== 60s): Scales from 5m up to 30m (5m, 10m, 15m, 20m, 30m)
* Short Intraday (<= 5m): 5m, 15m, 45m, 1h, 2h
* Medium Intraday (<= 10m): 5m, 15m, 1h, 2h, 3h
* Higher Intraday (<= 30m): 5m, 15m, 1h, 4h, 12h
* Standard / Higher Charts (> 30m): Defaults to 5m, 15m, 1h, 4h, 1D
{% endhint %}
## Settings
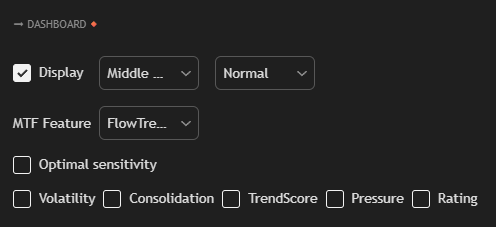
A master toggle to show or hide the dashboard on your chart.
Includes position (e.g., Middle Right) and size (Small, Normal, Large) dropdowns.
|
| MTF Features | A dropdown menu that allows you to select a specific toolkit feature—such as FlowTrend, ActionWave, TrendMagnet, or Voltix—to be displayed as a dedicated row in the MTF Screener. |
| Optimal Sensitivity | **S**hows the exact sensitivity value that Auto Optimization has determined to be most effective based on recent market performance. |
| Volatility | Helps traders identify whether the market is active enough to execute momentum strategies or quiet enough for range-bound approaches. |
| Consolidation | Assists in spotting periods of low volatility that often precede significant price breakouts, enabling proactive strategy adjustments. |
| Trend Score | Guides directional trades. High positive values suggest buying opportunities, while negative values favor selling. |
| Pressure | Provides insights into the strength of buyer or seller dominance within a trend. |
| Rating | (BigBeluga Rating) Quickly aligns traders with market sentiment using Strong Buy, Buy, Neutral, Sell, or Strong Sell ratings. |