> For the complete documentation index, see [llms.txt](https://docs.bigbeluga.org/llms.txt). Markdown versions of documentation pages are available by appending `.md` to page URLs; this page is available as [Markdown](https://docs.bigbeluga.org/main-toolkits/market-waves-pro-tm/flow-trend.md).
# Flow Trend
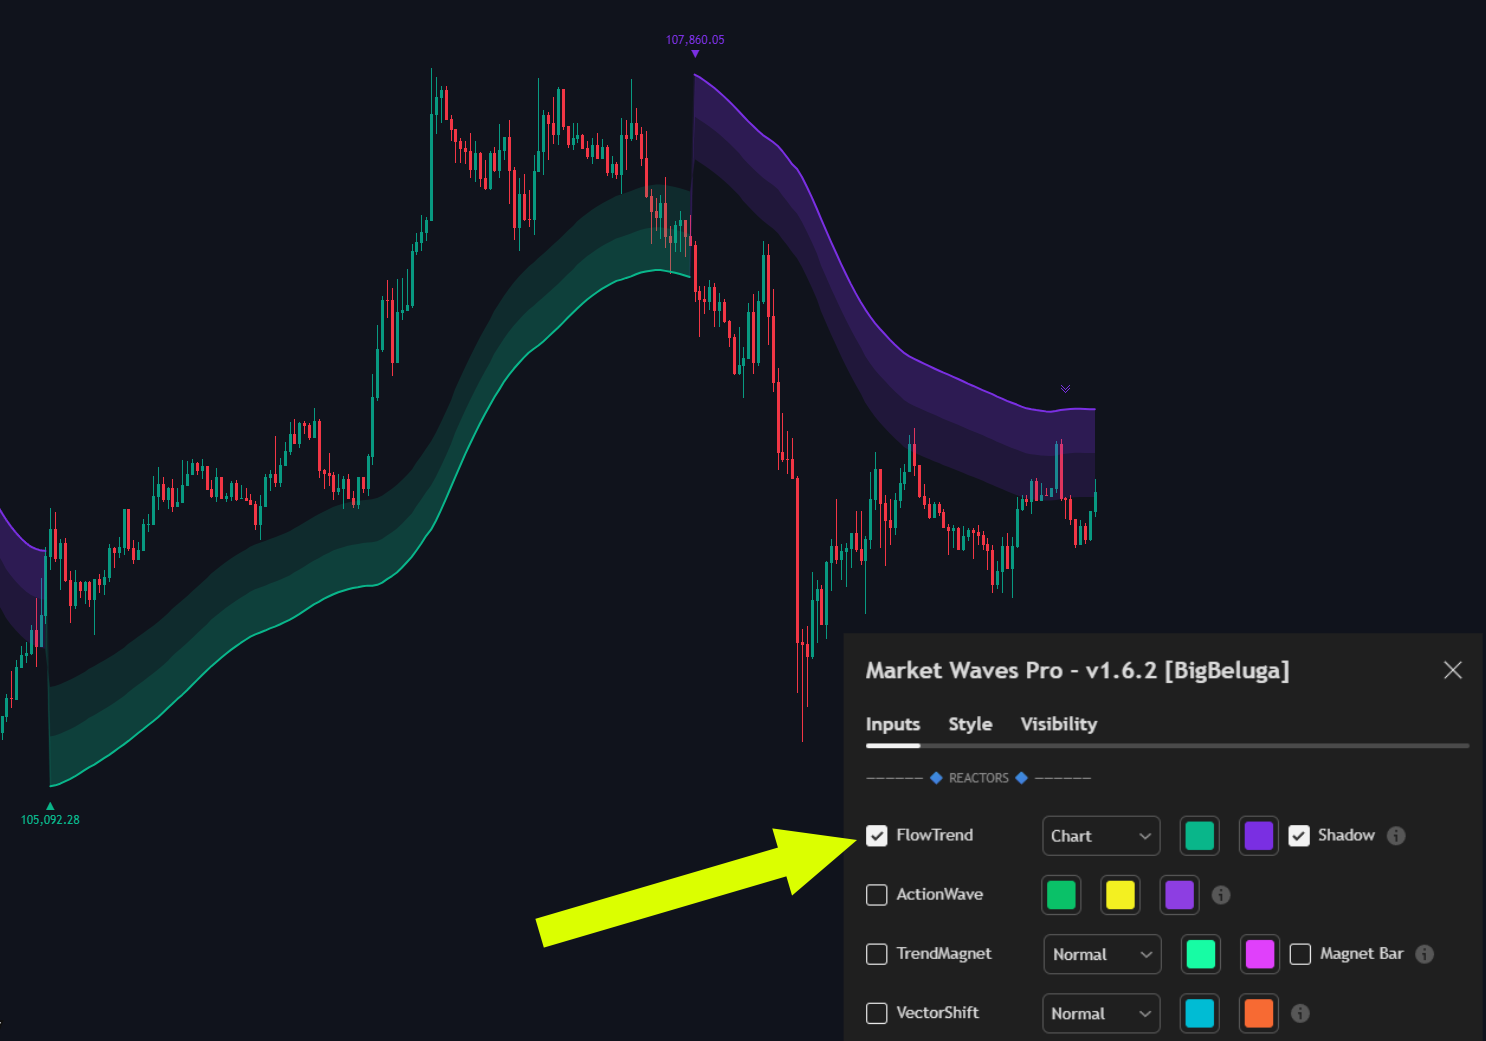
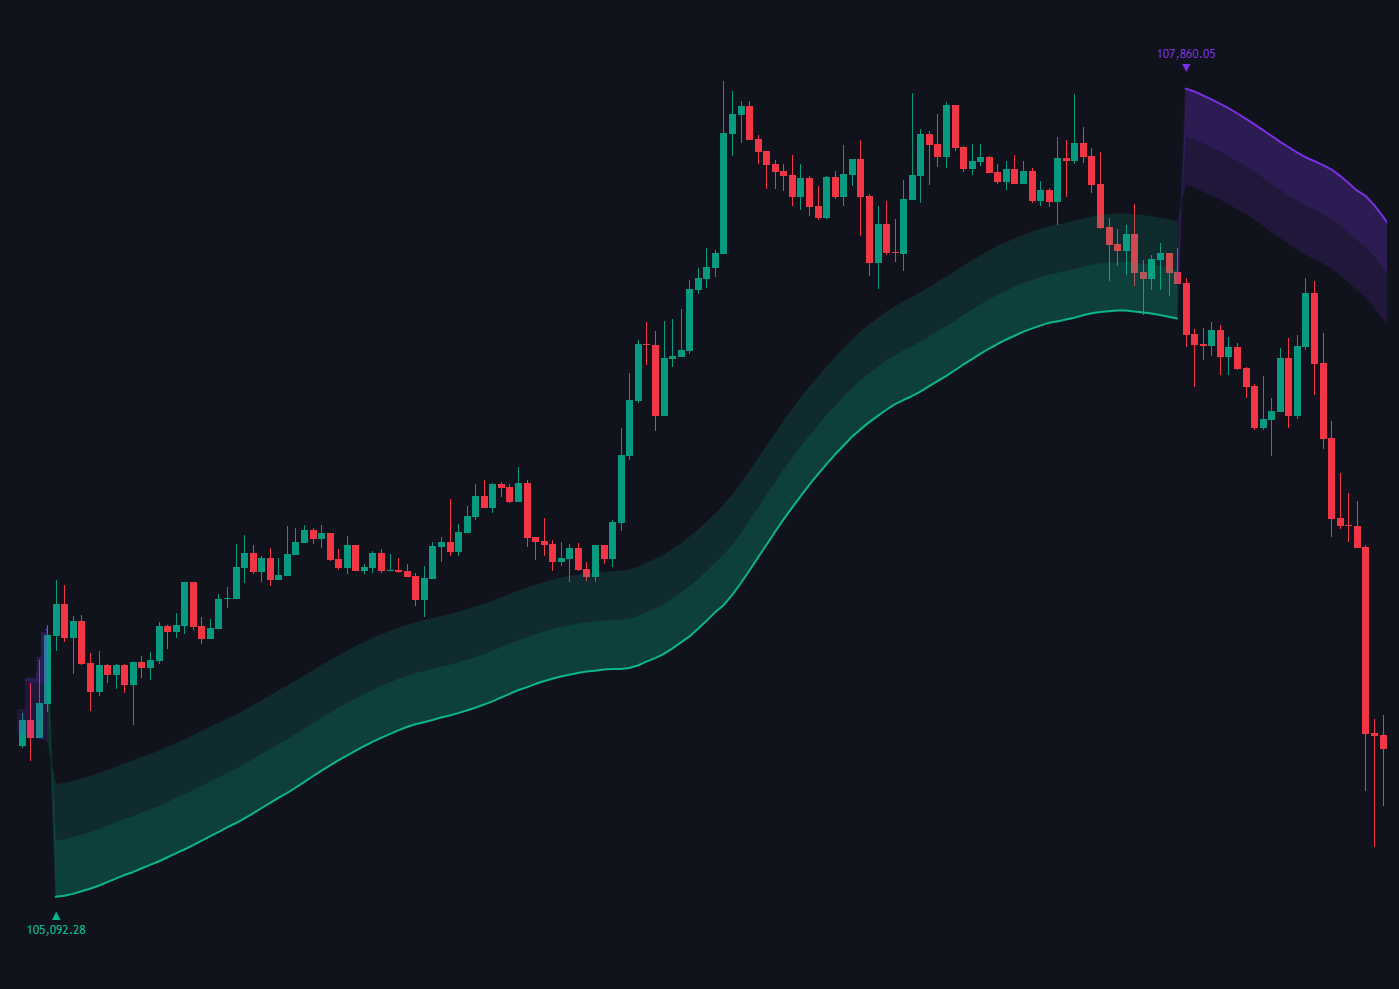
This custom indicator is designed to efficiently identify and follow market trends while avoiding false reversals.
It dynamically adjusts to market volatility, ensuring that it stays on the right side of the trend without reacting prematurely to minor market fluctuations.
## **Trend Signals**
The indicator displays signals at the key turning points (triangles) with a price value, indicating the bullish or bearish momentum.
## Retest Signals
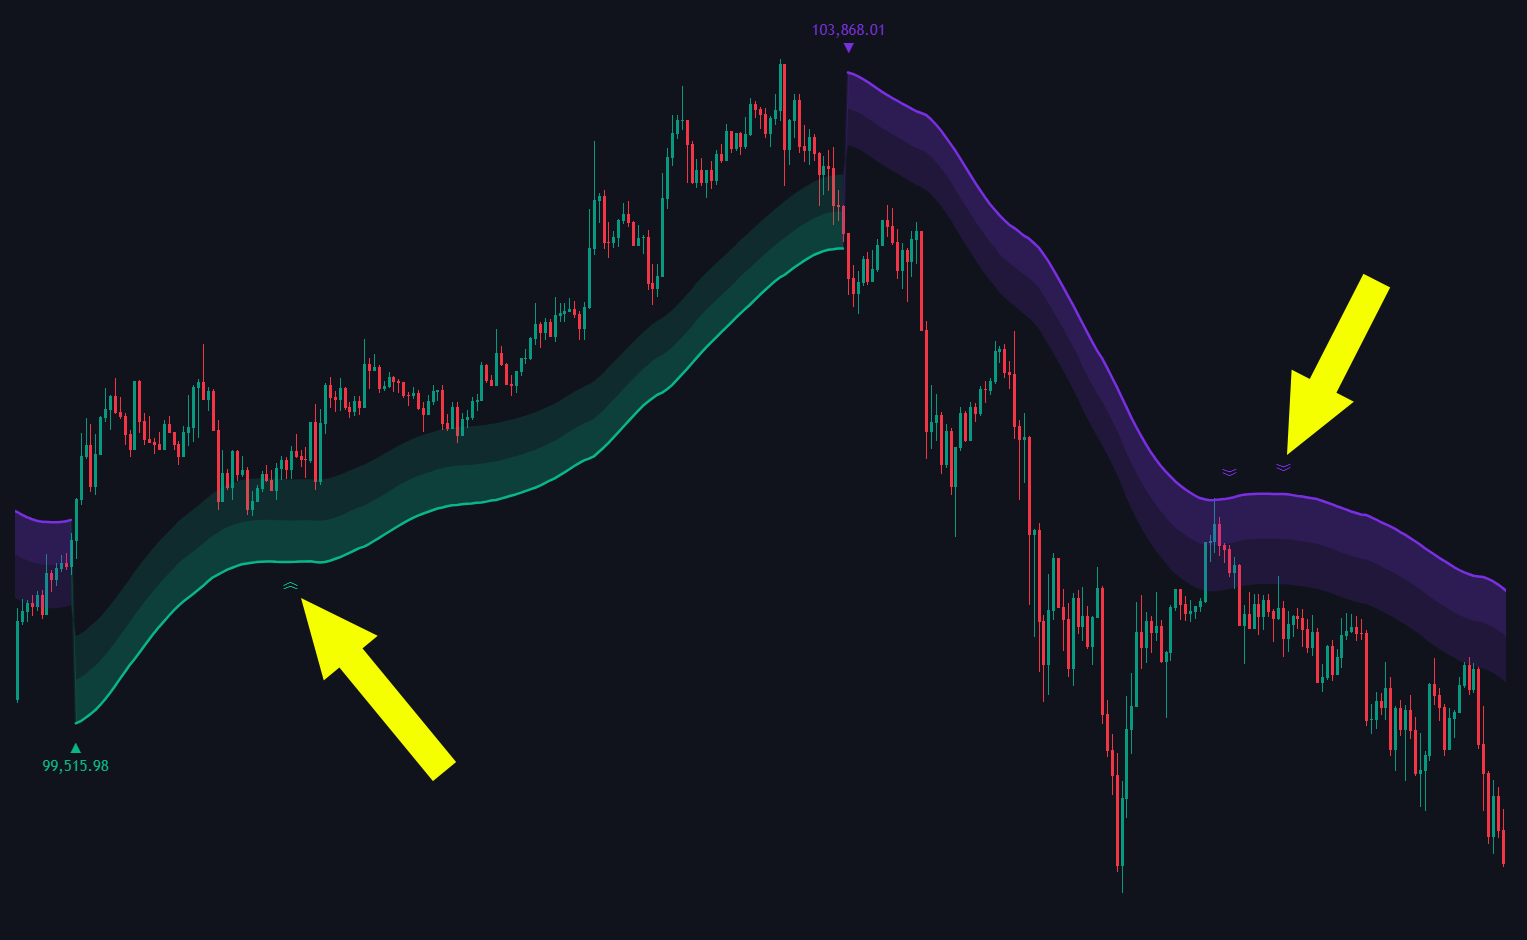
The Retest Signals indicator identifies potential continuation points by marking key retest levels of dynamic zones (bands).
{% hint style="info" %}
It provides visual confirmation for traders to analyze whether the price is likely to respect critical zones, aiding in decision-making for entries.
{% endhint %}
##
## Customizable Timeframes
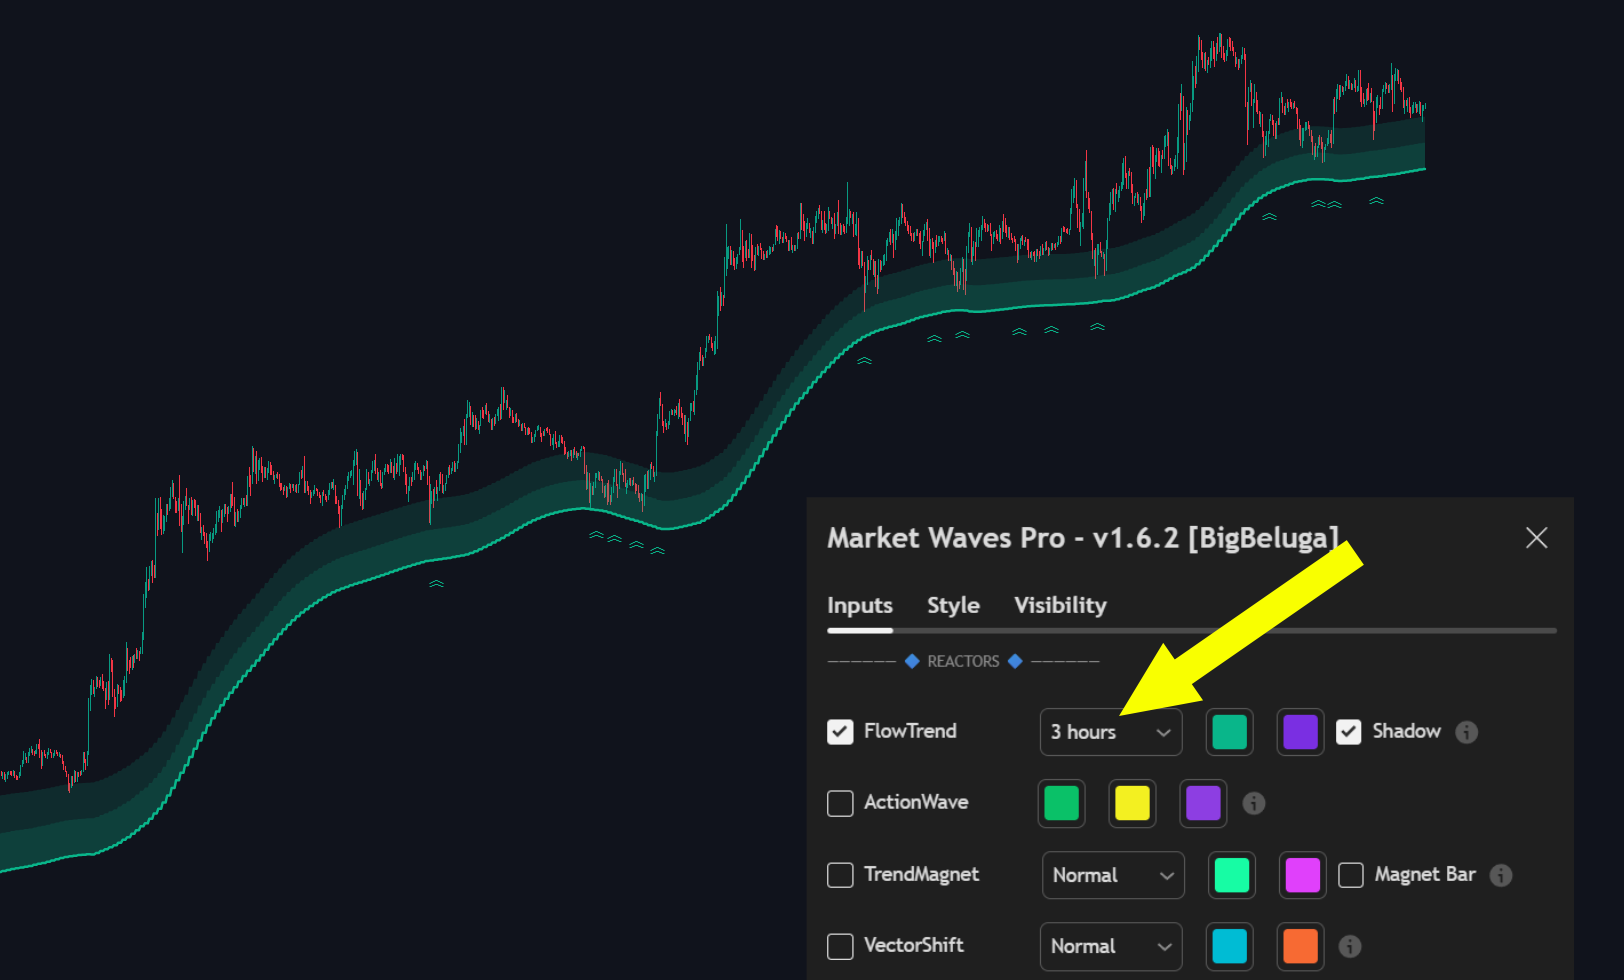
Users can choose higher timeframes from which the FlowTrend is plotted.
{% hint style="info" %}
Selecting a higher timeframe than the current chart provides a broader, longer-term trend perspective with reducing a noise from the bands and clearly see the trends and momentum shifts.
{% endhint %}
## Settings
| Settings | Description |
| ------------------ | -------------------------------------------------------------------------------------------------------------- |
| Toggle ON/OFF | Enable or disable the FlowTrend layer on the chart. |
| Timeframe Selector | Choose the higher only timeframe from which the trend data is derived (e.g., Chart = current chart timeframe). |
| Color Settings | Adjust bullish and bearish colors to match your preferred visual style. |
| Shadow | Enable or disable the FlowTrend two step shadow cloud. |