> For the complete documentation index, see [llms.txt](https://docs.bigbeluga.org/llms.txt). Markdown versions of documentation pages are available by appending `.md` to page URLs; this page is available as [Markdown](https://docs.bigbeluga.org/main-toolkits/market-waves-pro-tm/candlestick-patterns.md).
# Candlestick Patterns
This indicator improves traditional candlestick pattern detection by incorporating market mean-reversion phases and volume analysis, providing higher accuracy and reliability in trading signals.
## **Bearish** candlestick patterns
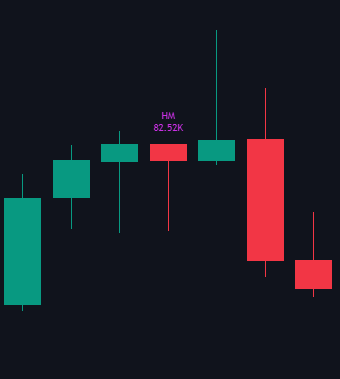
Hanging Man (HM)
A bearish reversal pattern occurring after an uptrend, signaling potential selling pressure. The pattern is validated by mean-reversion zones to confirm trend exhaustion.
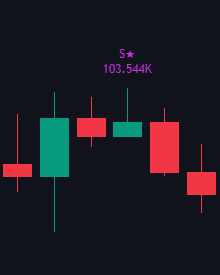
Shooting Star (S)
A potential bearish reversal pattern where the price closes near its low after a long upper shadow. It is filtered to appear only in relevant reversion phases.
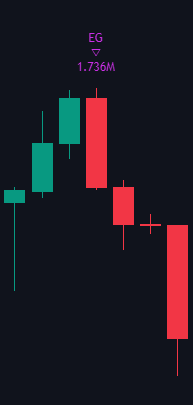
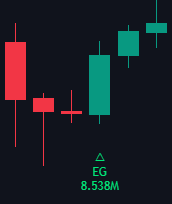
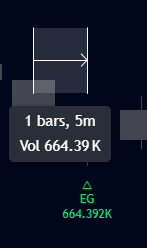
Bearish Engulfing (EG)
A strong bearish signal when a larger down candle completely engulfs the prior up candle. Market phase analysis ensures it appears in high-probability scenarios.
Falling 3 (F3)
A bearish continuation pattern that indicates downward momentum after a period of consolidation. It is displayed only in relevant market contexts.
Three Black Crows (3BC)
Three consecutive bearish candles signaling sustained bearish momentum. The pattern is validated by mean-reversion data.
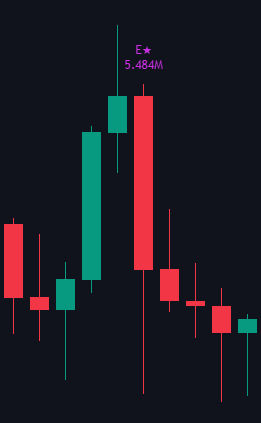
Evening Star (E)
A bearish reversal pattern marking a shift in trend, confirmed through market phase filtering to enhance accuracy.
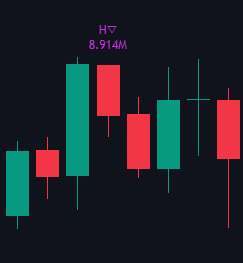
Bearish Harami (H)
A weaker bearish reversal pattern appearing during retracement phases, validated by trend exhaustion signals.
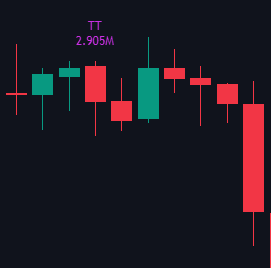
Tweezer Top (TT)
A pattern indicating rejection of higher prices, appearing in phase-analyzed conditions to confirm exhaustion.
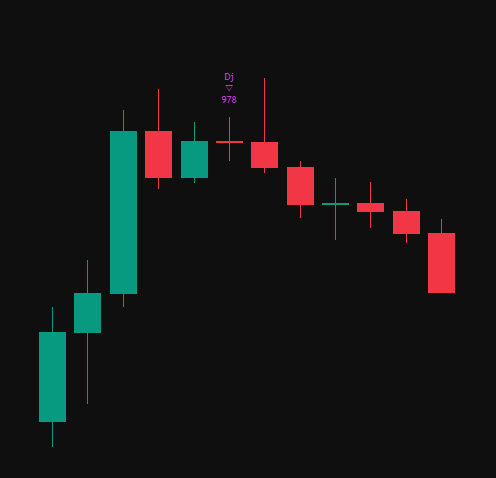
Bearish Doji
A Bearish Doji forms after an extended uptrend and suggests that **buying momentum is weakening**.
##
## **Bullish candlestick patterns**
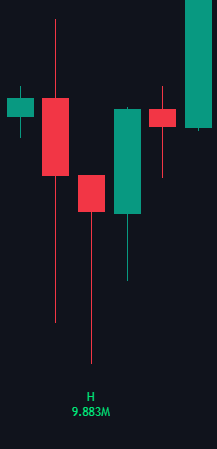
Hammer (H)
A bullish reversal pattern occurring after a downtrend. The indicator filters this pattern to show only in validated reversion phases.
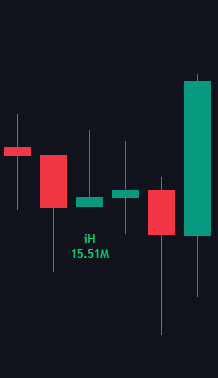
Inverted Hammer (IH)
A potential bullish reversal signal appearing after a downtrend. It is optimized by market phase analysis to increase reliability.
Bullish Engulfing (EG)
A strong bullish signal where a larger up candle engulfs the prior down candle. Only shown when validated by reversion zones.
Rising 3 (R3)
A bullish continuation pattern that signals upward momentum after a pause. It is filtered to ensure relevance to market phases.
Three White Soldiers (3WS)
Three consecutive bullish candles signaling strong upward momentum. The indicator validates this pattern in mean-reversion phases.
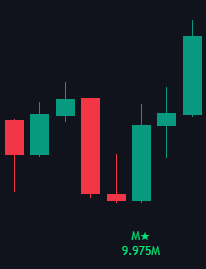
Morning Star (M)
A bullish reversal pattern indicating a shift in trend, confirmed by phase-based market filtering.
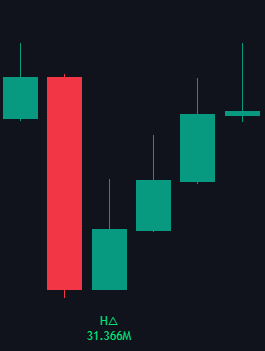
Bullish Harami (H)
A weaker bullish reversal signal appearing during retracement phases, optimized to reduce false positives.
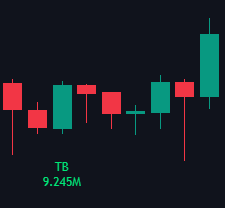
Tweezer Bottom (TB)
A pattern signaling rejection of lower prices, validated by market exhaustion analysis to confirm a reversal.
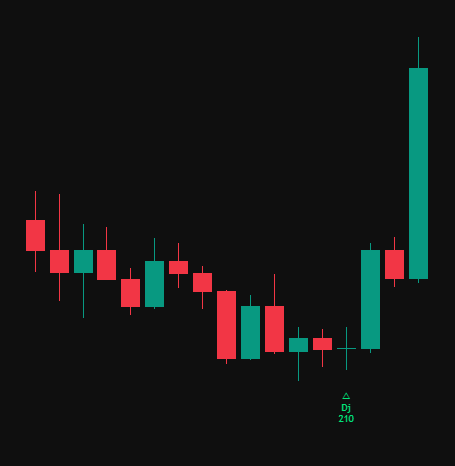
Bullish Doji
A Bullish Doji appears after a downtrend and reflects market indecision as sellers begin to lose strength.
The candle has a small body with long wicks, indicating that although price moved during the session, it closed near its open.
This pause often signals a potential **shift in sentiment**. When confirmed by a strong bullish candle (like a bullish engulfing or hammer), it can mark the **beginning of a reversal to the upside**.
##
## Volume Data
The displayed volume corresponds to the total volume of all bars contributing to the formation of the pattern:
Volume data provides insights into the strength and reliability of each pattern.
##
## Settings
Hammer, Engulfing, Rising 3, Three White Soldiers, Star (Morning/Evening/Shooting), Harami, Tweezer Top/Bottom, Doji, Hanging Man, Falling 3, Three Black Crows