> For the complete documentation index, see [llms.txt](https://docs.bigbeluga.org/llms.txt). Markdown versions of documentation pages are available by appending `.md` to page URLs; this page is available as [Markdown](https://docs.bigbeluga.org/main-toolkits/market-waves-pro-tm/candle-coloring.md).
# Candle Coloring
Follow trends cleaner with the BigBeluga candle coloring modes.
## **Trend**
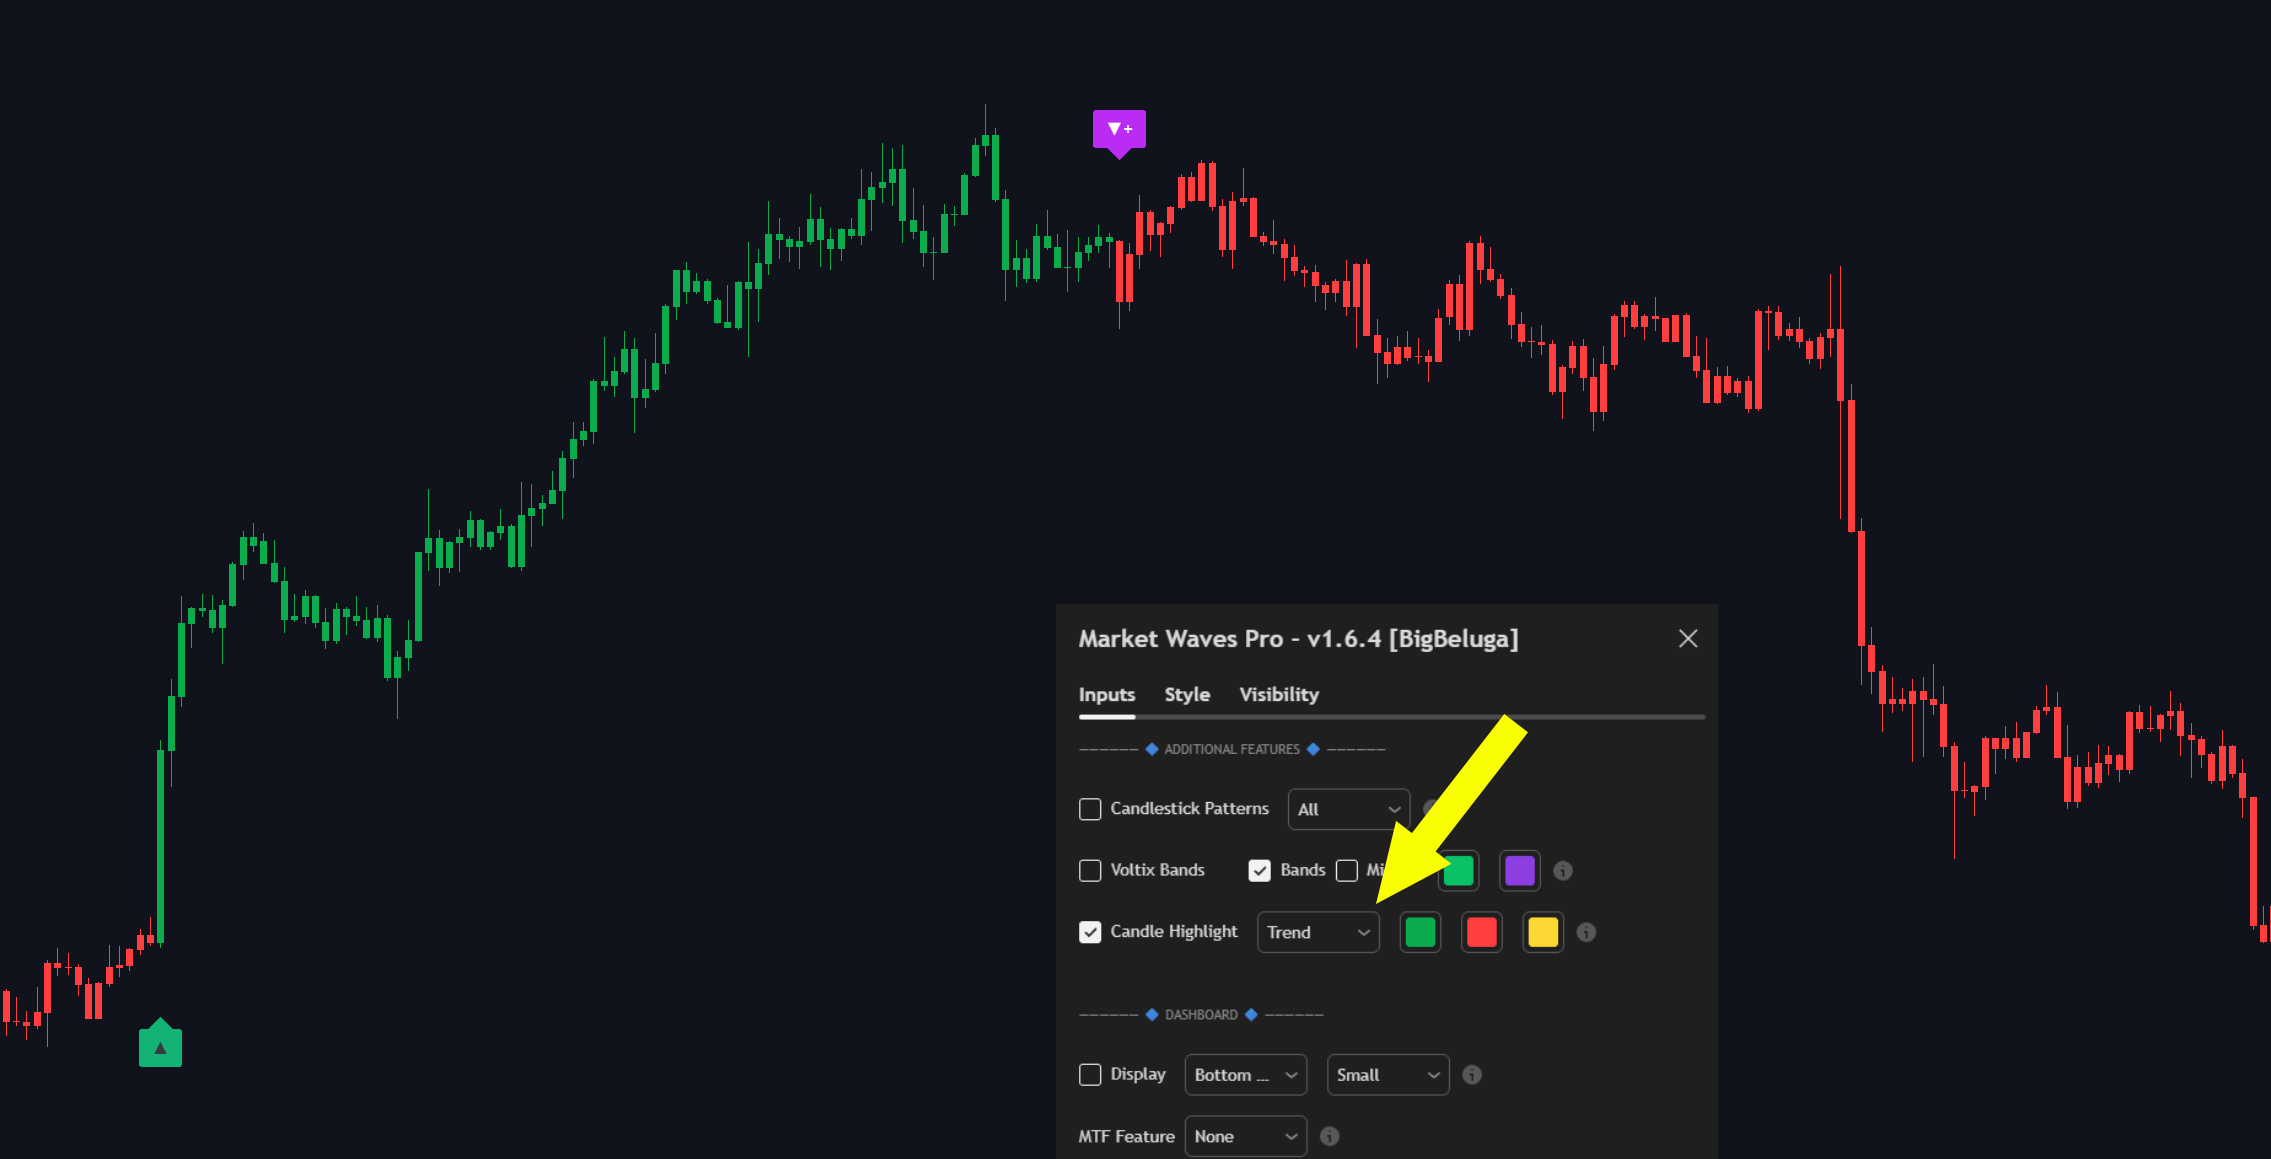
Trend-based candle coloring mode changes the color of candlesticks depending on the current market trend, helping traders visually distinguish between bullish and bearish phases.
{% hint style="info" %}
### How It Works
Bullish Trend: Candles are colored green when the price is in an uptrend.\
Bearish Trend: Candles are colored red when the price is in a downtrend.
{% endhint %}
##
## **Momentum**
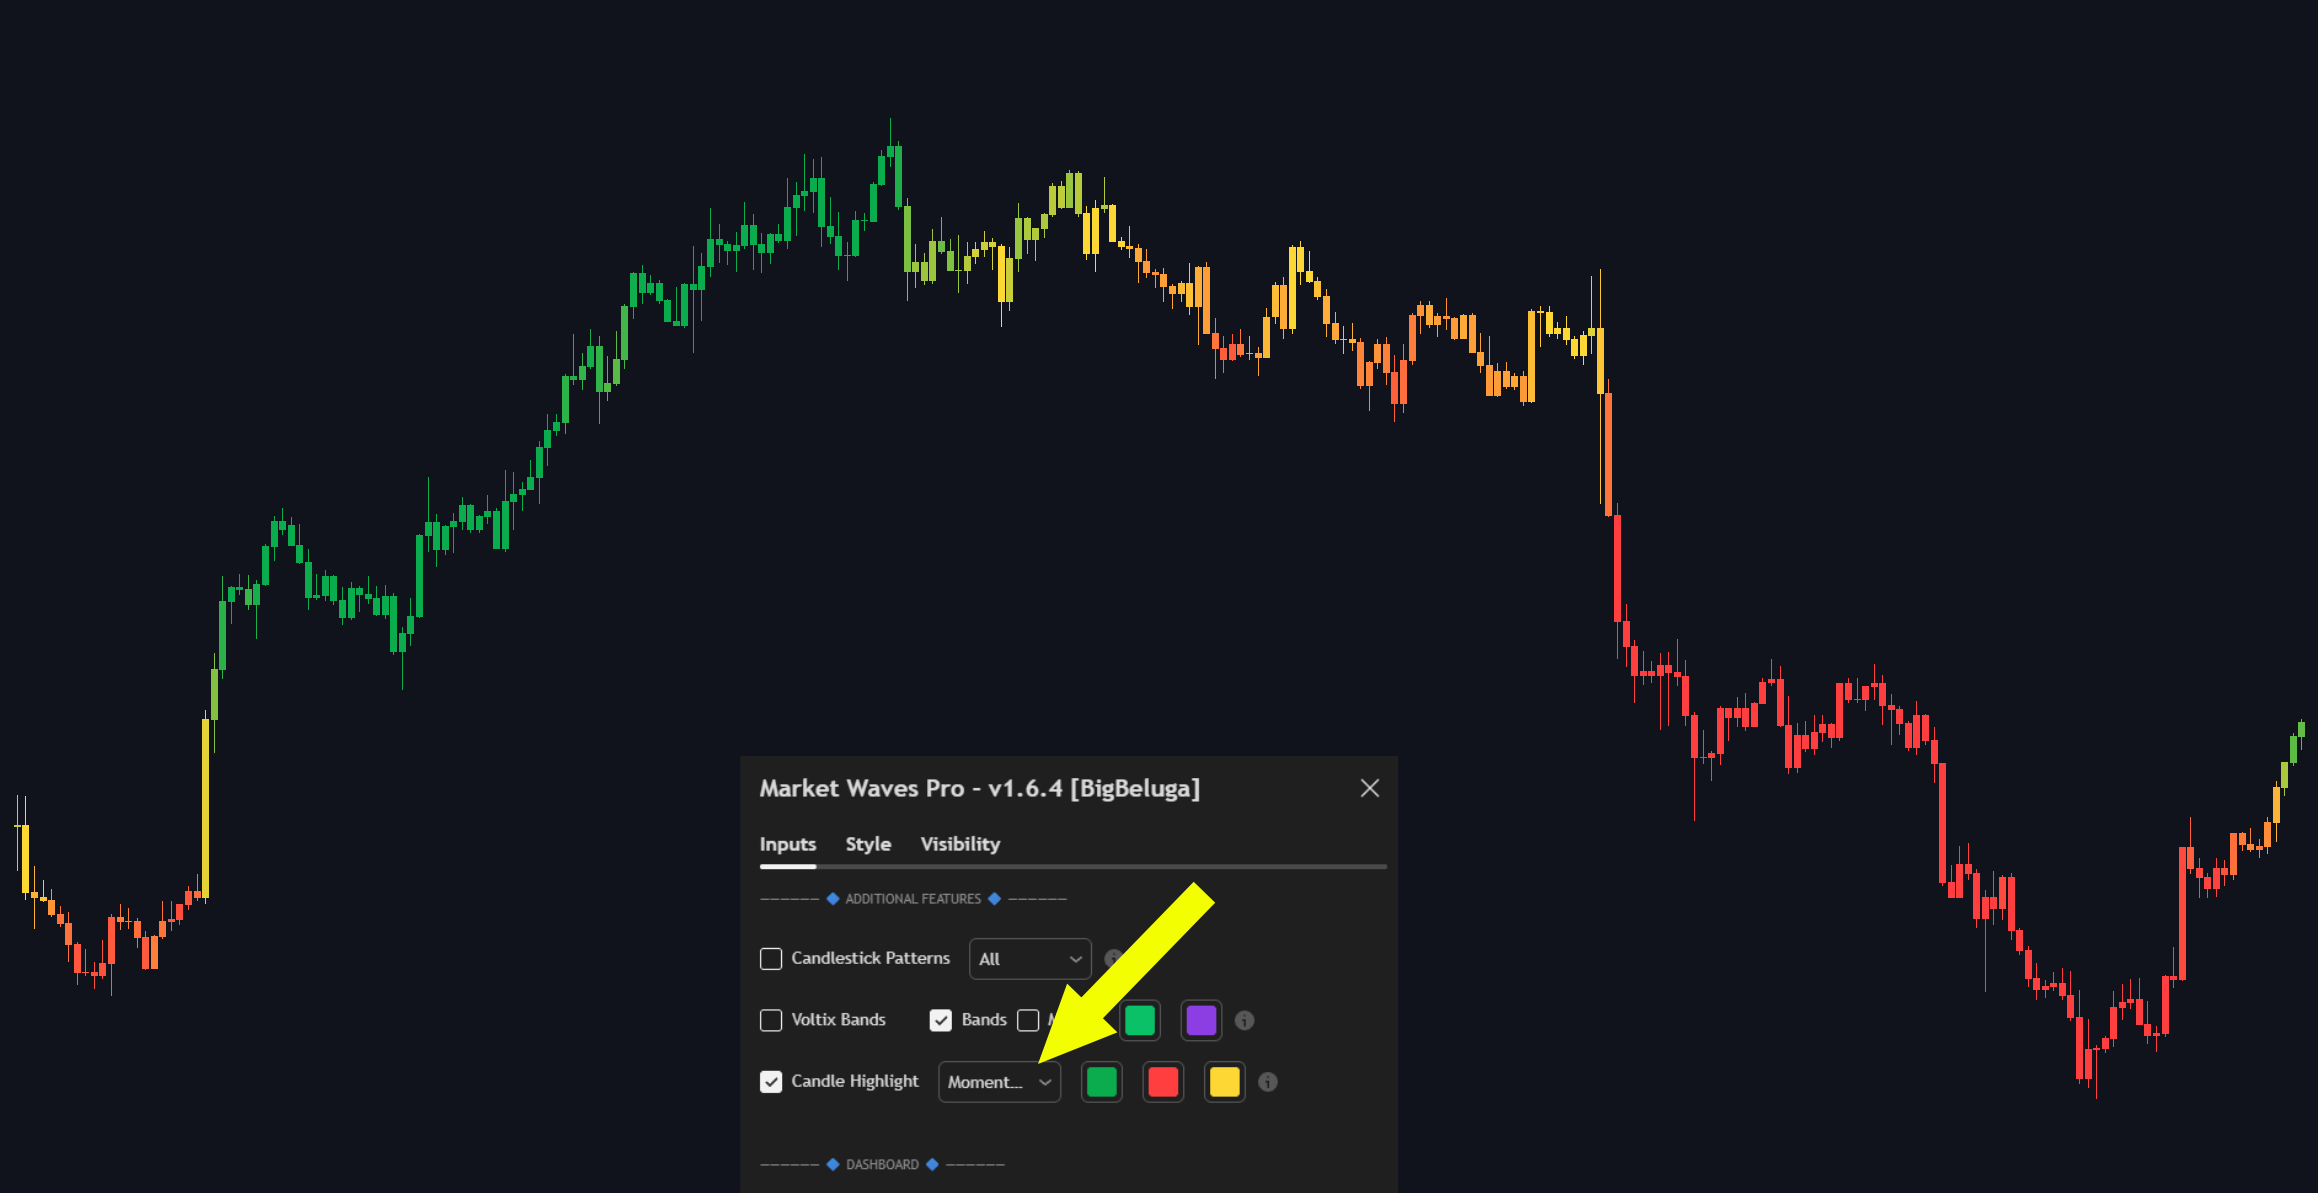
This feature visually represents market momentum using three distinct colors to signal potential trend strength and transitions.
{% hint style="info" %}
### How it works
Strong Bullish Momentum (Green Candles)
Candles turn green when strong buying pressure drives prices higher. This shows robust upward momentum, suggesting the price is likely to keep rising.
Strong Bearish Momentum (Red Candles)
Candles turn red when strong selling pressure pushes prices lower. This shows robust downward momentum, suggesting the price is likely to keep falling.
Weakening Momentum (Aqua Candles)
Candles turn aqua when momentum slows down. This serves as an early warning for a potential trend reversal or a sideways market.
{% endhint %}
##
## Momentum & Volume
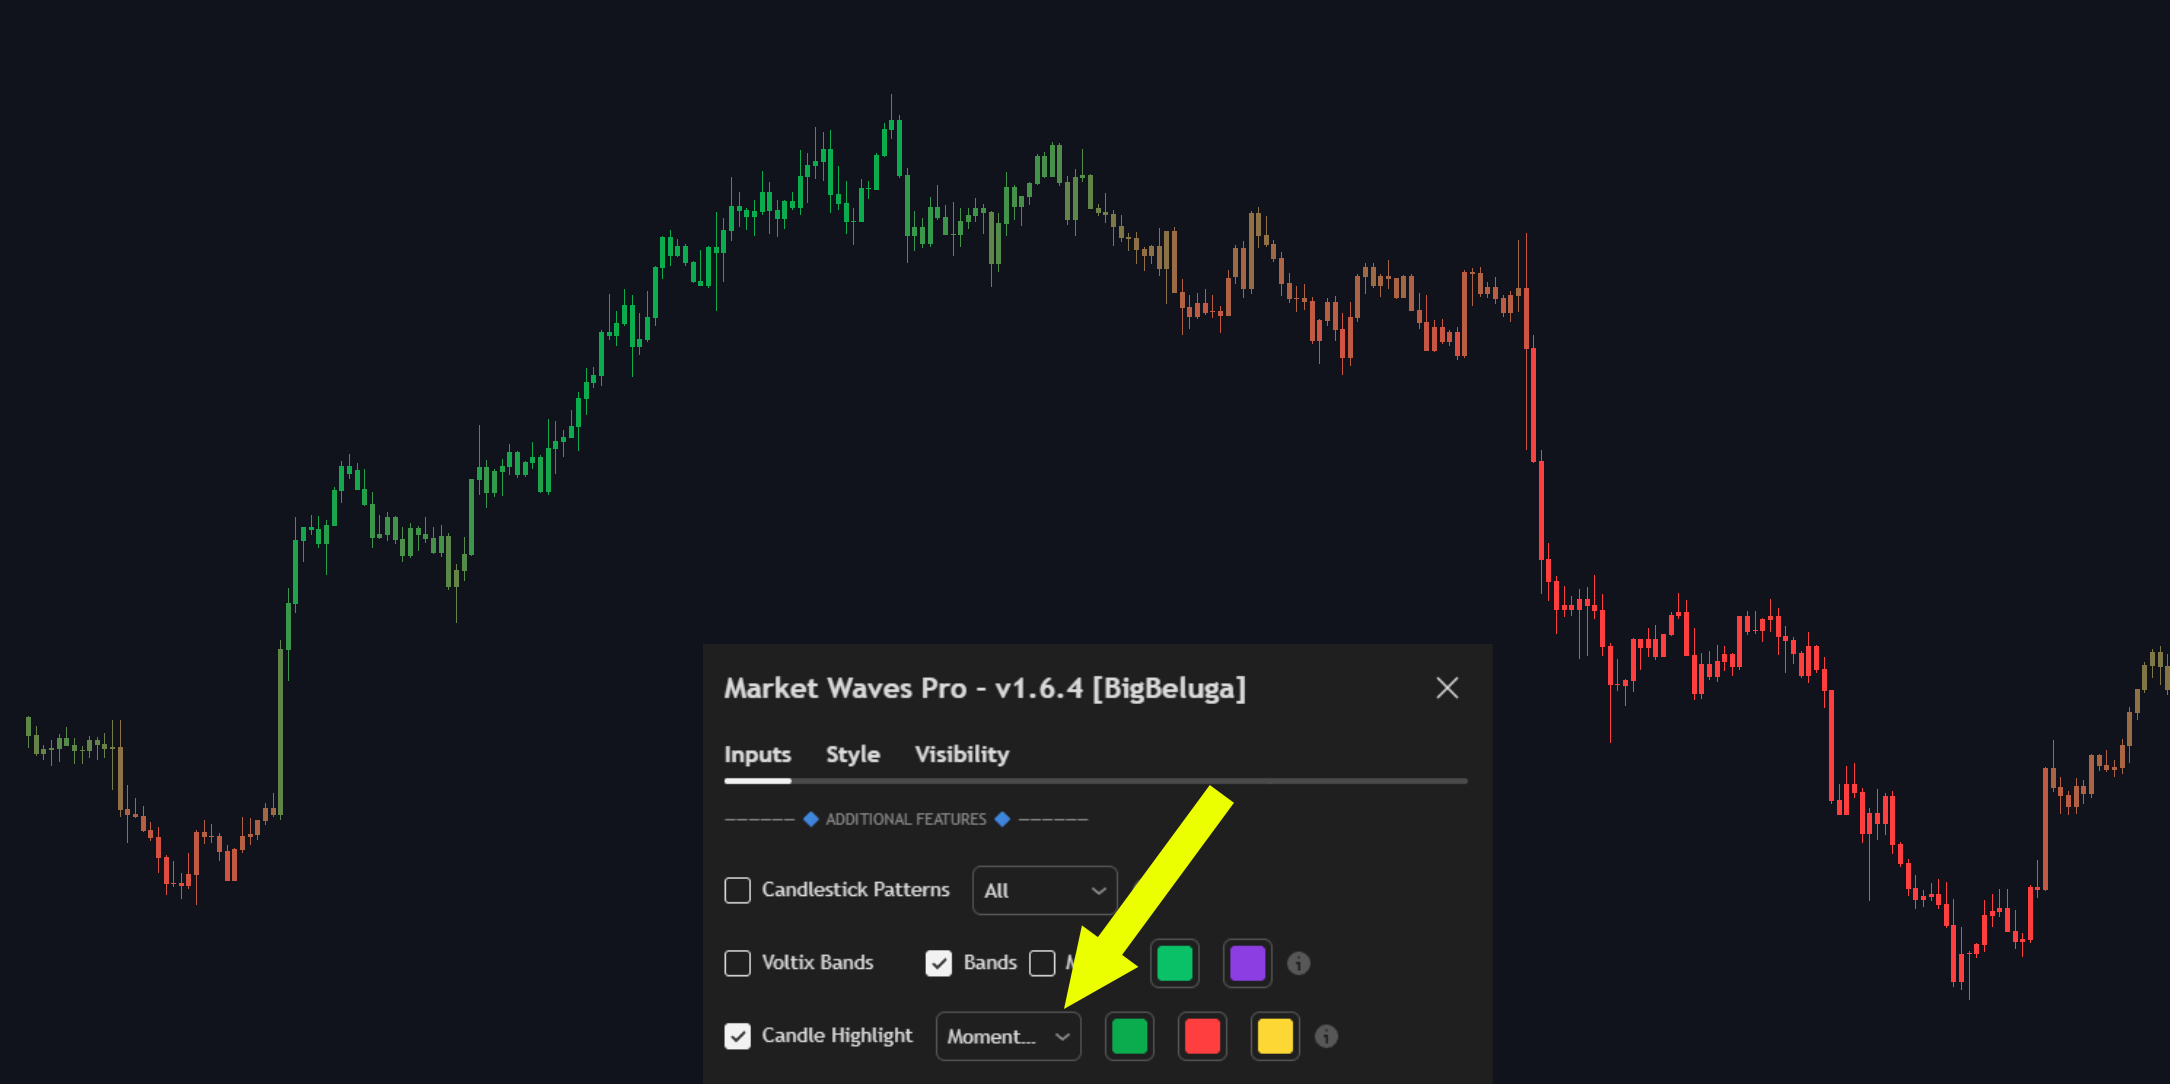
The Momentum & Volume mode acts as a visual heatmap, identifying areas of high-intensity trading activity.
Trend color intensity highlights volume strength, which often coincide with significant market turning points.
{% hint style="info" %}
### **How It Works**
The algorithm overlays volume intensity onto the current momentum direction. This creates a "Heatmap" effect that adapts based on the market environment:
High Intensity (Bright Red/Green): These represent Volume Spikes.
* In a Ranging Market: These intense colors often appear at the absolute peaks or troughs of price action. This indicates a "climax" where aggressive buying or selling has reached a limit, often leading to a reversal.
* In a Trending Market: High intensity signifies Strong Conviction. Unlike a single spike, a sequence of intense candles indicates a powerful expansion phase where "Smart Money" is driving the price. This suggests the trend has significant "fuel" and is likely to persist.
{% endhint %}
##
## Trend & **Volume**
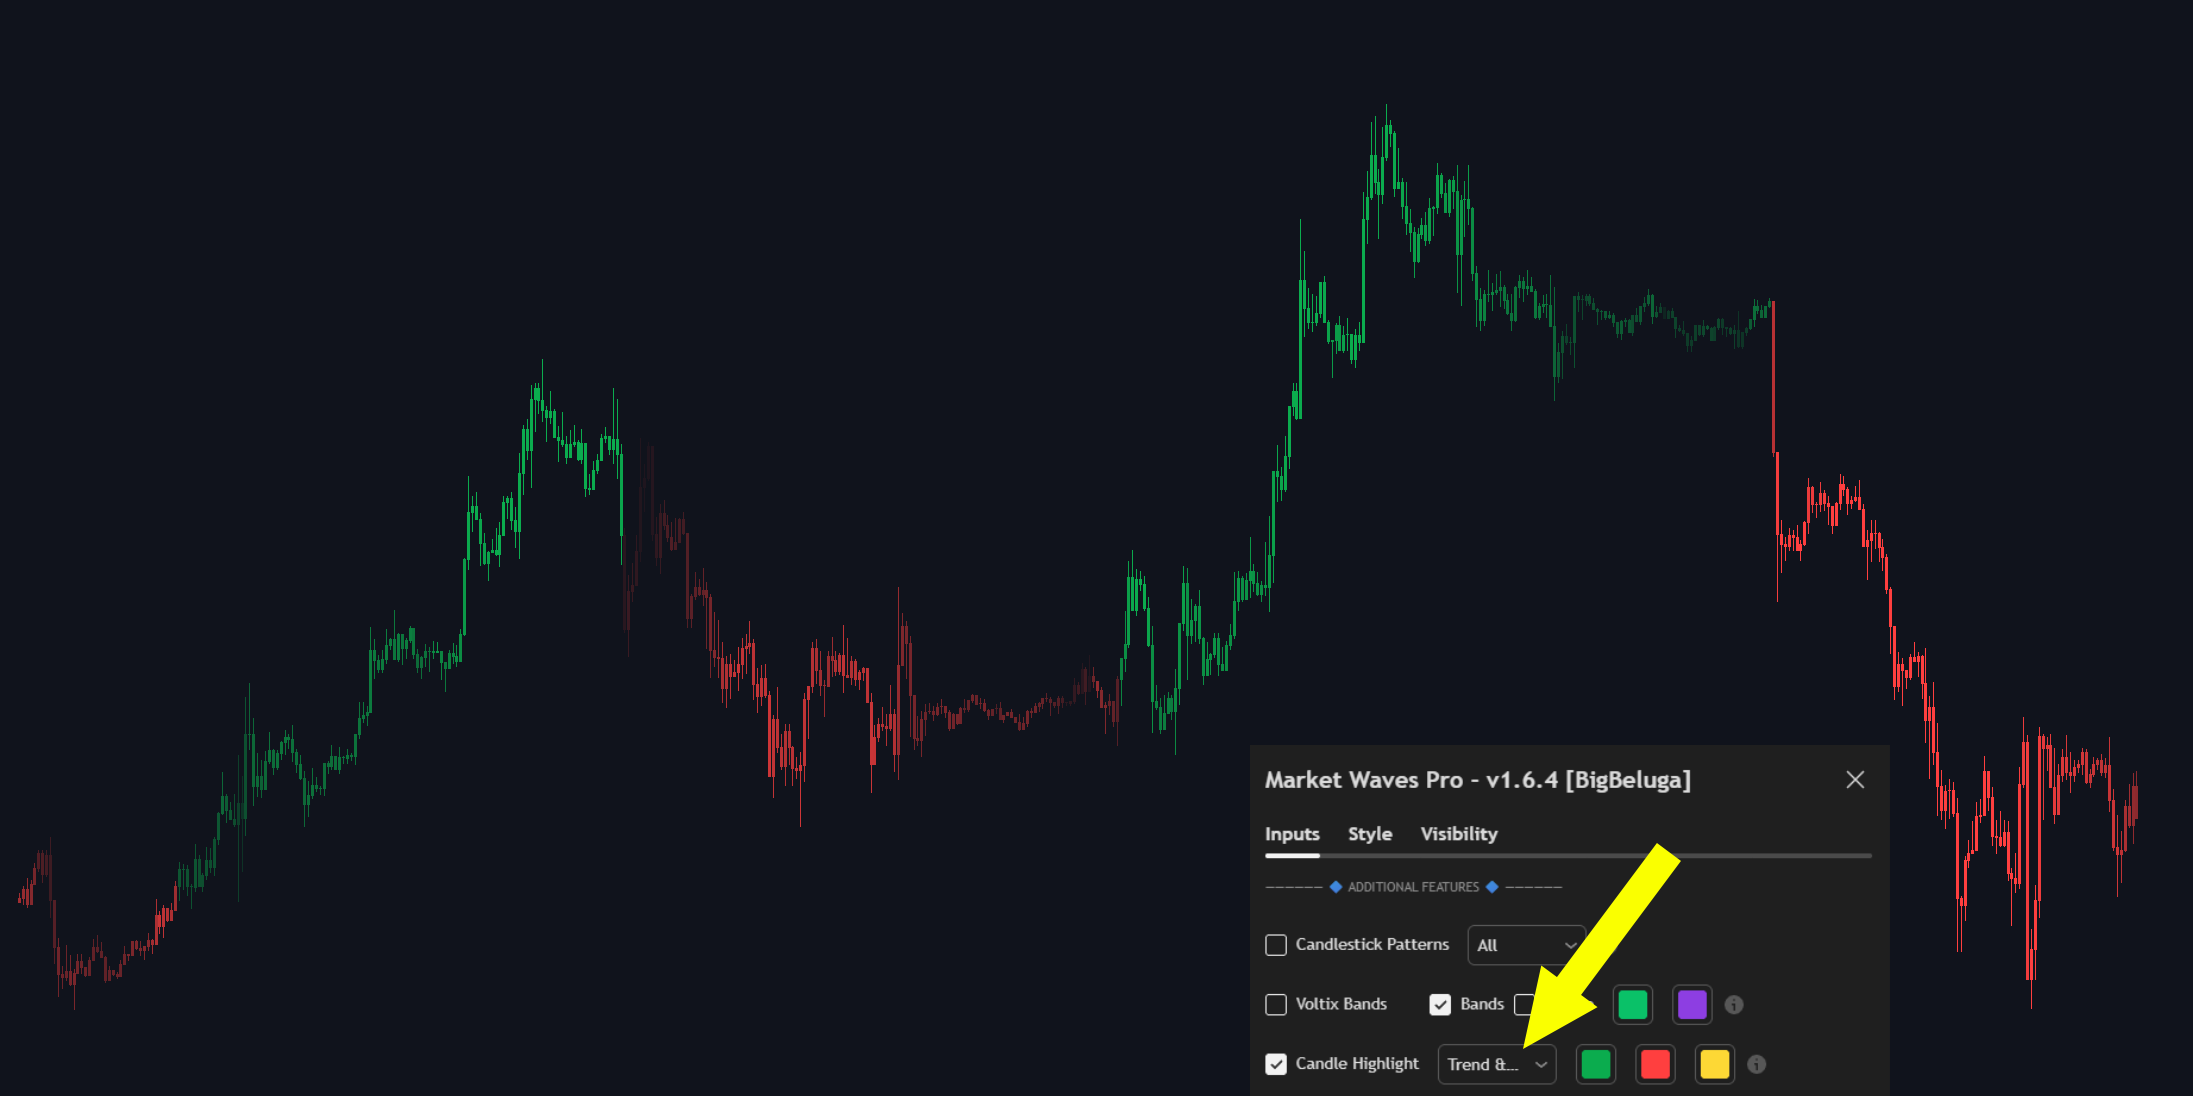
Trend + Volume-based candle coloring visually highlights the market's momentum by combining price direction and trading volume.
Intense Green candles indicate bullish momentum with stronger buying pressure, while intense purple candles signify bearish momentum with increasing selling pressure.
{% hint style="info" %}
### How It Works
The candle coloring algorithm evaluates both price direction and relative volume.
* When buying activity dominates alongside upward price movement, candles are marked green. Conversely, when selling activity increases during a downward price movement, candles are colored red.
* This dual analysis ensures a more precise visualization of momentum and volume interplay, aiding in identifying potential trend reversals or continuations.
{% endhint %}
##
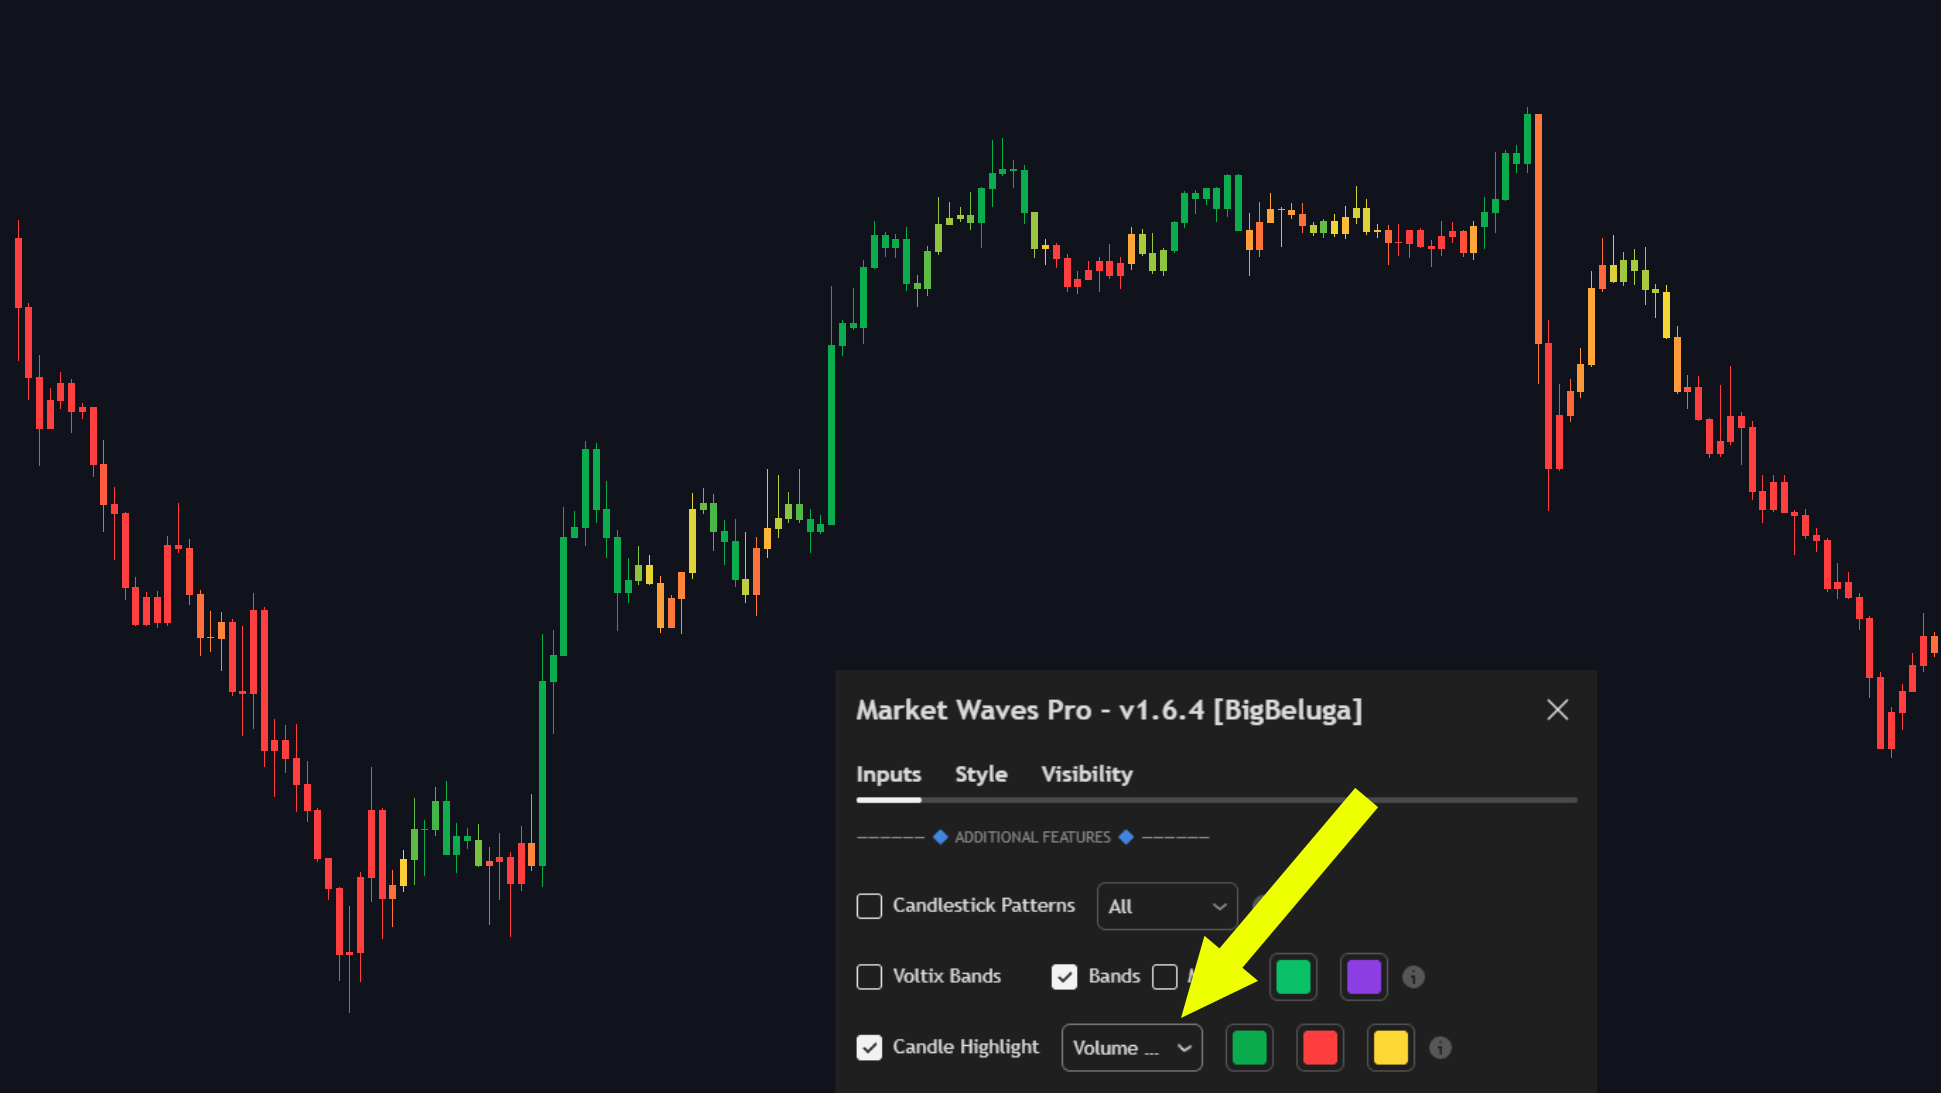
## Volume Heikin Ashi
Transform your chart reading with the Volume-Weighted Heikin Ashi Candle Coloring feature.
By fusing standard Heikin Ashi smoothing with underlying volume data, this tool filters out market noise to help you effortlessly spot dominant trends, measure momentum shifts, and catch early warnings of pullbacks.
{% hint style="info" %}
#### How It Works
The indicator dynamically recolors your candlesticks based on real-time price action and volume weighting:
* Green Candles (Strong Bullish Momentum): Indicate robust upward pressure backed by strong buying volume, signaling that buyers are in firm control of the trend.
* Red Candles (Strong Bearish Momentum): Highlight heavy selling pressure accompanied by solid volume, pointing to a continuation of the downward trend.
* Yellow Candles (Potential Reversal / Pullback): Act as your early warning system. These highlight momentary pauses, shifts in volume and price action, or potential pullbacks within an ongoing trend, helping you lock in profits or prepare for a counter-trend move.
{% endhint %}