> For the complete documentation index, see [llms.txt](https://docs.bigbeluga.org/llms.txt). Markdown versions of documentation pages are available by appending `.md` to page URLs; this page is available as [Markdown](https://docs.bigbeluga.org/main-toolkits/market-waves-pro-tm/actionwave.md).
# ActionWave
Soon...
Action Wave is a macro trend filter designed to smooth out market noise and highlight the true direction of dominant price flows.
##
## **Trend Visualization**
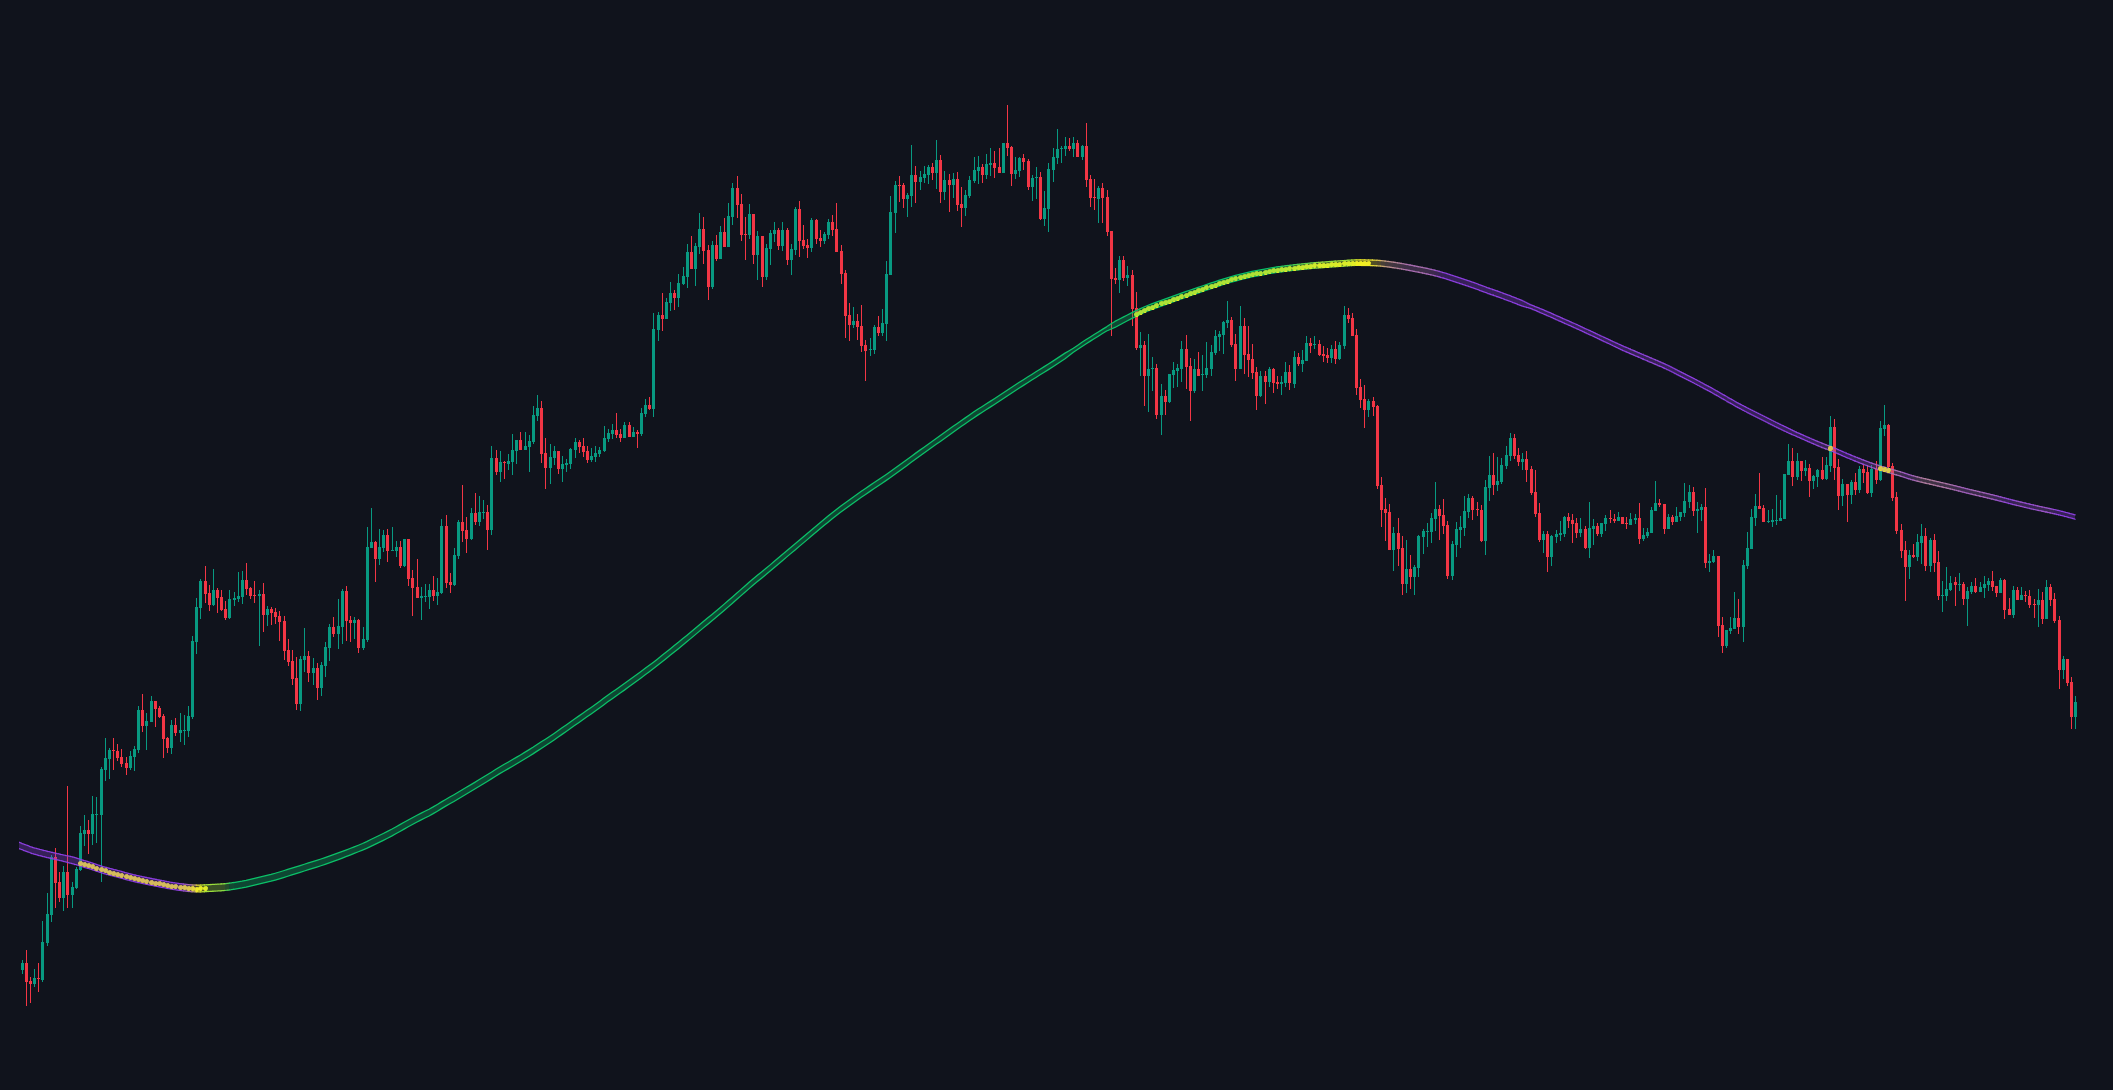
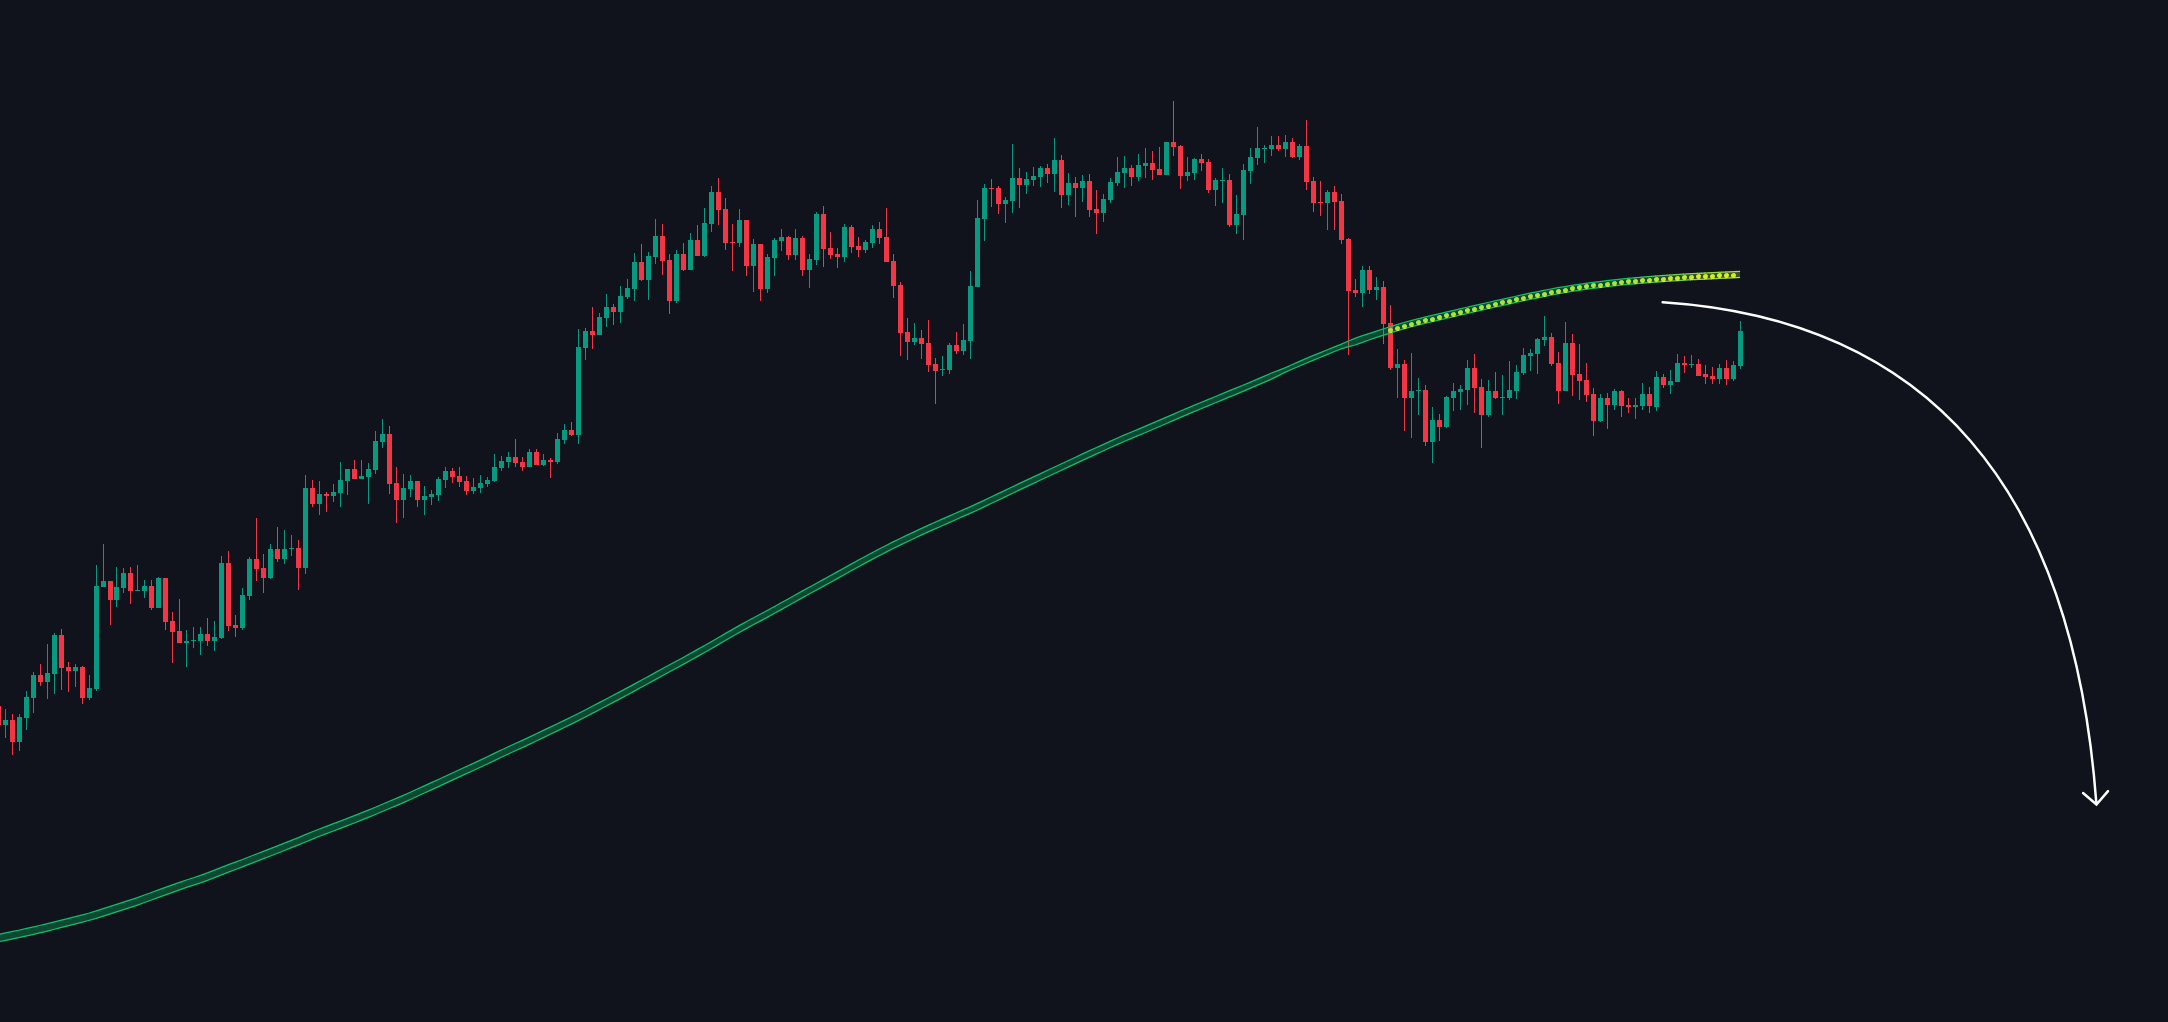
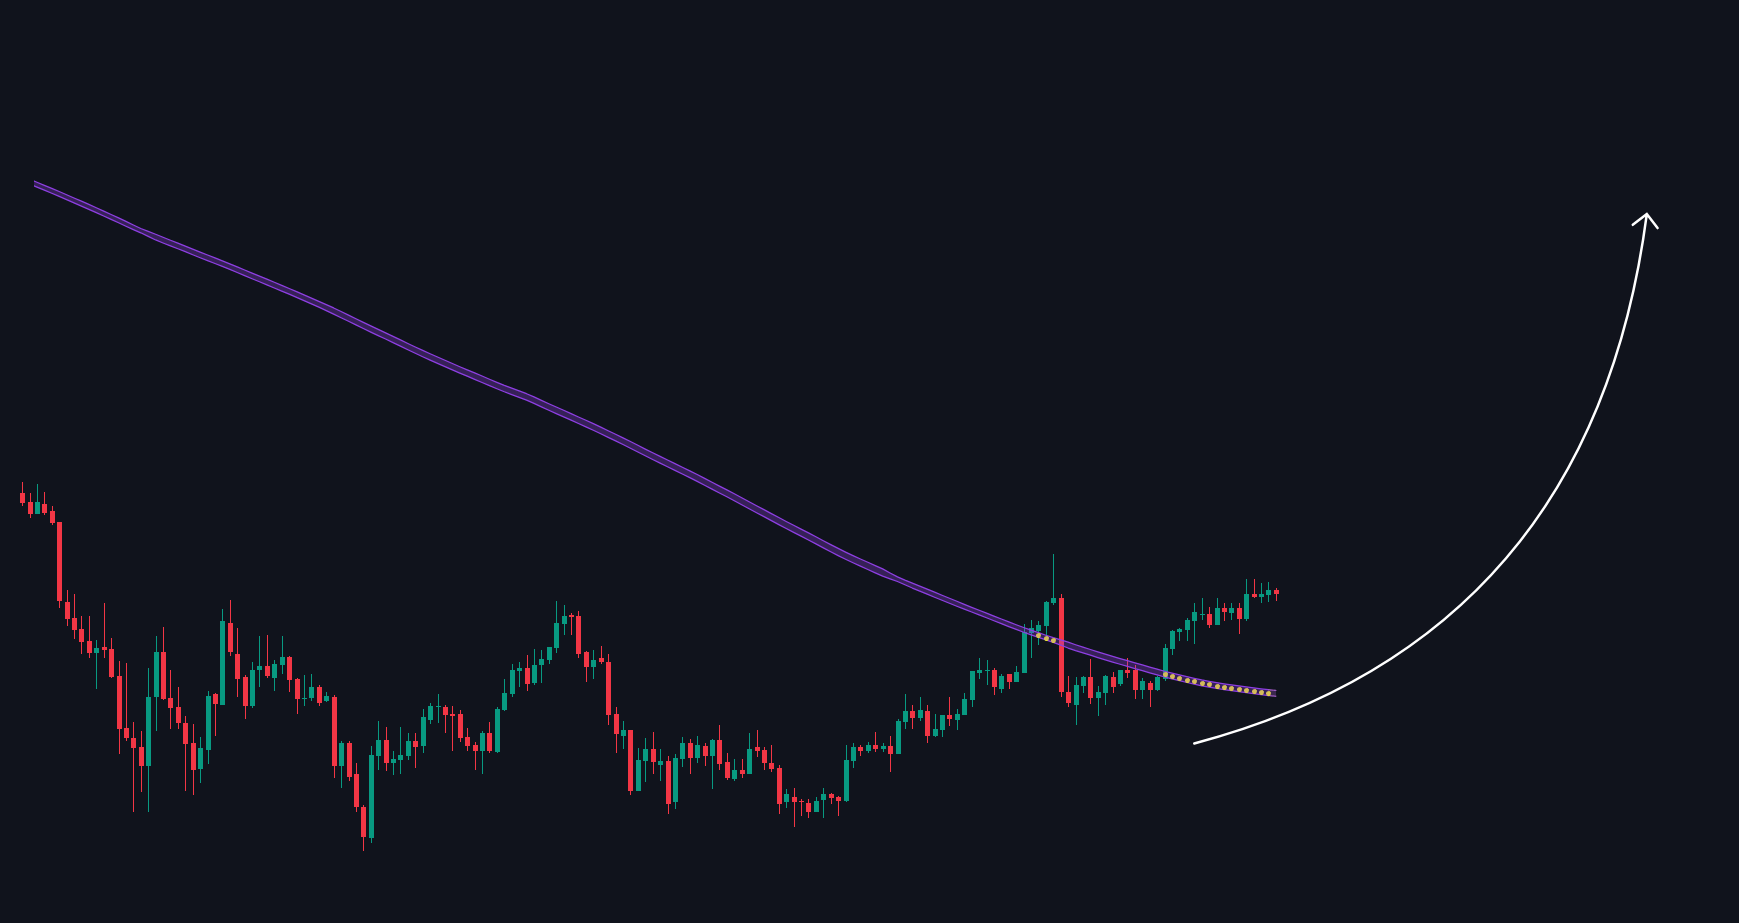
ActionWave consists of two primary bands with color-coded signals. Green bands indicate an uptrend, while Purple bands indicate a downtrend, showing the direction of market momentum.
##
## **Yellow Momentum Circles**
Inside the bands, a yellow circles appears to signal low price momentum and potential market shifts within a trend.
{% hint style="info" %}
This line reflects changes in momentum, giving traders an early indication of trend fatigue or potential reversals.
{% endhint %}
##
## How to use
### **Trend Continuation Entry**
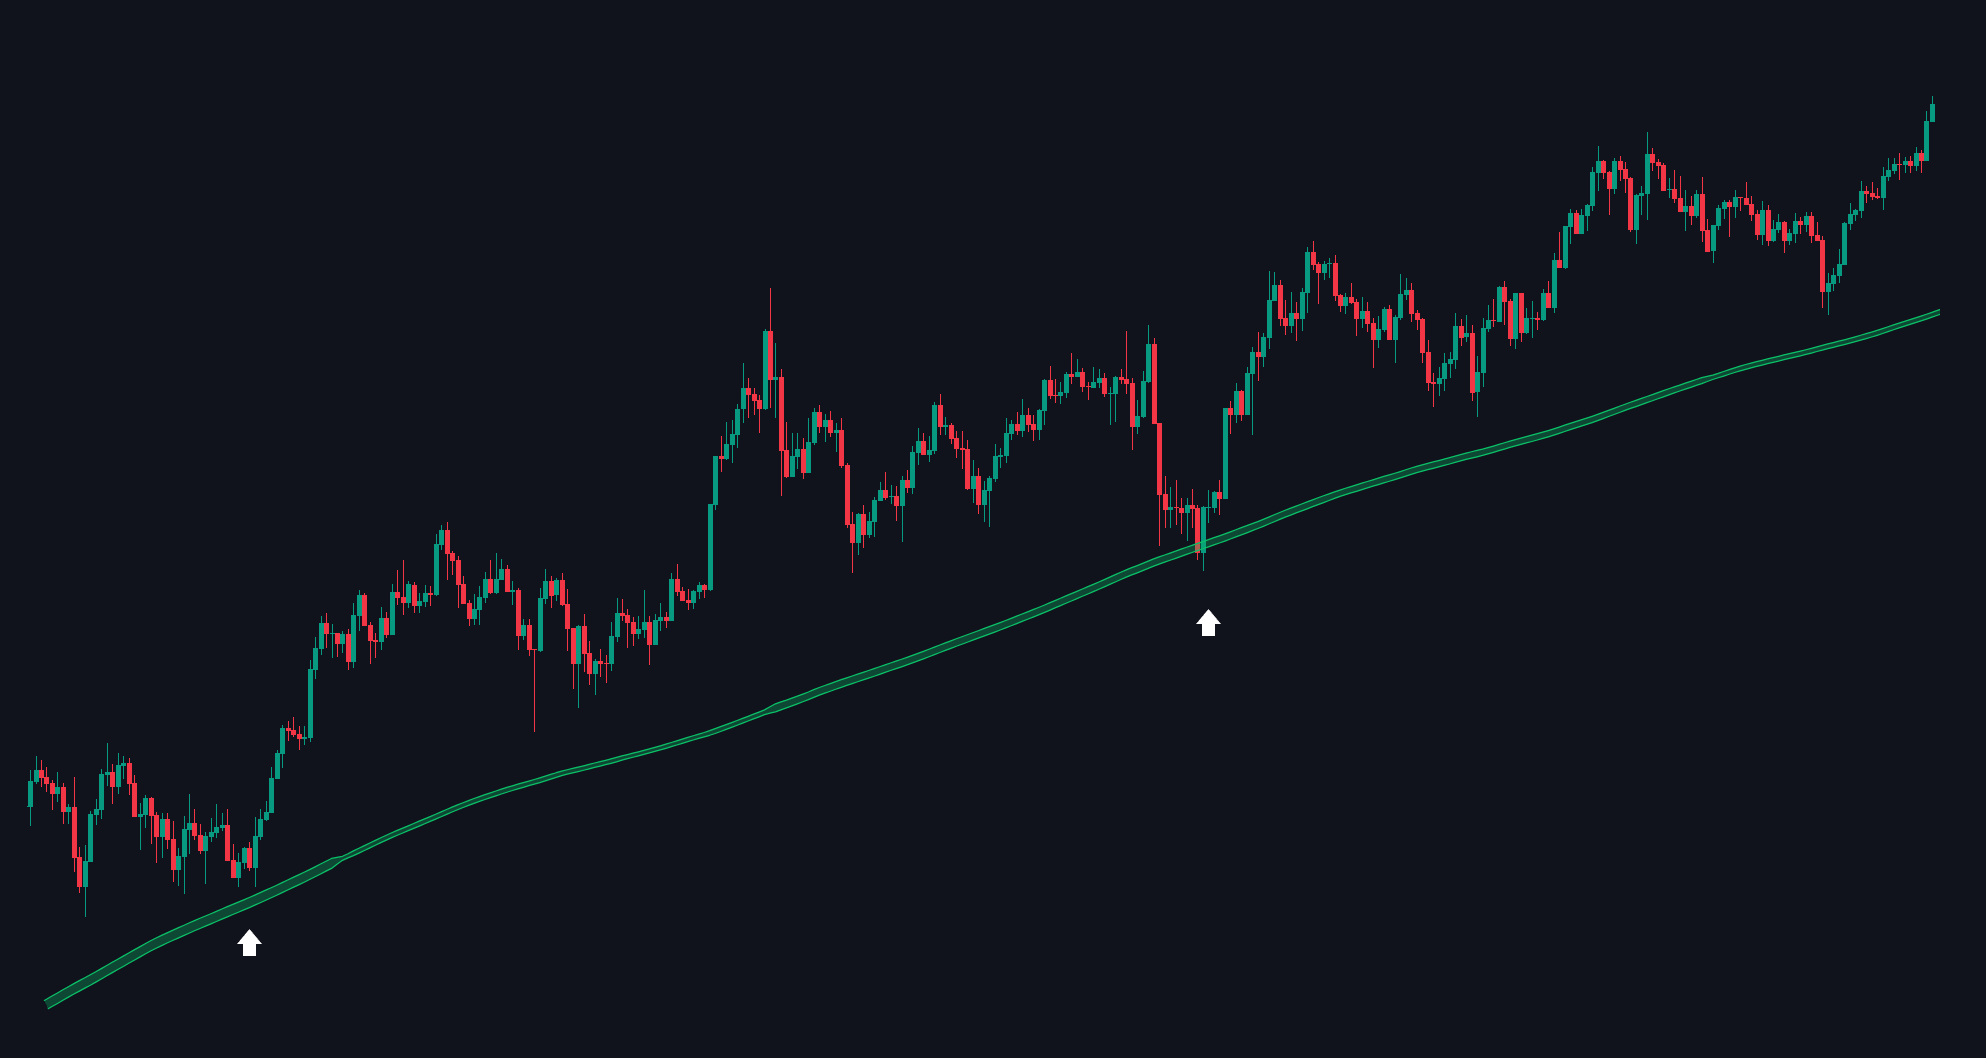
When the bands are green and trending upward without a yellow circles, it signals strong bullish momentum.
Traders might look for entry opportunities aligned with this trend, expecting continued upward movement.
Up Trend
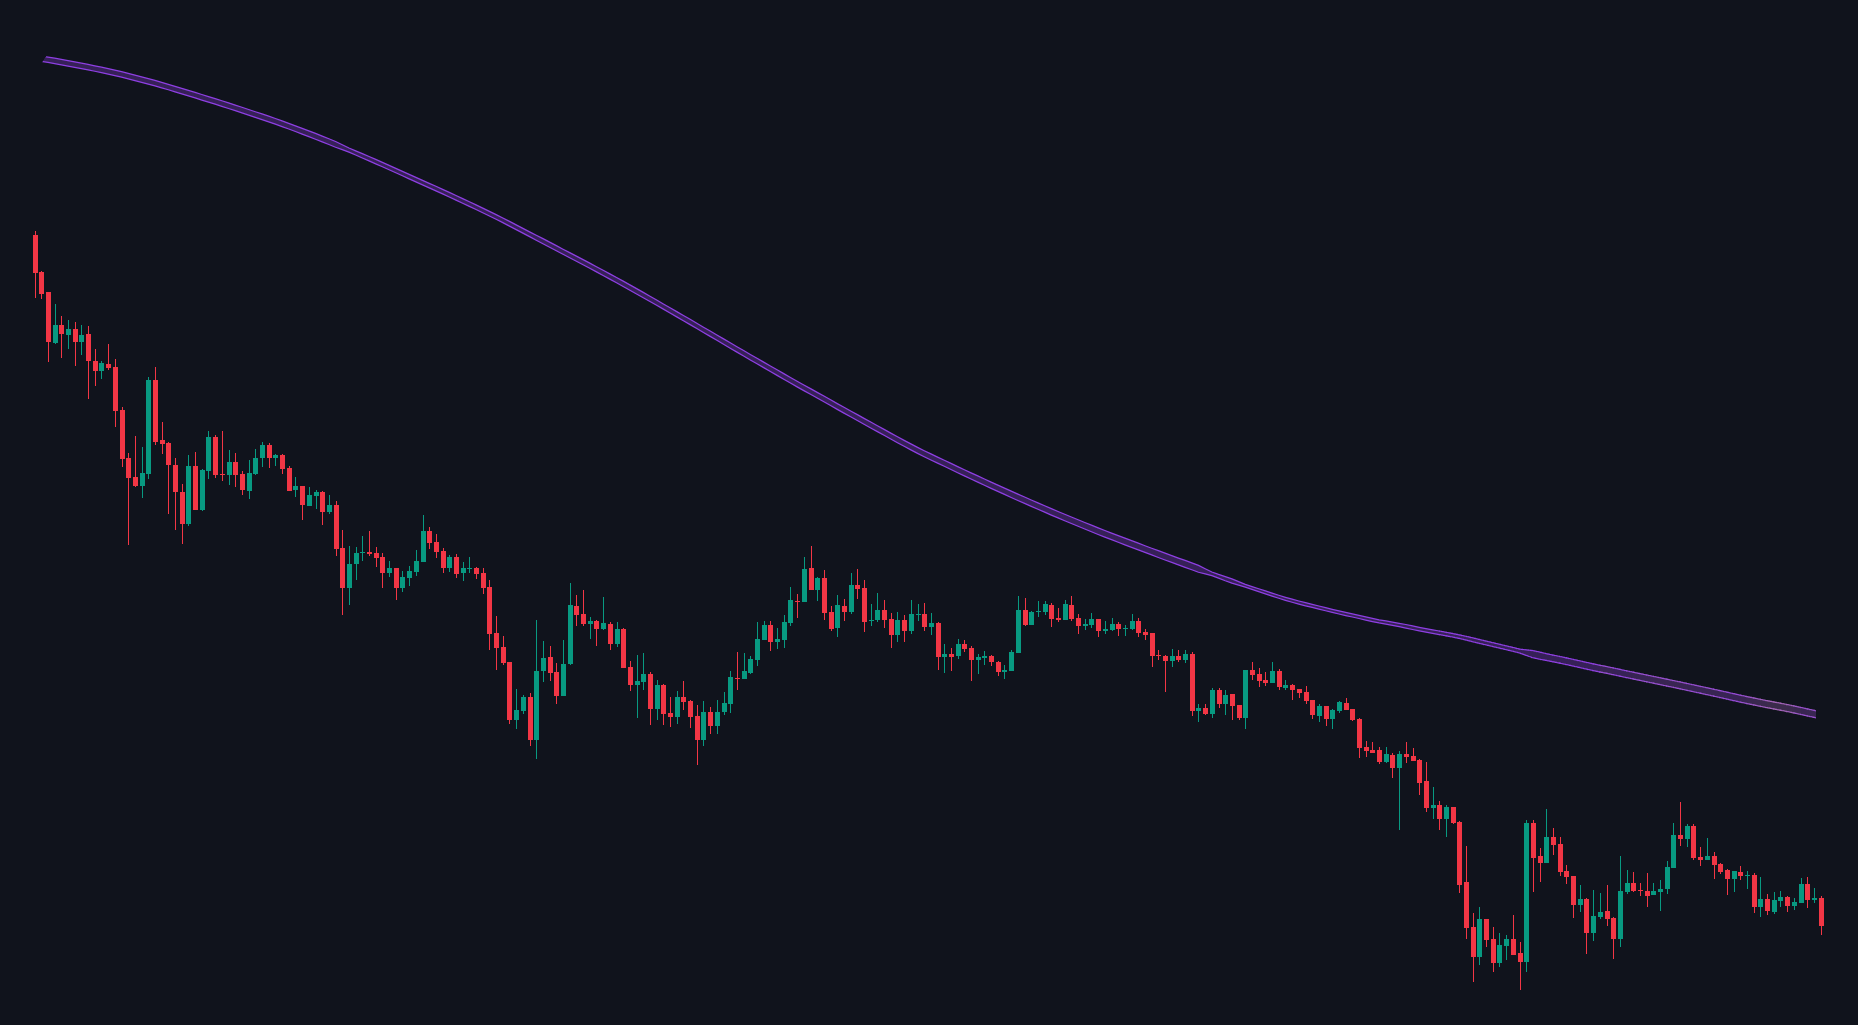
Conversely, when the bands are purple and trending down without a yellow circles, traders can consider short entries in line with the downtrend.
Down Trend
### **Momentum Weakness & Exit Signal**
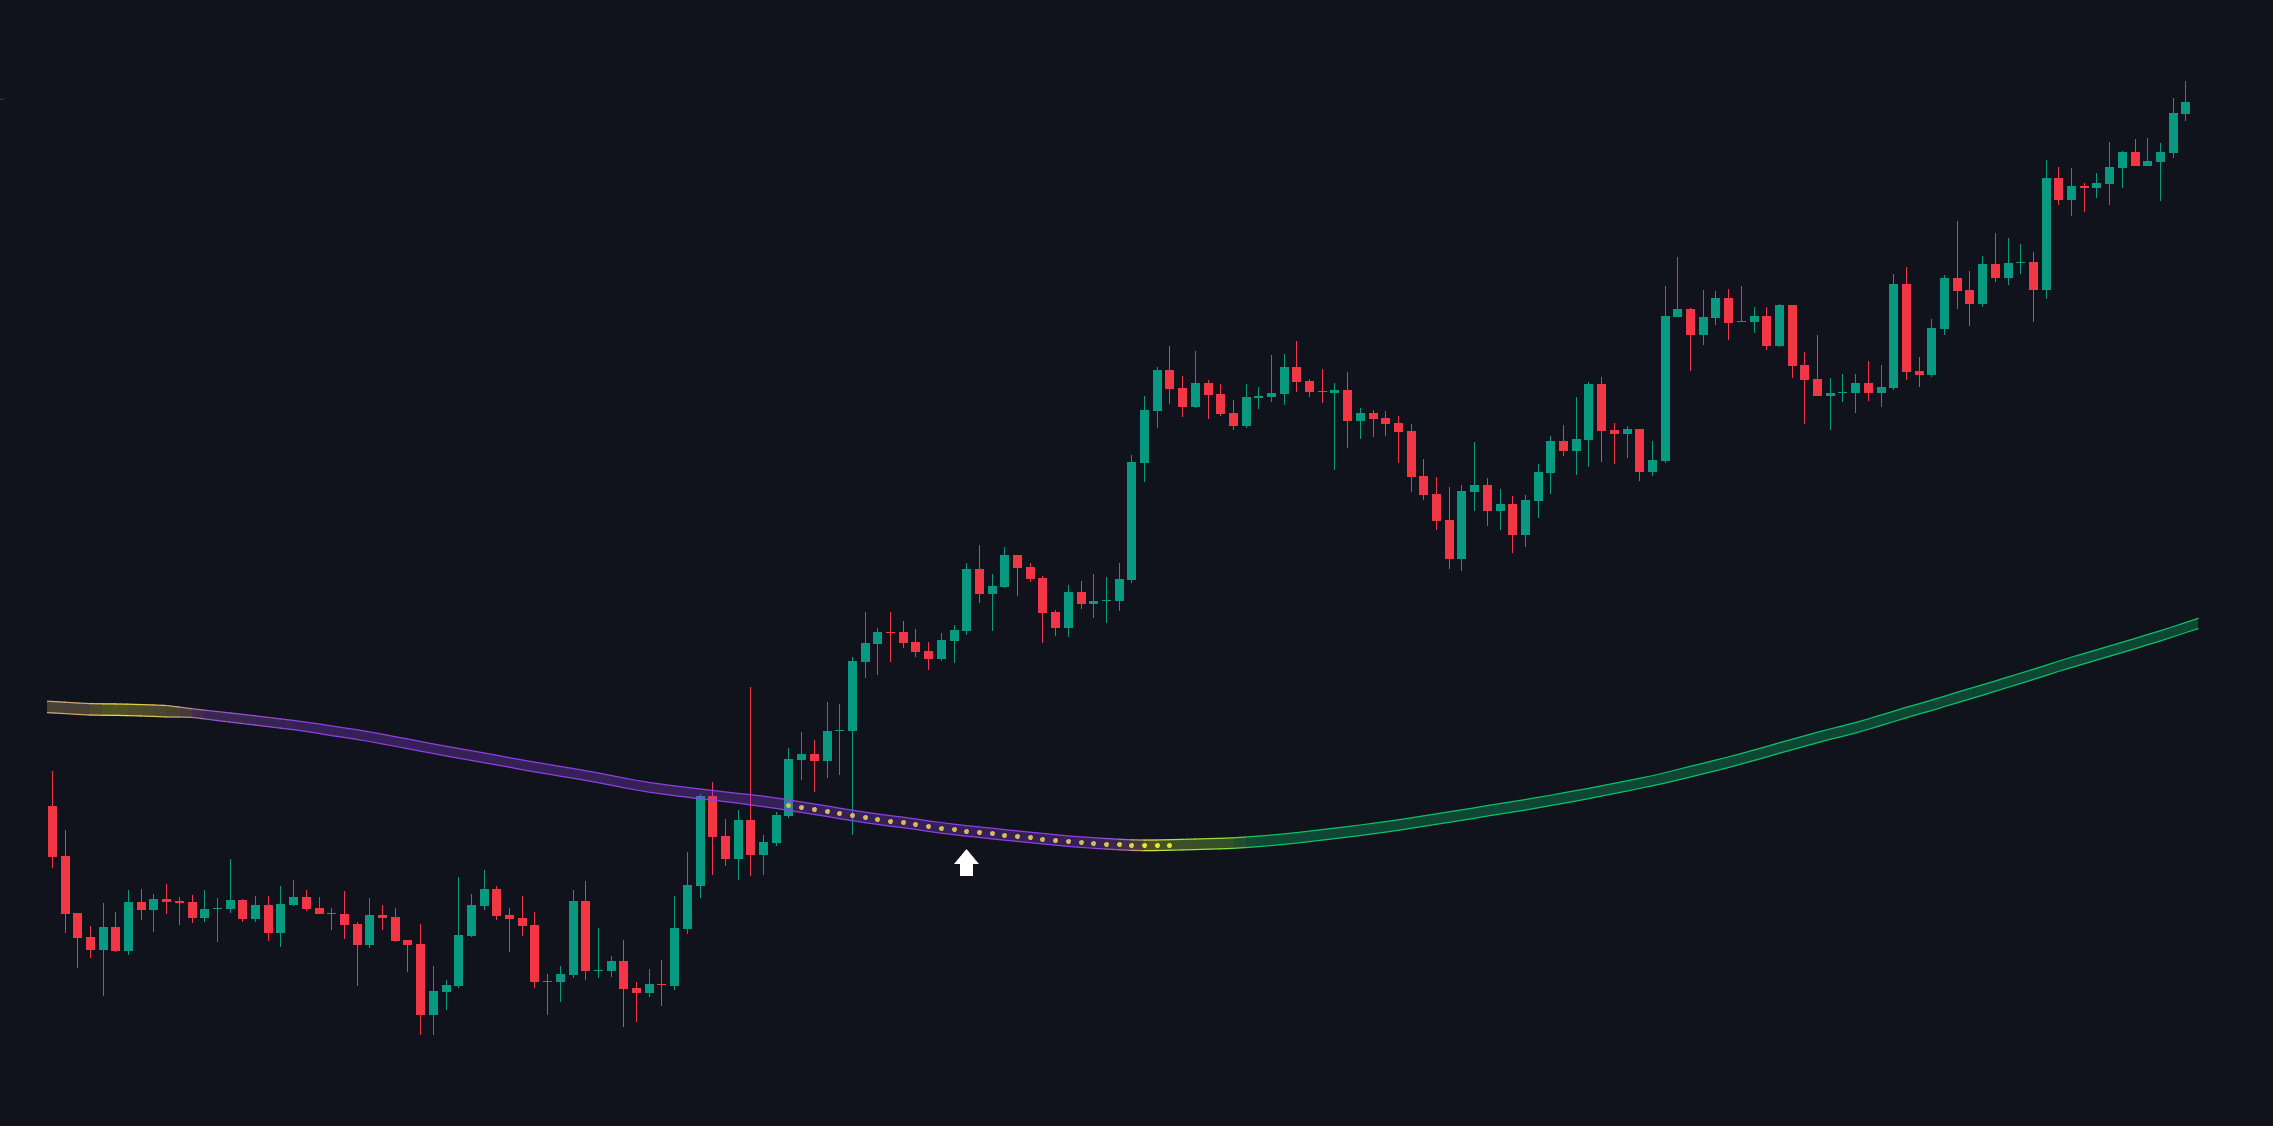
If the yellow circles appears within the bands during an uptrend, it signals weakening upward momentum.
Up Trend Shift
{% hint style="info" %}
This can serve as a caution signal for long positions, suggesting that it may be a good time to take profits or tighten stop losses.
{% endhint %}
In a downtrend, a yellow circles similarly warns of waning momentum, prompting traders to consider exiting short positions.
Down Trend Shift
##
## Settings
These settings let you control how the ActionWave displays trend direction and potential reversal points:
| Settings | Description |
| -------------- | ------------------------------------------------------------------------------------------------------------------------------------------------------------------------------------------------------------- |
| Toggle On/Off | Enables or disables the ActionWave macro trend line on the chart. |
| Color Settings |
Green: Uptrend color
Purple: Downtrend color
Yellow: Transition dots that appear when a possible trend shift is detected