> For the complete documentation index, see [llms.txt](https://docs.bigbeluga.org/llms.txt). Markdown versions of documentation pages are available by appending `.md` to page URLs; this page is available as [Markdown](https://docs.bigbeluga.org/main-toolkits/market-core-pro-tm/fair-value-gap.md).

# Fair Value Gap

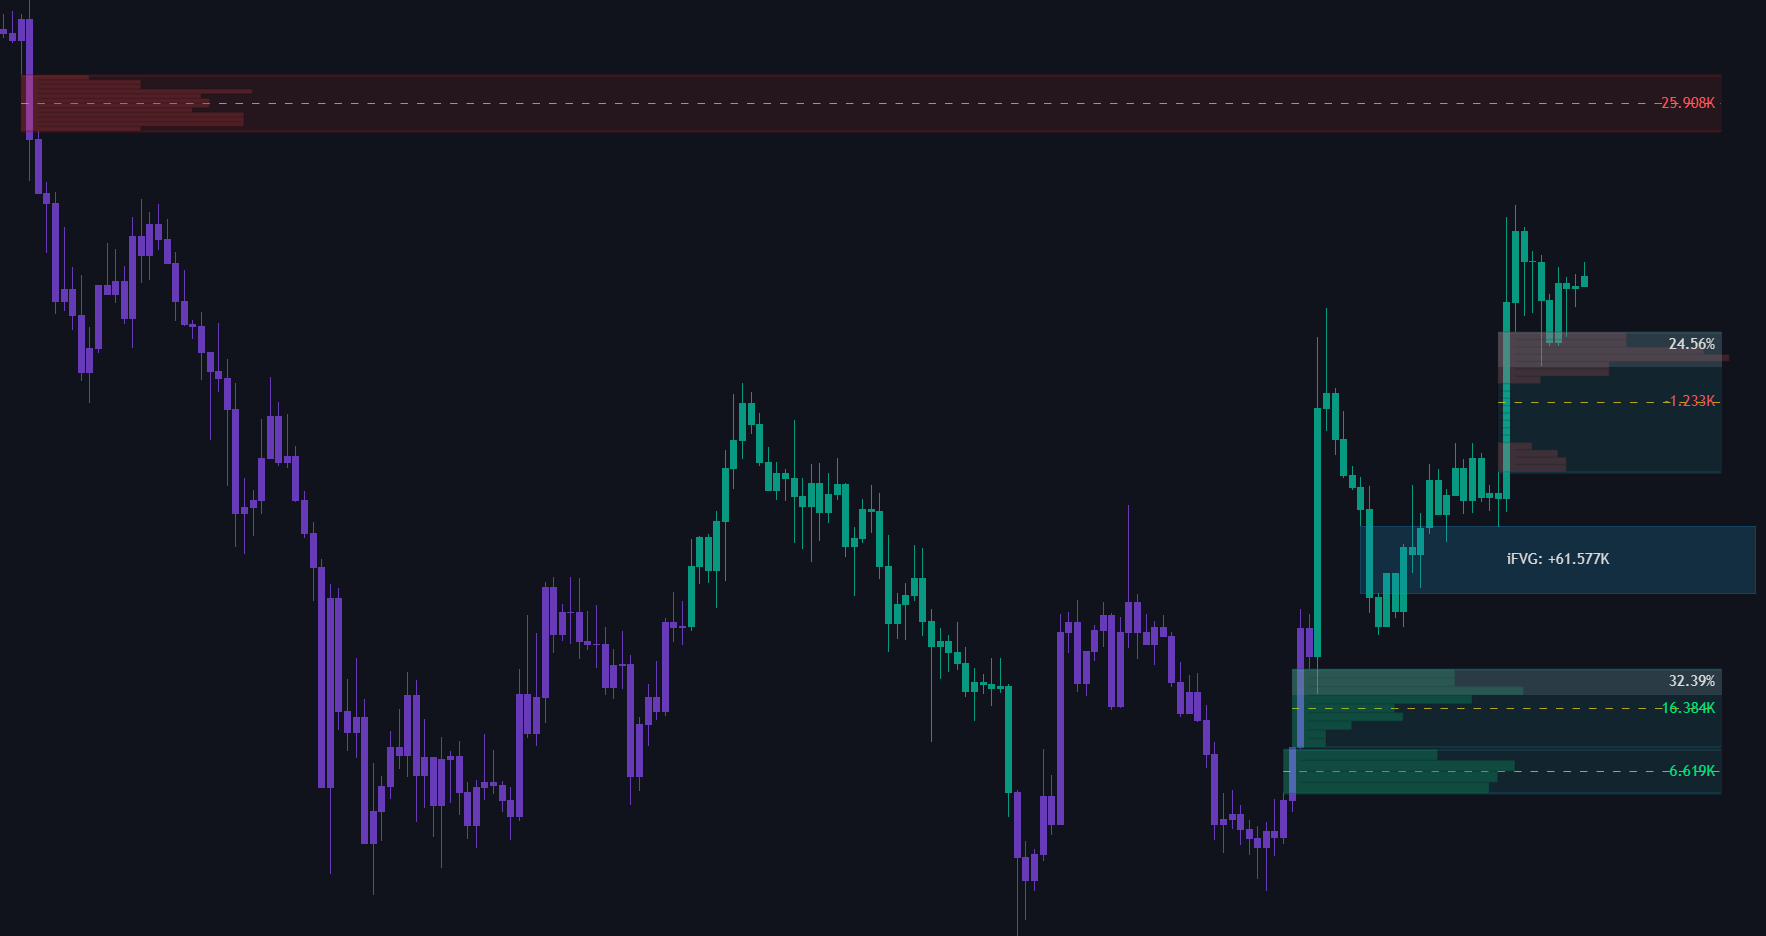
Fair Value Gaps — areas on the chart where price moved too quickly, leaving an imbalance between buyers and sellers.&#x20;

<figure><img src="/assets/c4f0af8f8b400524279f29d90eeee224640732a62f74544f5097e0051badb247.png" alt=""><figcaption></figcaption></figure>

These gaps often act as magnets, drawing price back for a potential "fill" before continuing the trend.

## Partial Fill

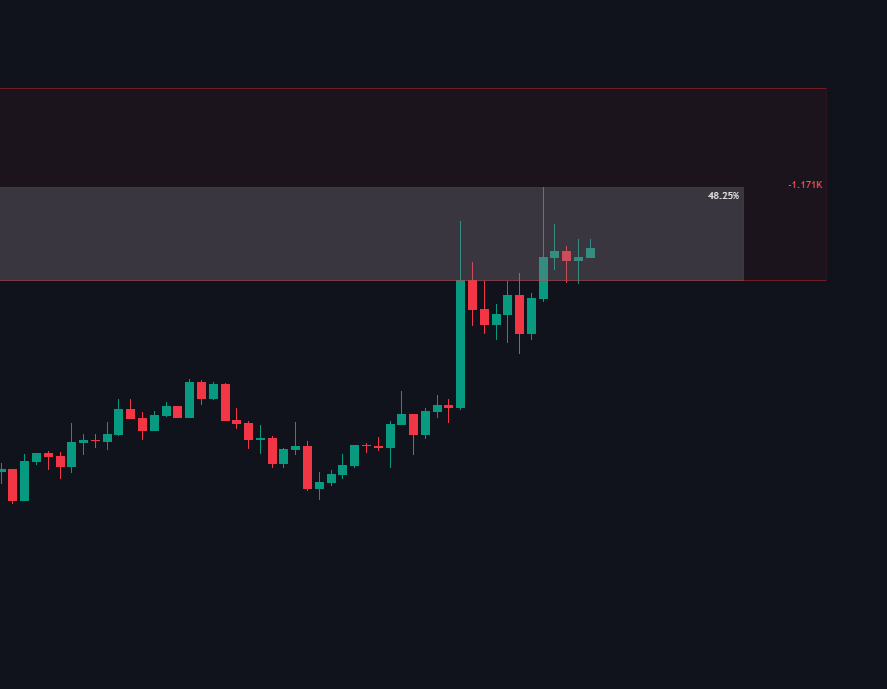
When price overlays part of the FVG, it turns gray to signal a partial fill.

Each FVG displays its filled percentage

<div align="left"><figure><img src="/assets/0b7df016666a2411dc9e234b25e3968df6b4eedb95f983087b8abc575dc3e4ed.png" alt=""><figcaption></figcaption></figure></div>

## Volume Detection

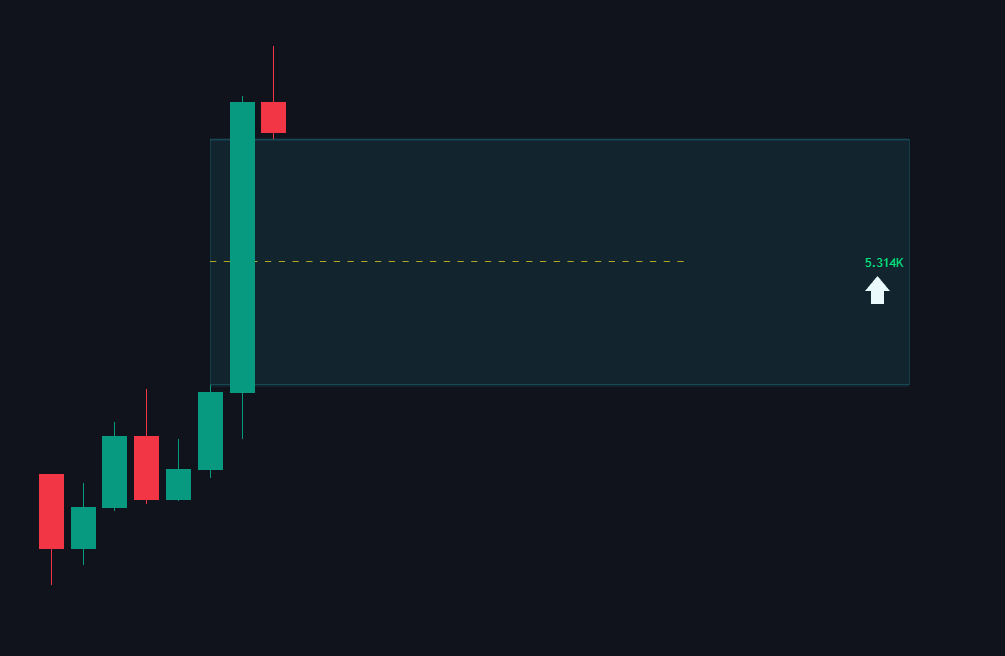
Calculates delta volume inside each FVG to highlight whether buying or selling pressure dominated during the move.

<div align="left"><figure><img src="/assets/b14172c4e087a0f7cfaba3ec2e1e63702222209c5fd6d2087cd17cd160bf9d45.png" alt="" width="563"><figcaption><p>Volume Detection</p></figcaption></figure></div>

{% hint style="info" %}
Provides a clear directional bias by showing if buyers or sellers dominated the move.
{% endhint %}

## FVG POC & Volume Profile

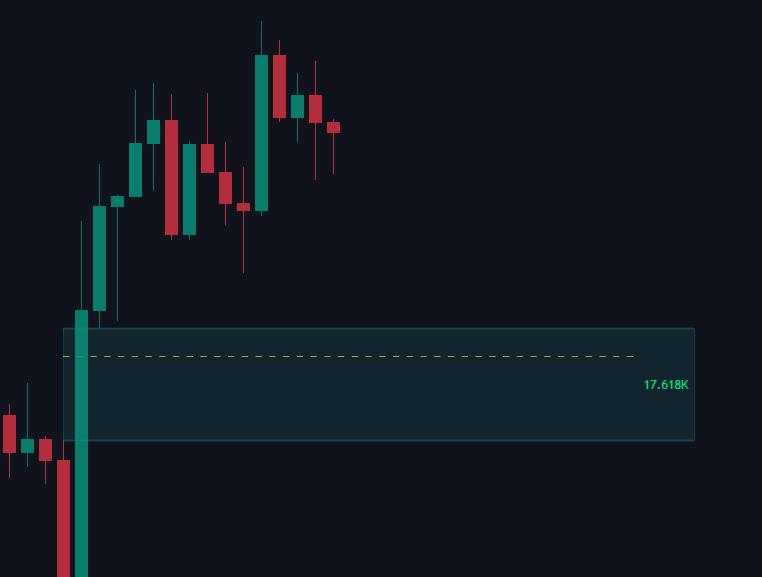
Each FVG now includes a Point of Control line that can be set to either the highest-volume price inside the gap or the mean volume level.

<div align="left"><figure><img src="/assets/67f37a945ac813e6663613f02124b0ed5793e3cfef50fc0efa1338a548241d9d.png" alt=""><figcaption><p>Highest volume line</p></figcaption></figure></div>

{% hint style="info" %}
PoC lines help detect retest signals by marking the most responsive price inside the FVG — either the mean level or the highest-volume price.
{% endhint %}

<figure><img src="/assets/00ae9748b206e2de000a0ac29e9ef9fdf12fca736bacabf51b4803de488eba97.png" alt=""><figcaption></figcaption></figure>

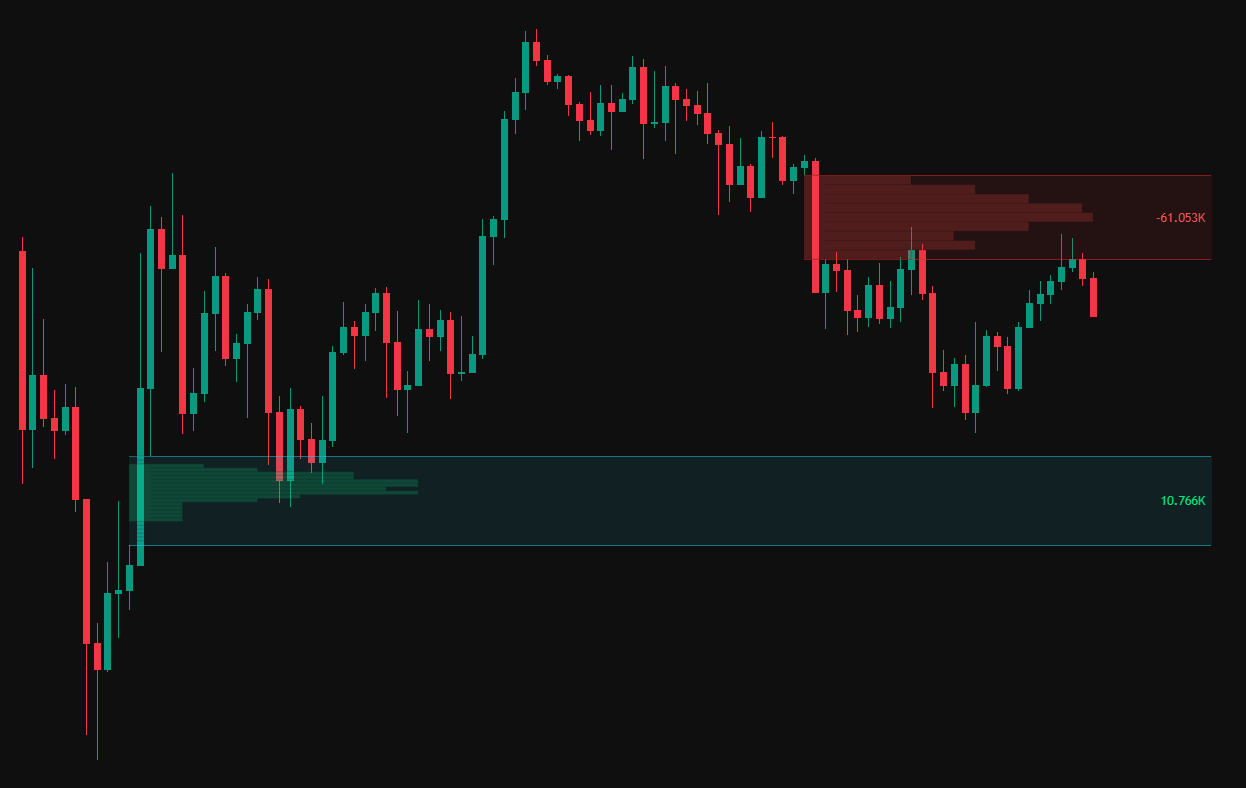
A compact volume profile can be displayed inside the FVG, showing where volume is concentrated and helping identify the most reactive level within the gap.

## Timeframe

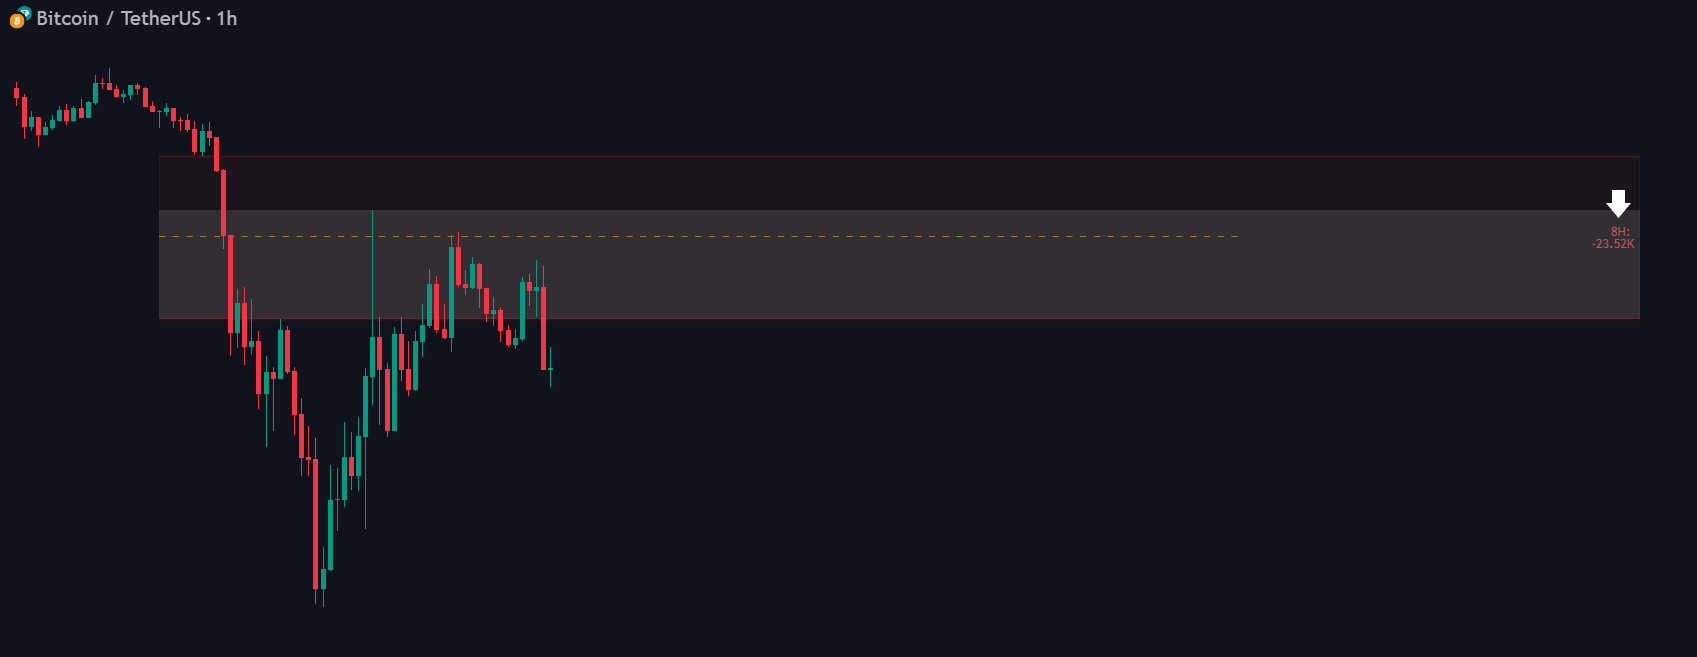
Timeframe setting allows detecting FVGs from different timeframes (e.g., higher timeframes).

<figure><img src="/assets/a9ea1bb342d51bd07c1a73f9664c9eeb8f0d69bd50138cf2350c4a93e6695f58.png" alt="Chart 1h - FVG 8h"><figcaption><p>Chart 1h - FVG 8h</p></figcaption></figure>

## Inversion FVG (Last Broken)

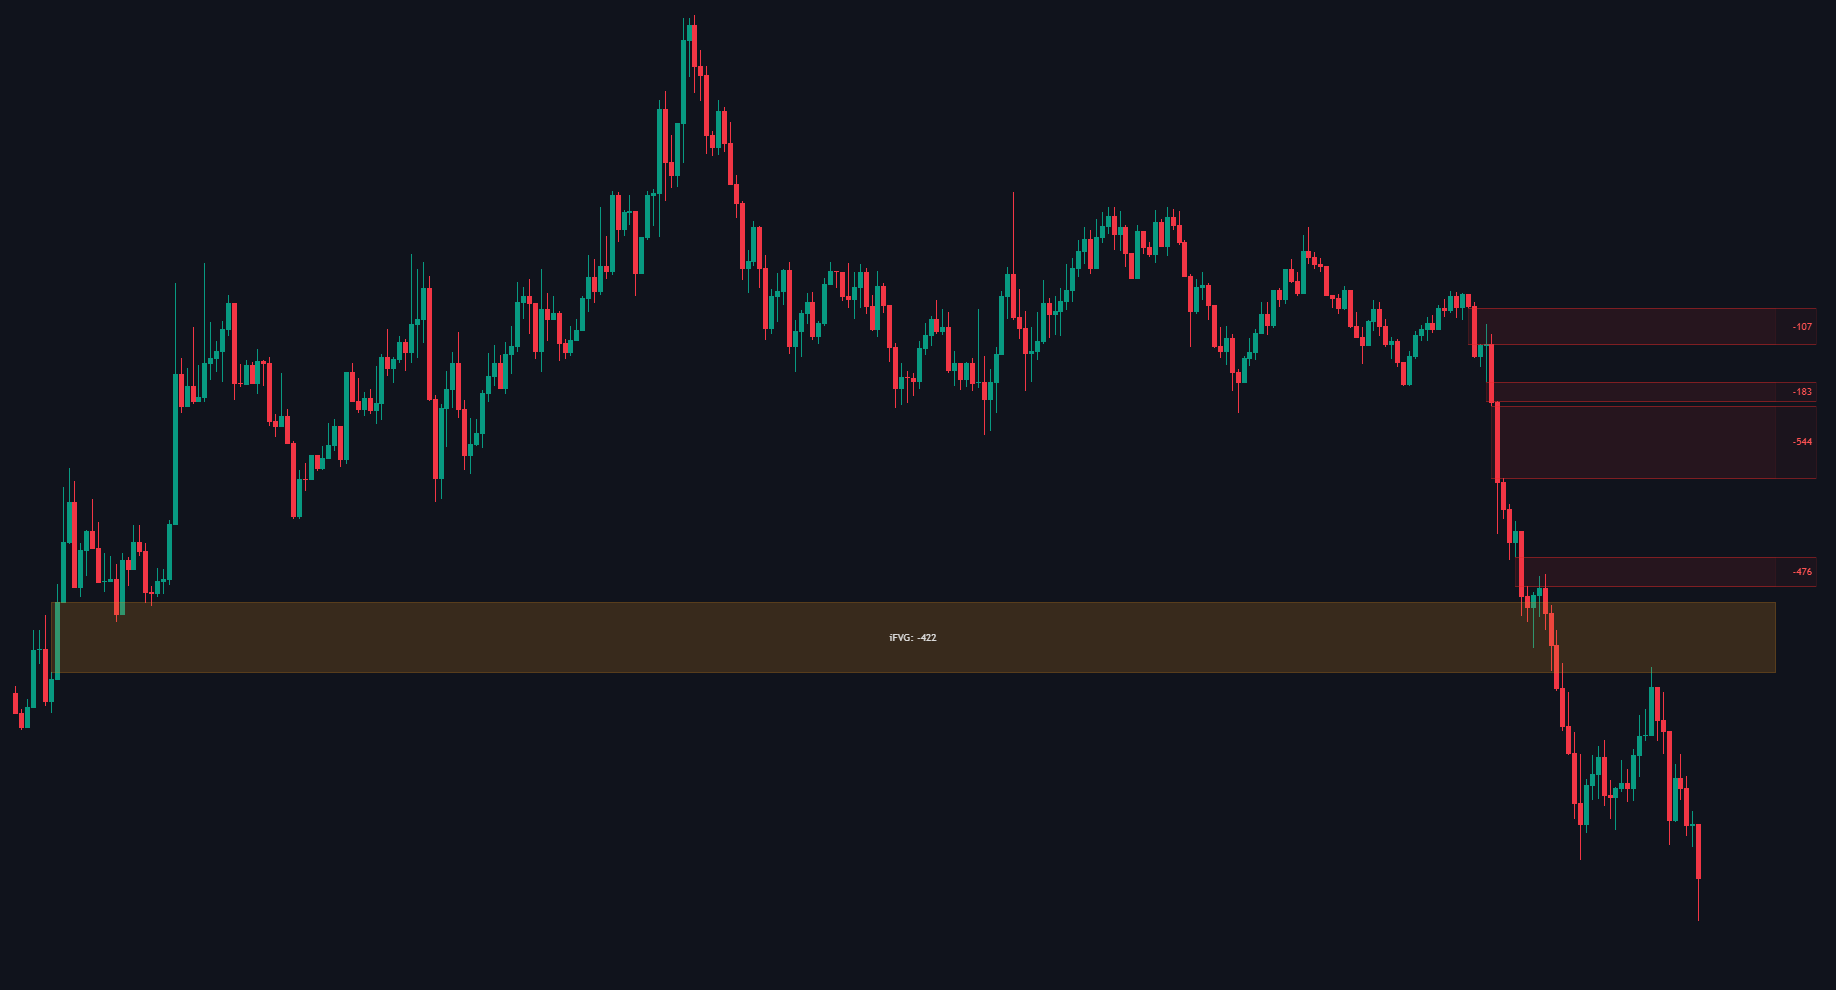
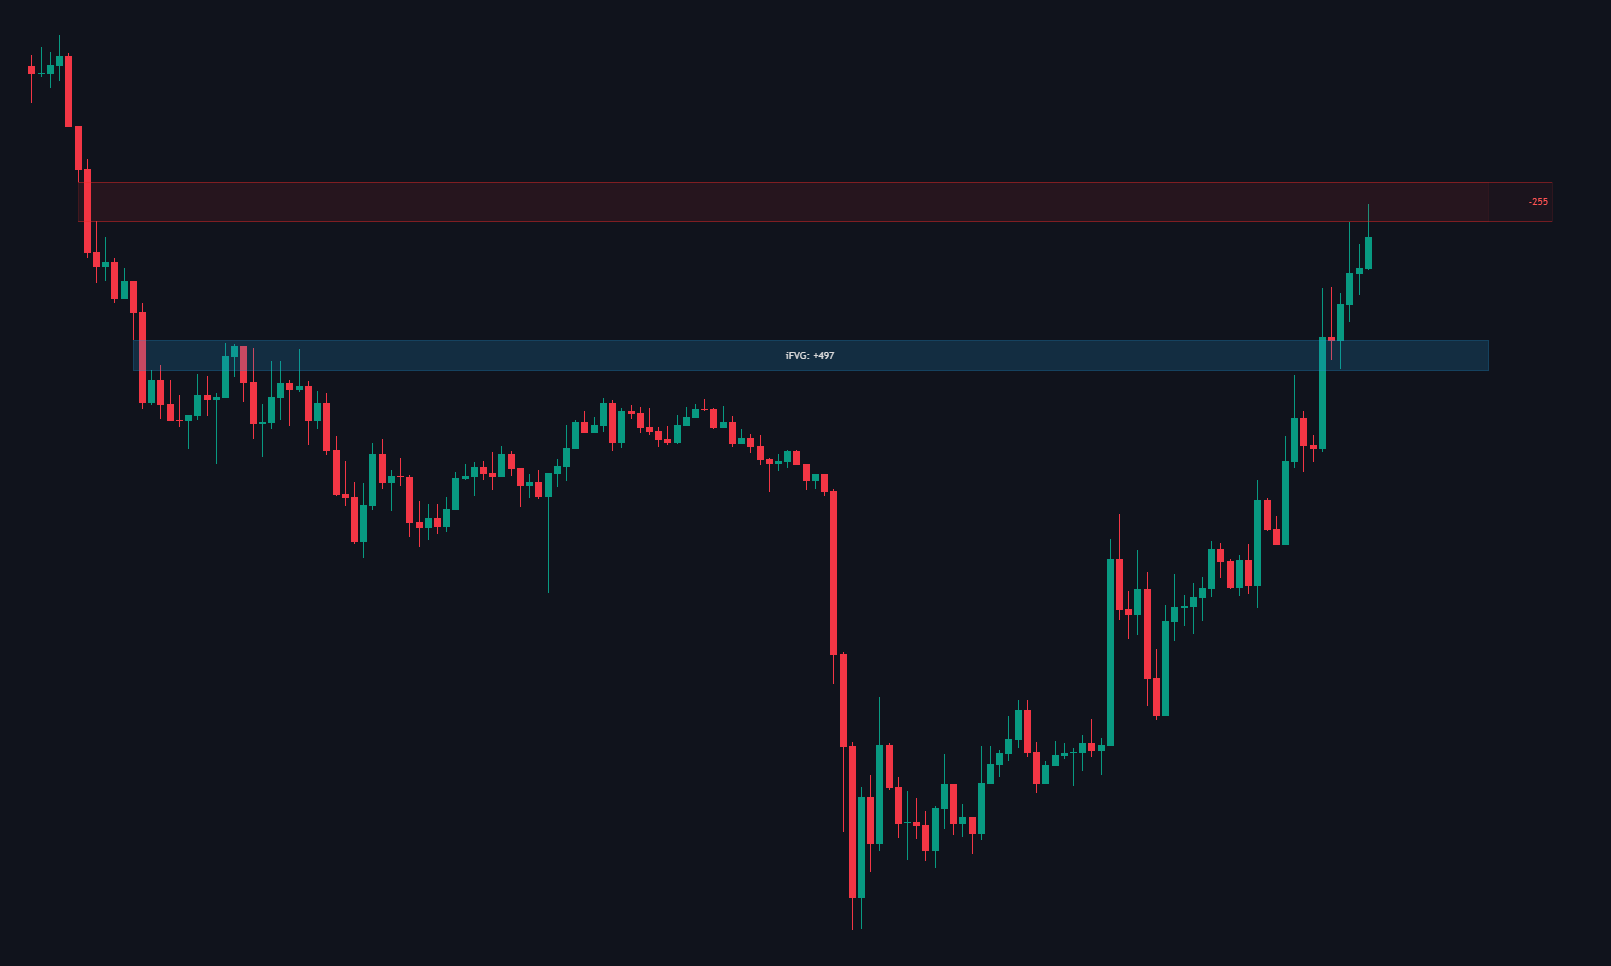
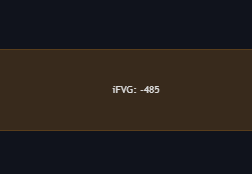
When a standard FVG is breached by a candle body wick, the indicator "flips" the zone, signaling that the previous imbalance has now become a support or resistance level for a trend reversal.

<div><figure><img src="/assets/cdf7d064543ef8e33ae7c931c4cf2d944cffd5887471eb6ec9b77c8e313a3130.png" alt=""><figcaption></figcaption></figure> <figure><img src="/assets/faced6d4a1d9eaff58e44966a620e113fa45de667d527006f3e93fc135ac7201.png" alt=""><figcaption></figcaption></figure></div>

Momentum Volume: The numerical value displayed next to the iFVG label represents the total volume at the specific moment the FVG was breached and converted into an inversion zone.

<figure><img src="/assets/08a8d1f9a14dae1427df14ddaddaffc82d08047c8d7050aa9c7684ec223c766a.png" alt=""><figcaption></figcaption></figure>

## FVG Signals (Created & Retest)

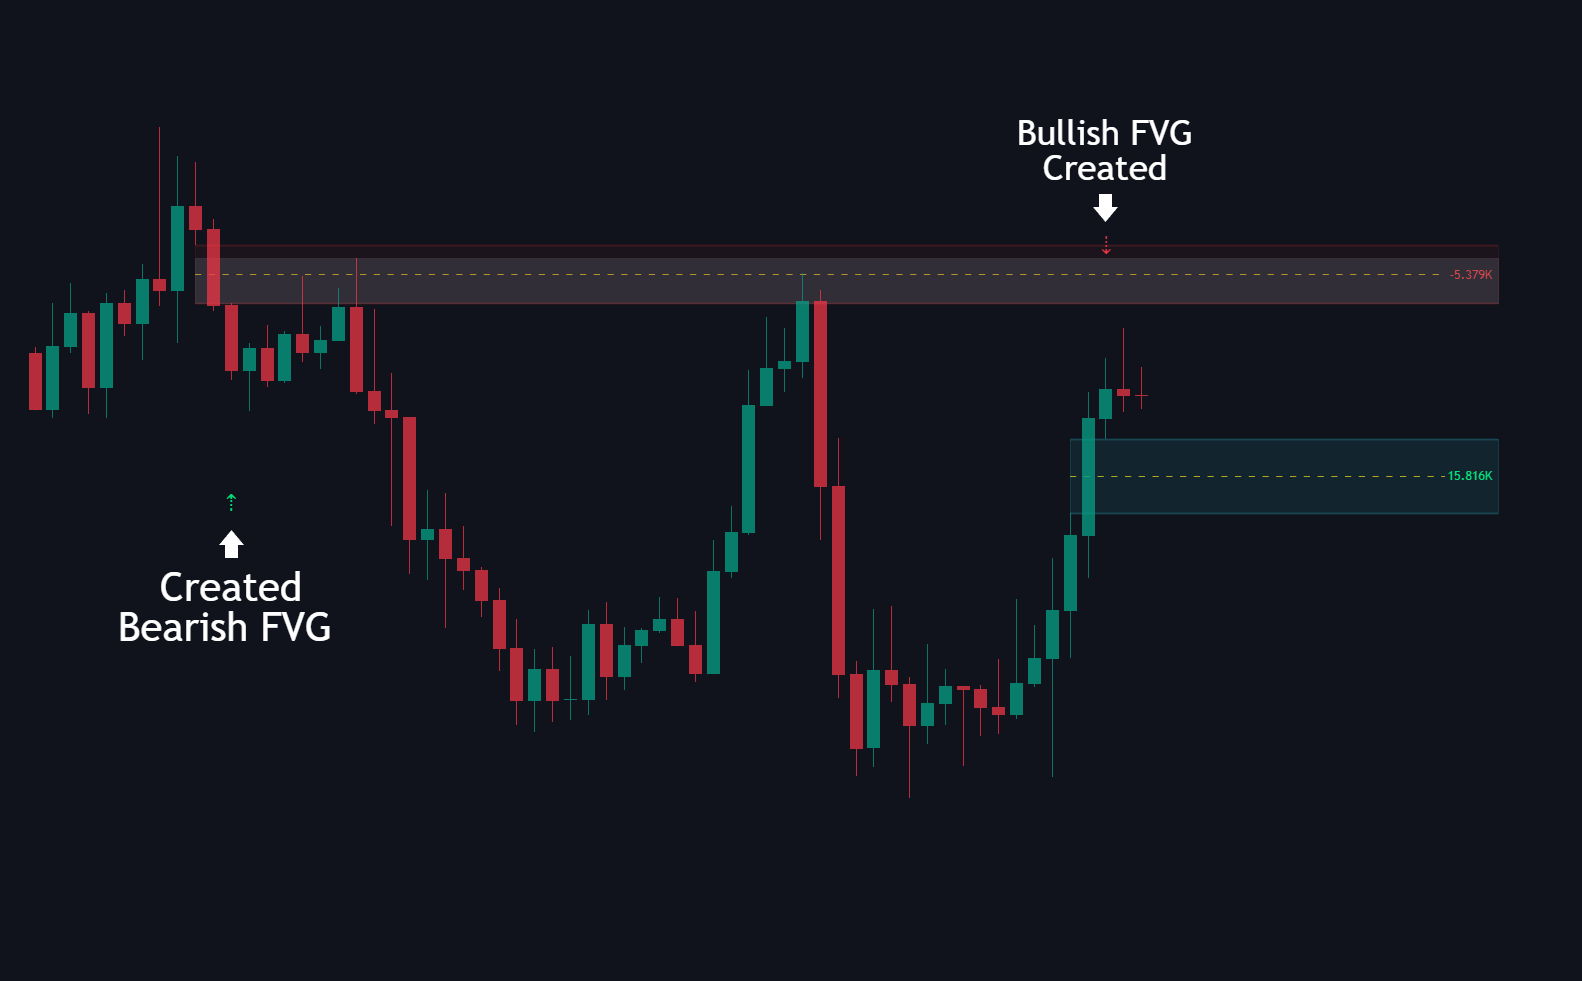
**Created:** Triggers when a new FVG forms.&#x20;

* Bullish FVG shows a small arrow down above the creation candle
* Bearish FVG shows a small arrow up below the candle.

<figure><img src="/assets/a14880c294f768b7ef670b81ff5c26cead69c2345f3e0d74915f572d4a441a19.png" alt=""><figcaption></figcaption></figure>

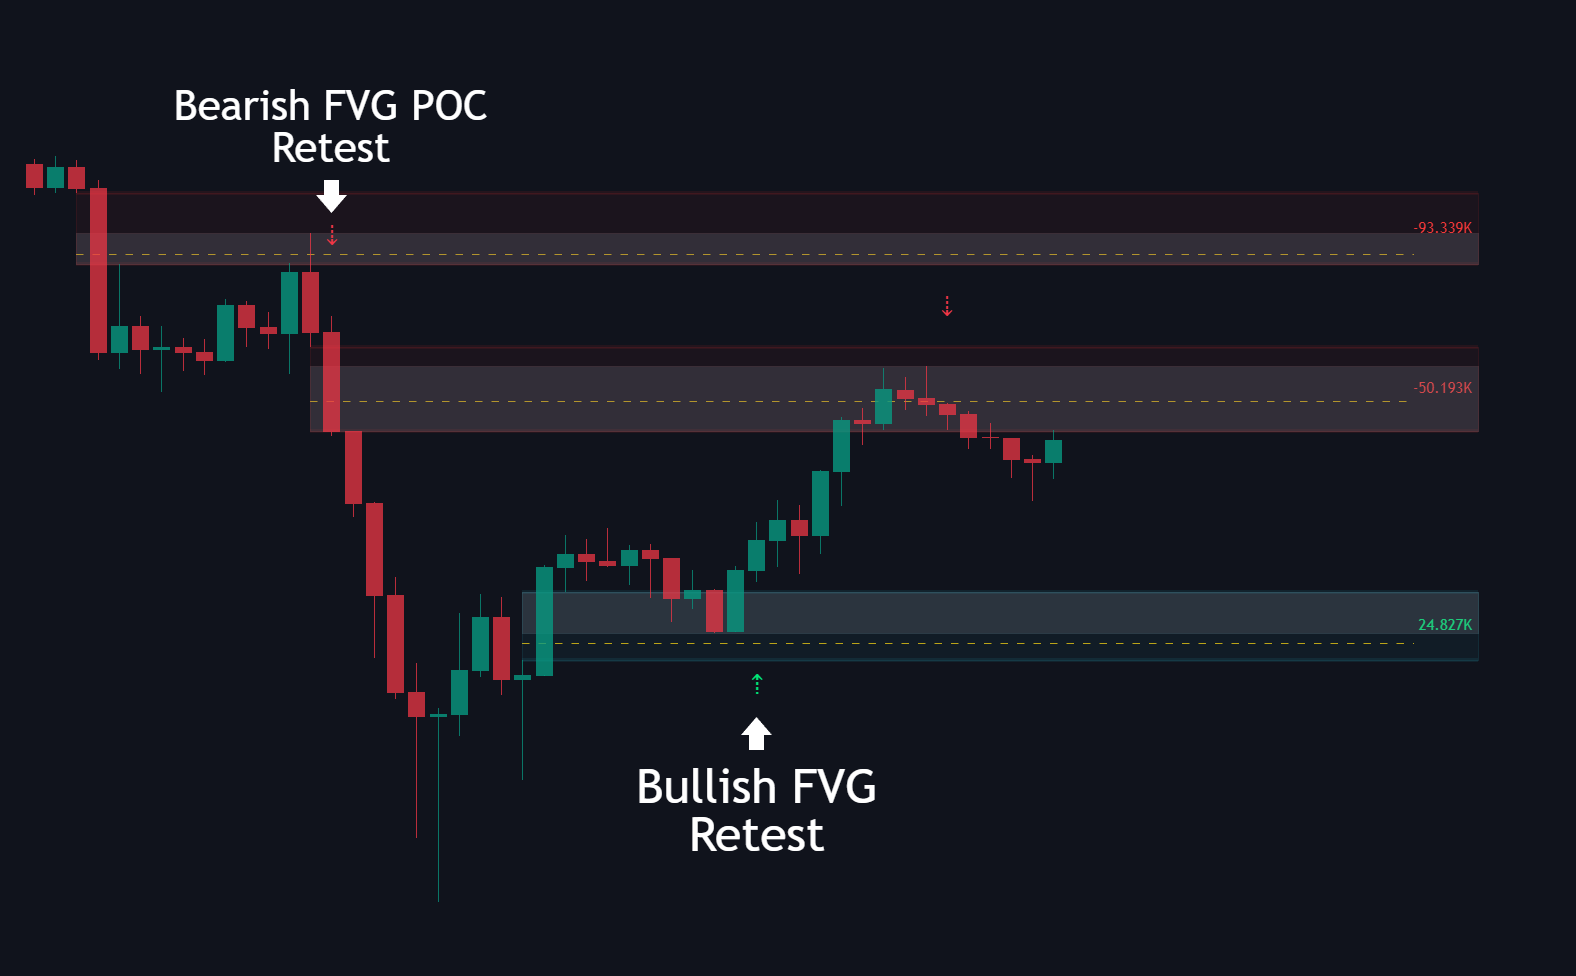
**Retest:** Triggers when price wicks back into the FVG’s POC or touches any FVG edge, highlighting potential reaction or continuation points.

<figure><img src="/assets/a2462bc87889948b5f605528e5e7158962255f4d7c1a38d79a7c554e2b786734.png" alt=""><figcaption></figcaption></figure>

## How to use

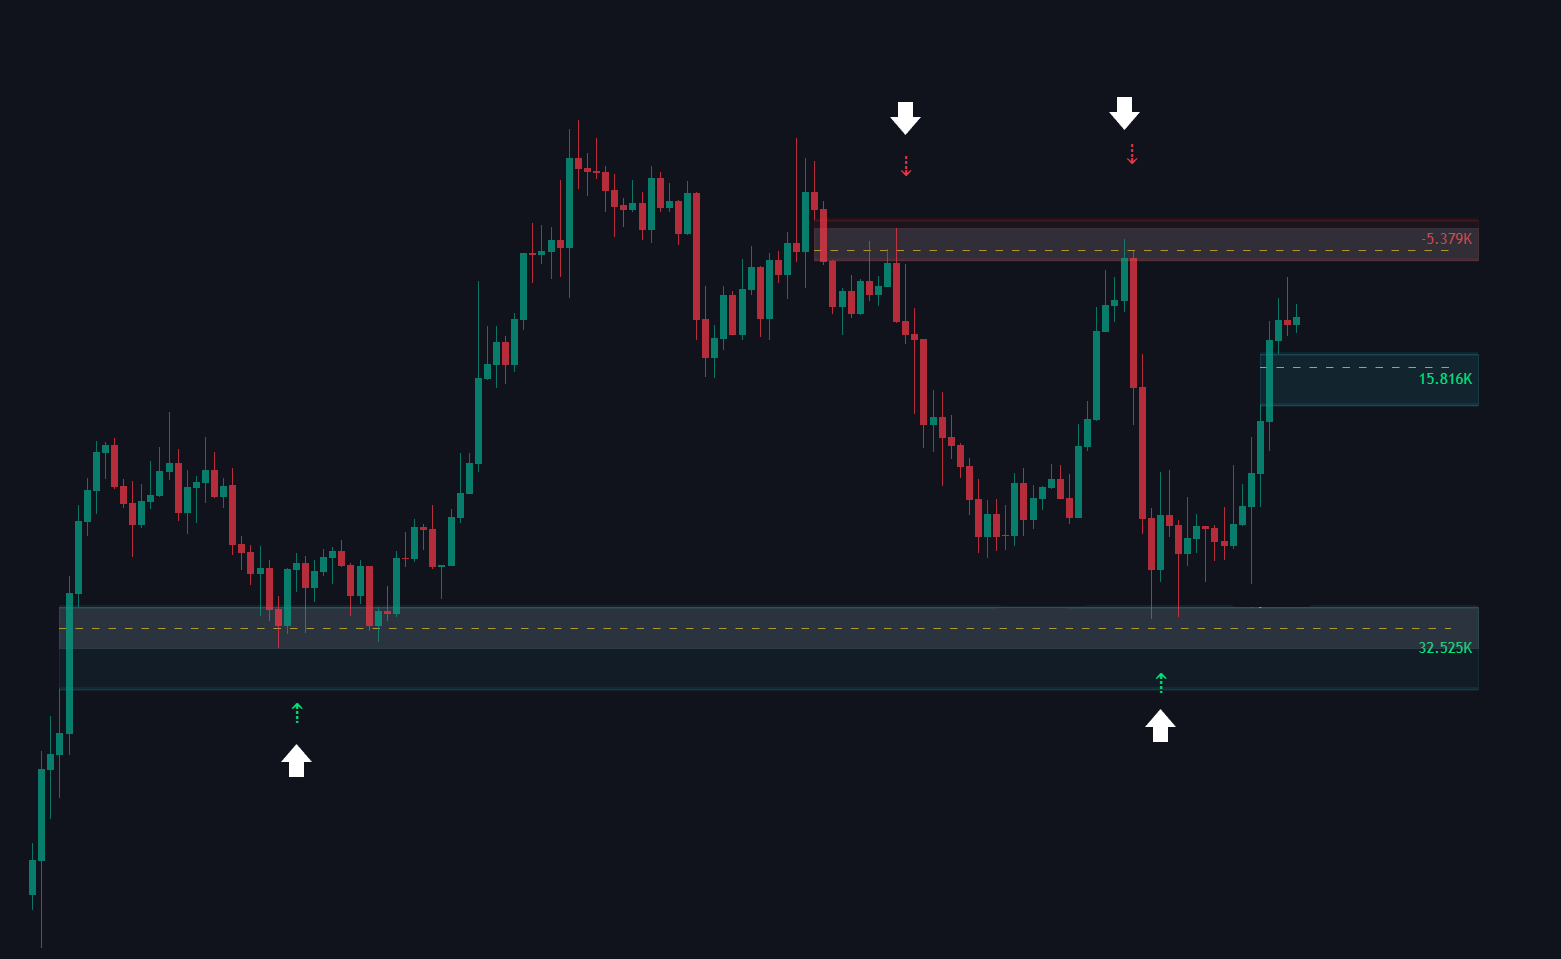
Use bullish FVGs as potential support zones.

Use bearish FVGs as resistance during pullbacks or breakdowns.

<figure><img src="/assets/bce0a09de8a1c254c8c4aa5cbdee9382fbcc8d7227a77229e1f2ce1c856f4fba.png" alt=""><figcaption></figcaption></figure>

Pay attention to volume to gauge the importance of each gap.

Use higher timeframe mode for stronger context zones.

Adjust threshold to focus on only significant gaps.

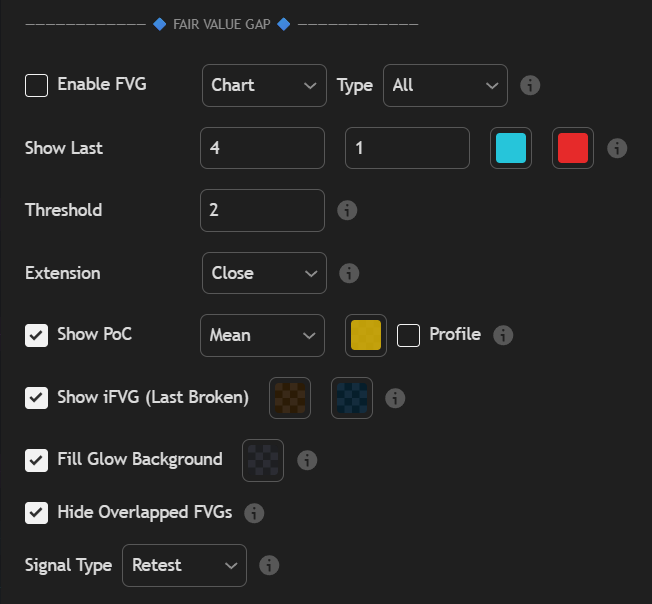
## Settings

<div align="left" data-with-frame="true"><figure><img src="/assets/4966a83b07e3931ef5dd258e6dba769f63947bcf9f4a796b669db81fe8cc76dd.png" alt=""><figcaption></figcaption></figure></div>

| Setting                                                     | Description                                                                                                                                                                                                                                                                                                                |
| ----------------------------------------------------------- | -------------------------------------------------------------------------------------------------------------------------------------------------------------------------------------------------------------------------------------------------------------------------------------------------------------------------- |
| <ul><li>Enable FVG</li><li>Timeframe</li><li>Type</li></ul> | <ul><li>Turns the Fair Value Gap module on or off.</li><li>Selects the timeframe for detection. Can follow the chart or a specific higher/lower timeframe.</li><li>Choose which categories to show: Support, Resistance, Trend <em>(Support only during up trend and Resistance during down trend)</em>, or All.</li></ul> |
| Show Last                                                   | Controls how many recent bullish and bearish FVGs are displayed on the chart.                                                                                                                                                                                                                                              |
| Threshold                                                   | Sets the minimum imbalance size required for an FVG to be drawn, filtering out noise.                                                                                                                                                                                                                                      |
| Extension                                                   | Controls how far the FVG box extends to the right to visualize open gaps.                                                                                                                                                                                                                                                  |
| Show PoC (Point of Control)                                 | Adds a POC line inside each FVG. Can be set to *Highest Volume* or *Mean*. The color box customizes the POC color. The Profile option displays a volume profile inside the FVG.                                                                                                                                            |
| Show iFVG (Last Broken)                                     | Enables Inversion FVGs. When an FVG is breached by a candle body, the zone "flips" and changes color to signal a trend reversal.                                                                                                                                                                                           |
| Fill Glow BackGround                                        | Adds a soft glow with % filled to the FVG area for better visibility of filled gap zone.                                                                                                                                                                                                                                   |
| Hide Overlapped FVG                                         | Removes overlapping gaps to keep the chart clean and display only distinct zones.                                                                                                                                                                                                                                          |
| FVG Signals                                                 | Provides alerts for Created (new gap formed) or Retest (price touches the gap or POC).                                                                                                                                                                                                                                     |