> For the complete documentation index, see [llms.txt](https://docs.bigbeluga.org/llms.txt). Markdown versions of documentation pages are available by appending `.md` to page URLs; this page is available as [Markdown](https://docs.bigbeluga.org/main-toolkits/market-core-pro-tm/chart-patterns.md).
# Chart Patterns
The **Chart Patterns** in the **Market Core Toolkit** offers advanced tools for recognizing and leveraging channels and wedges, two fundamental patterns in technical analysis.
## Channels
The **Channels and Breakouts** feature helps traders spot price consolidation phases and prepare for potential explosive moves.
Channels are drawn automatically by connecting local highs and lows into parallel trendlines, forming a defined trading range.
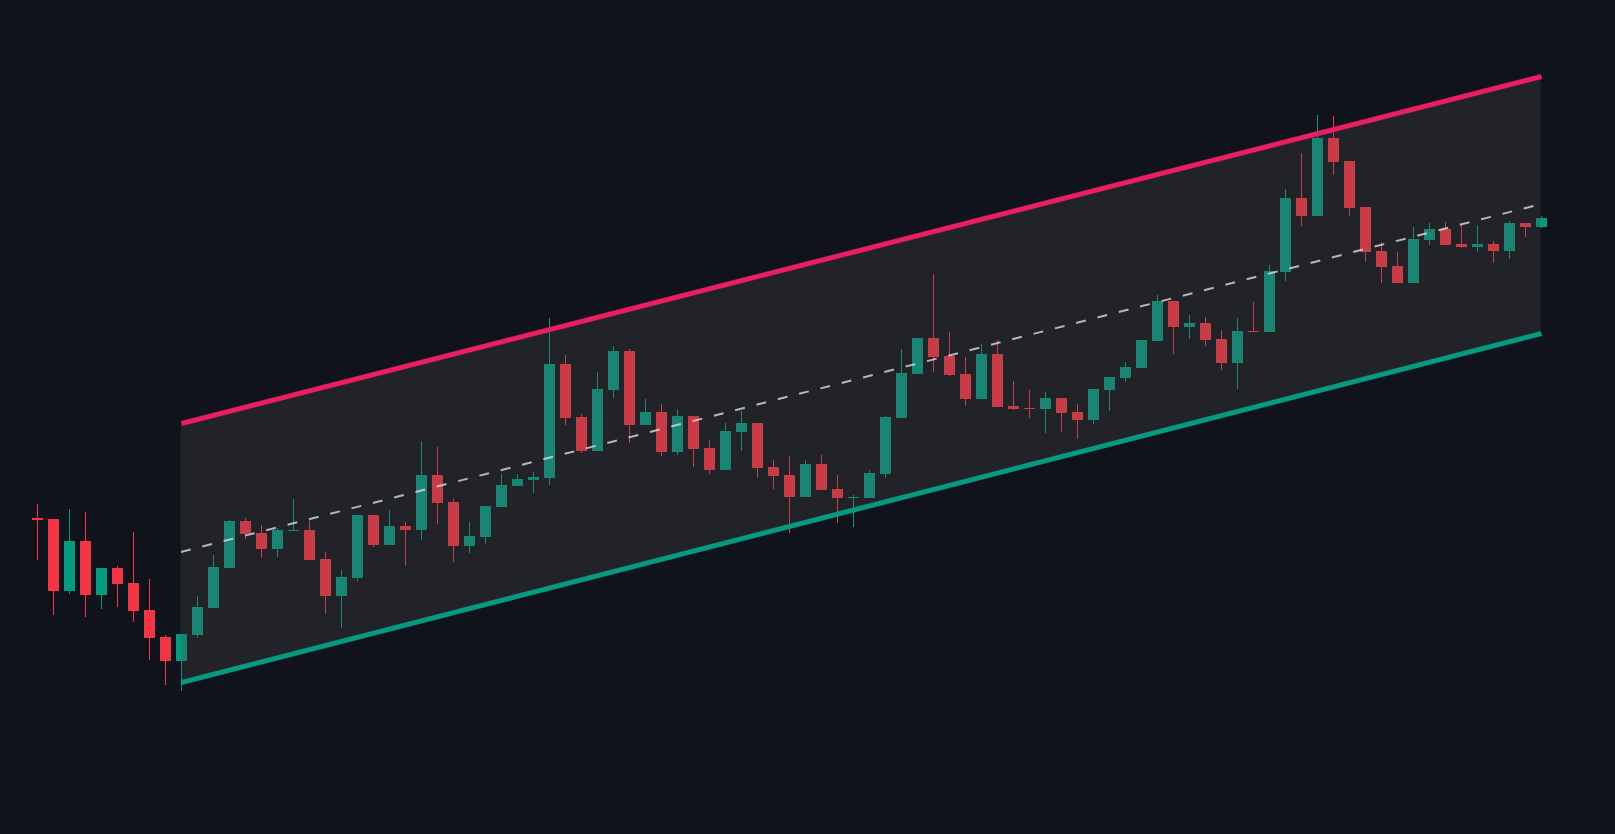
### **Ascending Channel**:
Characterized by higher highs and higher lows, indicating a bullish trend.
Ascending Channel
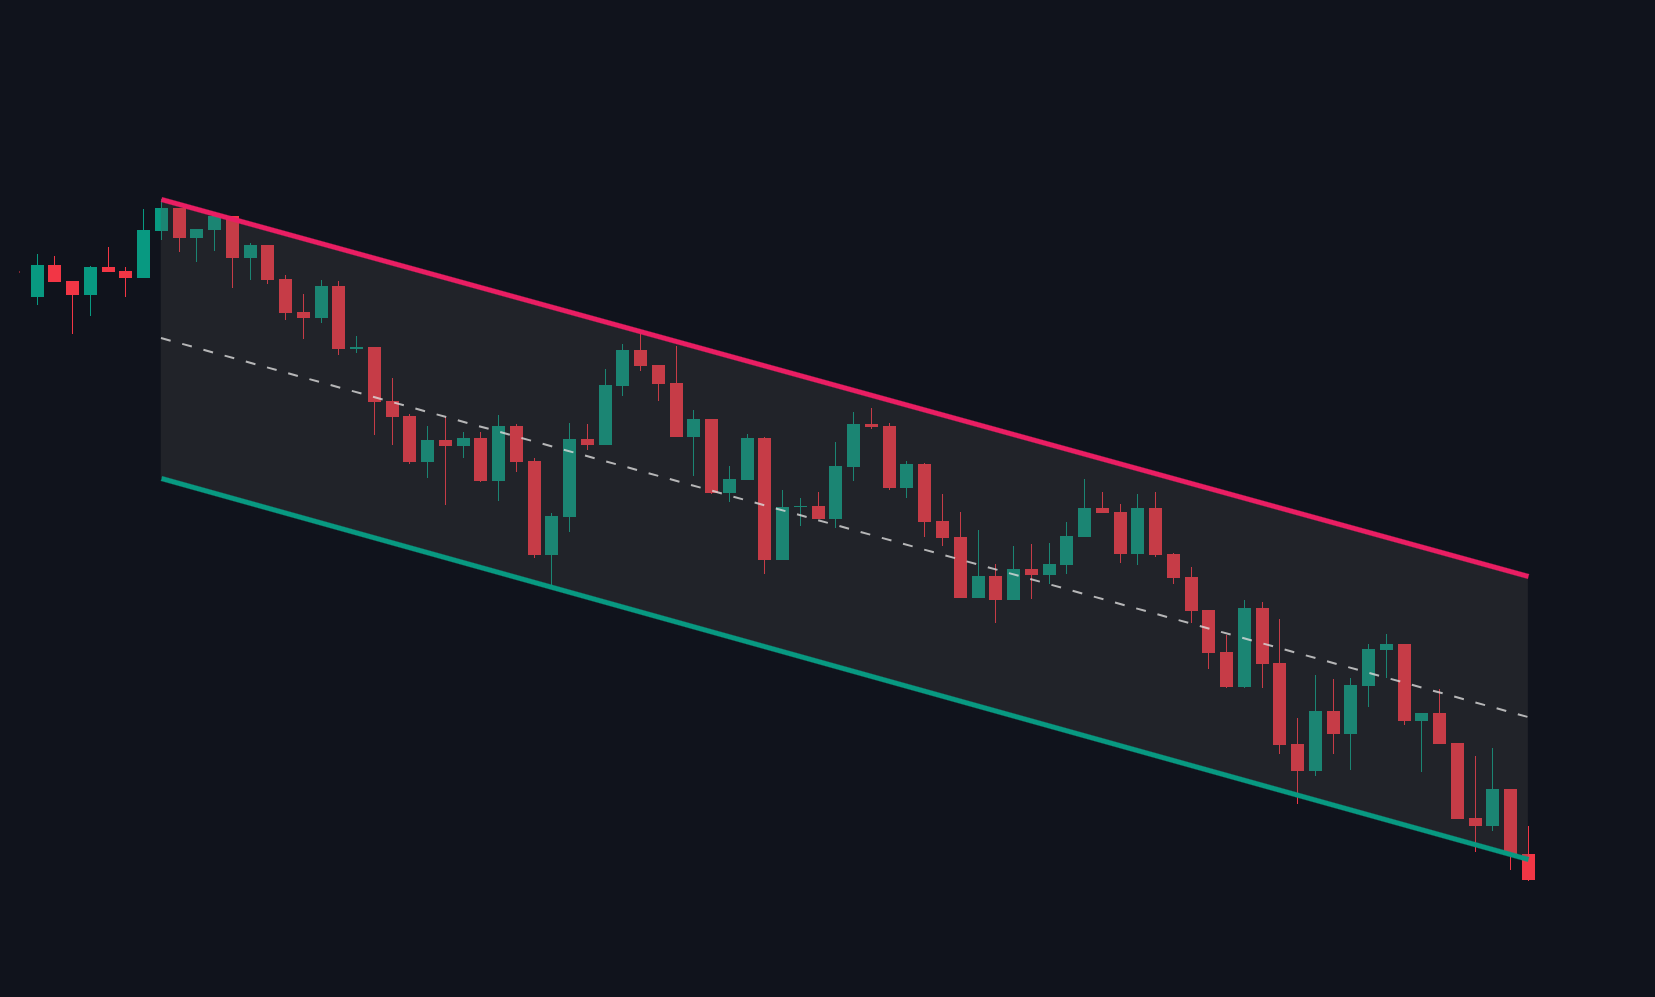
### **Descending Channel**:
Characterized by lower highs and lower lows, indicating a bearish trend.
## **Breakouts**
A breakout occurs when the price moves beyond the established channel boundaries, signaling a potential shift in trend.
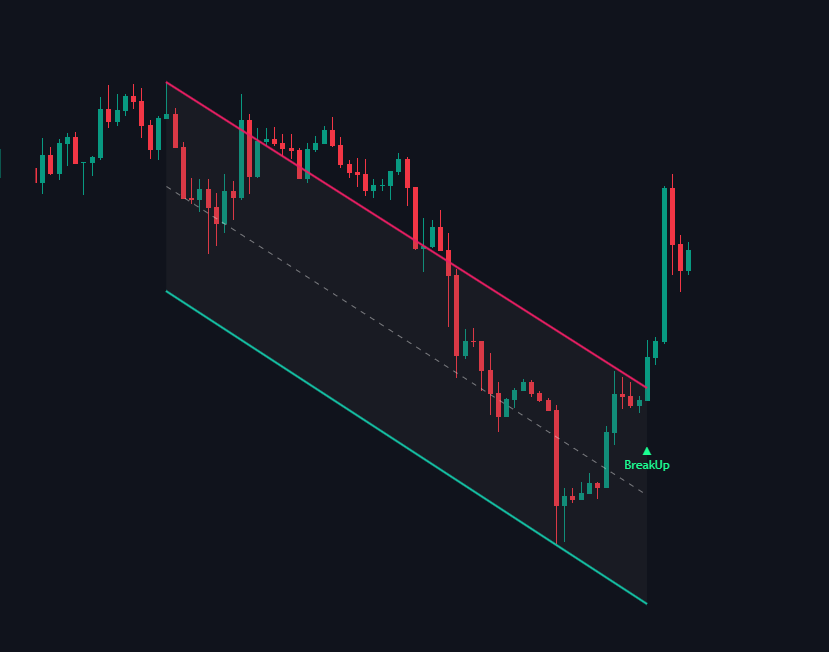
### **Break Up**
Suggests a continuation or acceleration of an uptrend.
Break Up
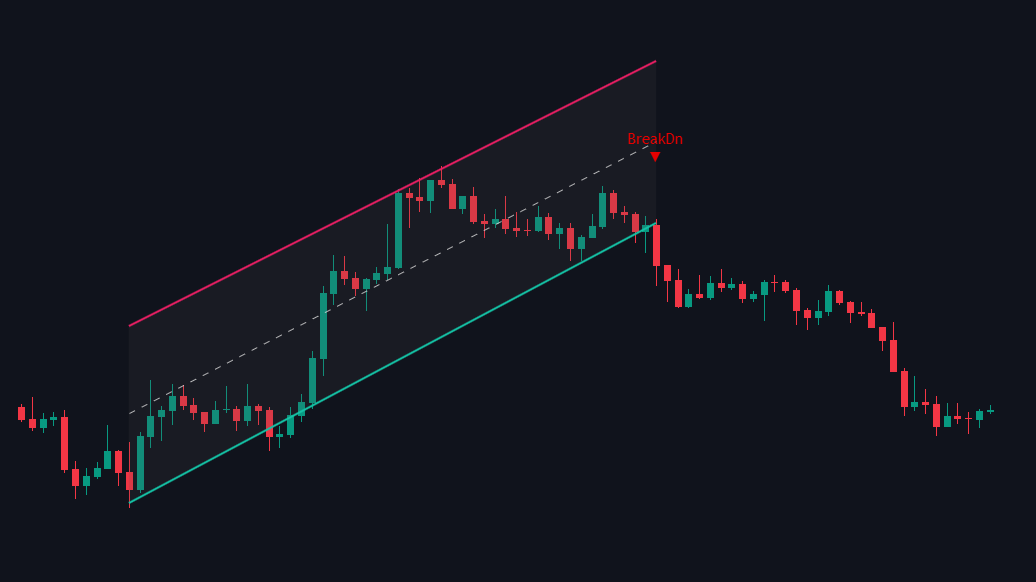
### **Break Down**
Indicates a potential reversal or acceleration of a downtrend
{% hint style="info" %}
Combining channel analysis with other technical indicators can enhance the reliability of trading signals.
{% endhint %}
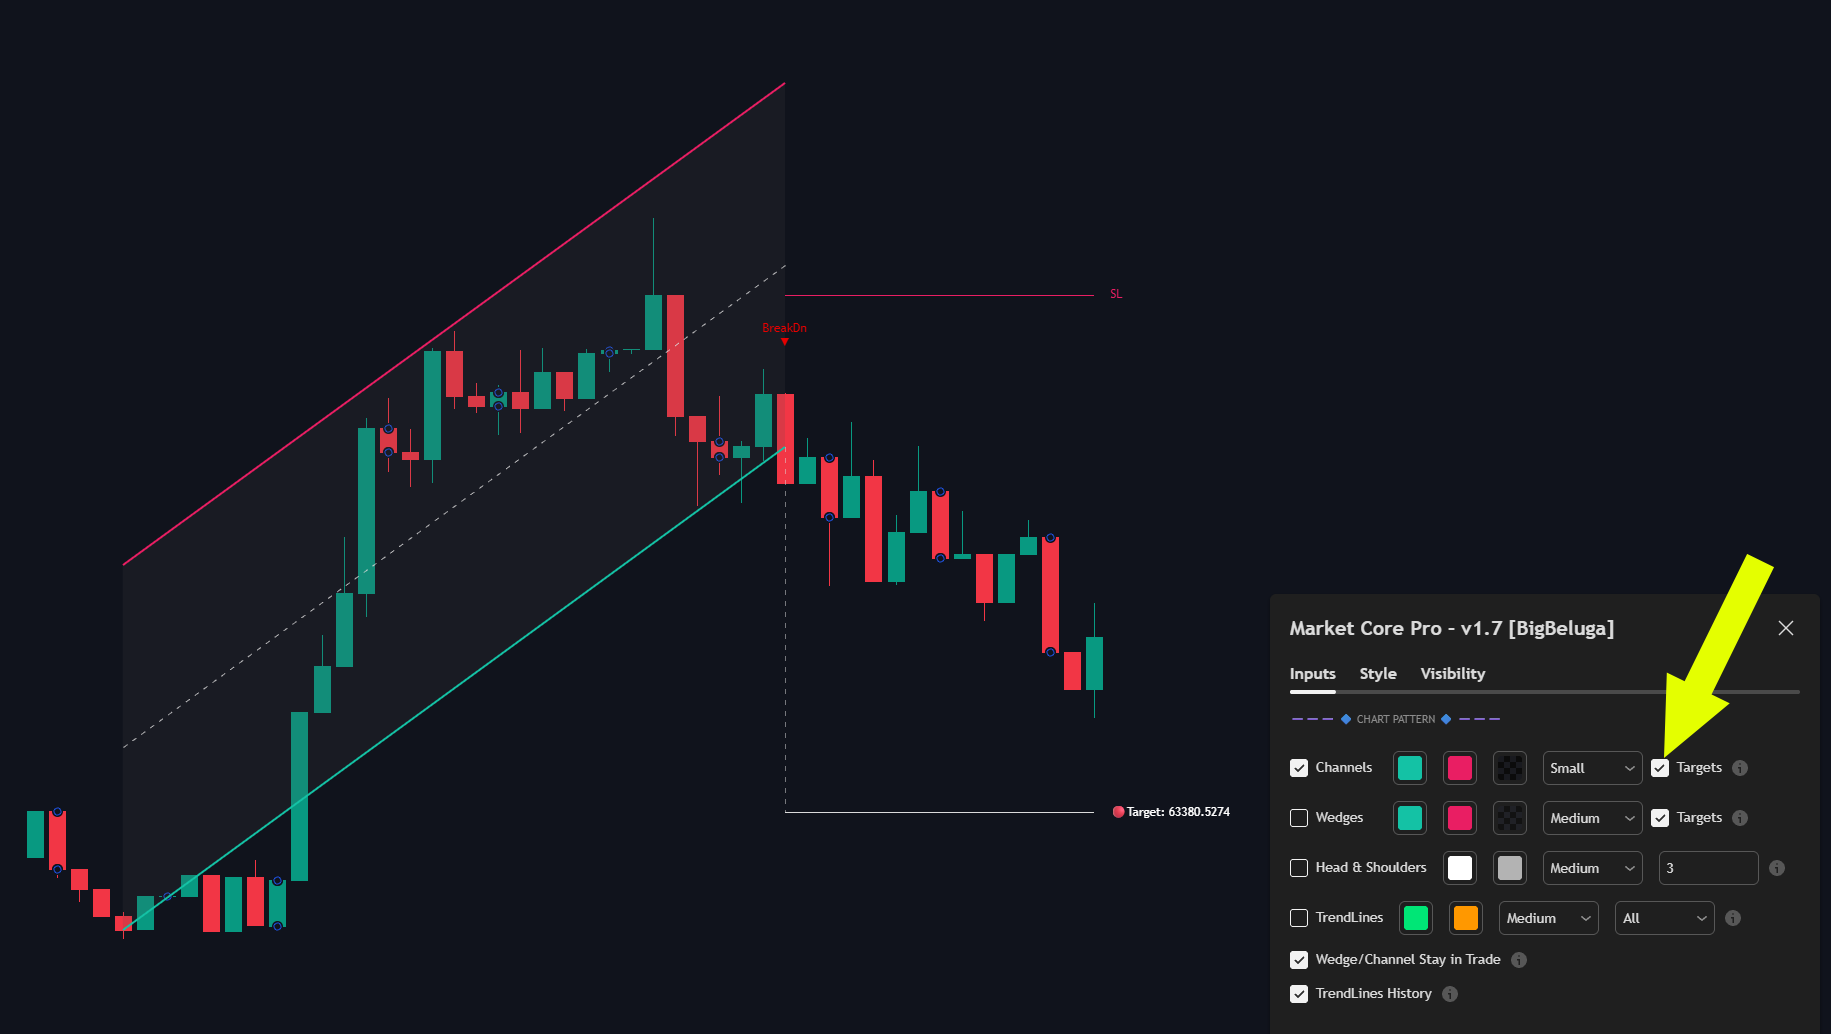
## **Channel** Targets and Stop-Loss (SL)
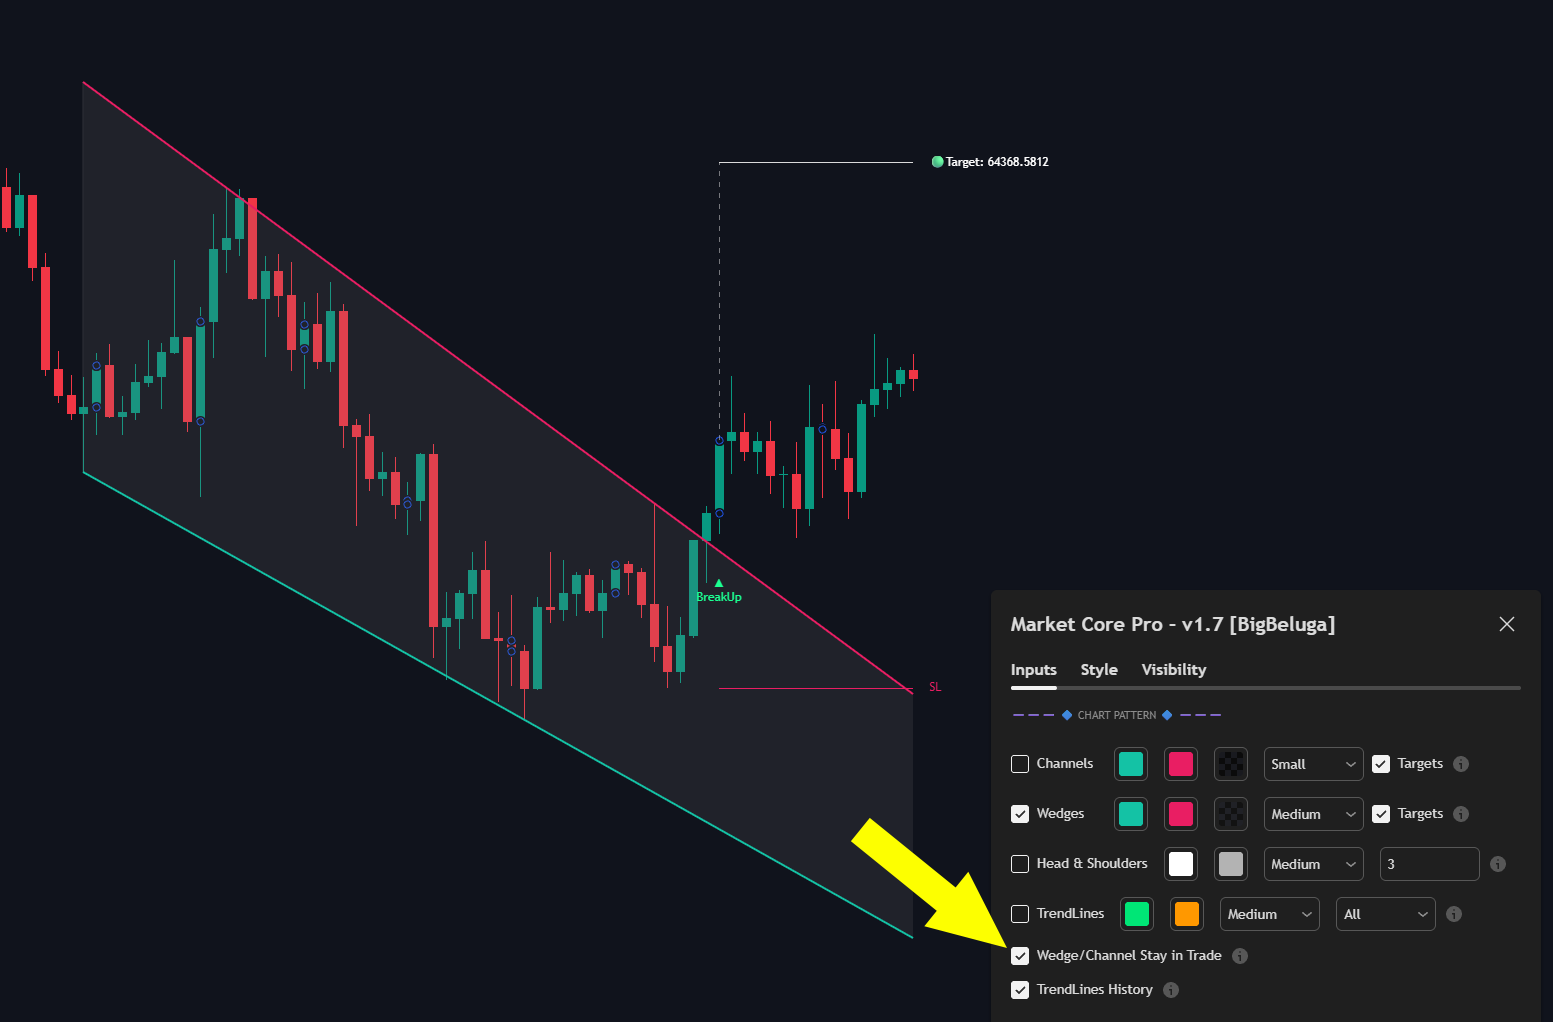
Automatic SL & Targets: When you enable the Targets toggle in the settings, the indicator now displays both the designated target and the calculated Stop Loss (SL) directly on the chart for active channel patterns.
The moment a BreakUp or BreakDn signal is validated at the channel boundary, a vertical measurement line is generated from the breakout point, casting the exact destination directly onto your chart.
## **Wedges**
The **Wedges** feature automatically detects two key chart patterns — **Rising Wedge** and **Falling Wedge** — which are commonly used in technical analysis to anticipate potential price reversals or continuations.
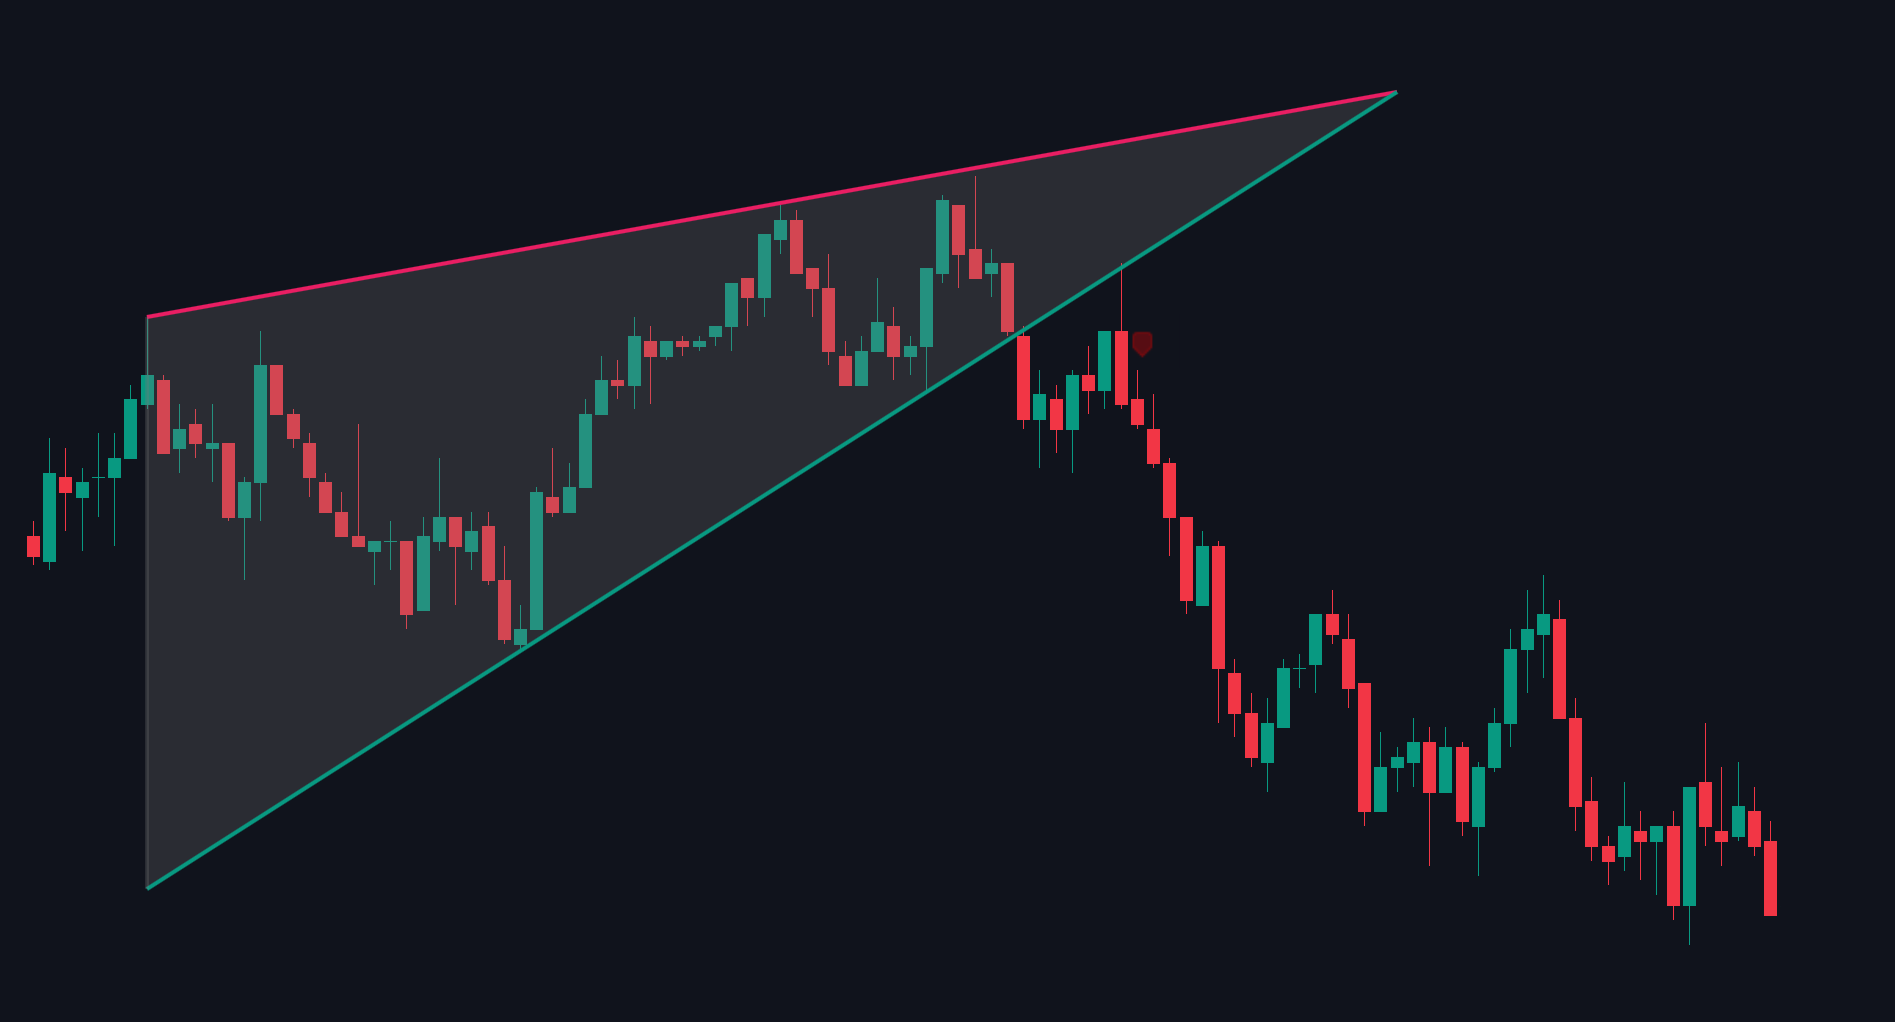
### **Rising Wedge**
This pattern forms when price action is confined within two upward-sloping, converging trend lines.
Rising Wedge
{% hint style="info" %}
It often indicates weakening bullish momentum and is considered a bearish reversal pattern, especially when occurring after an uptrend
{% endhint %}
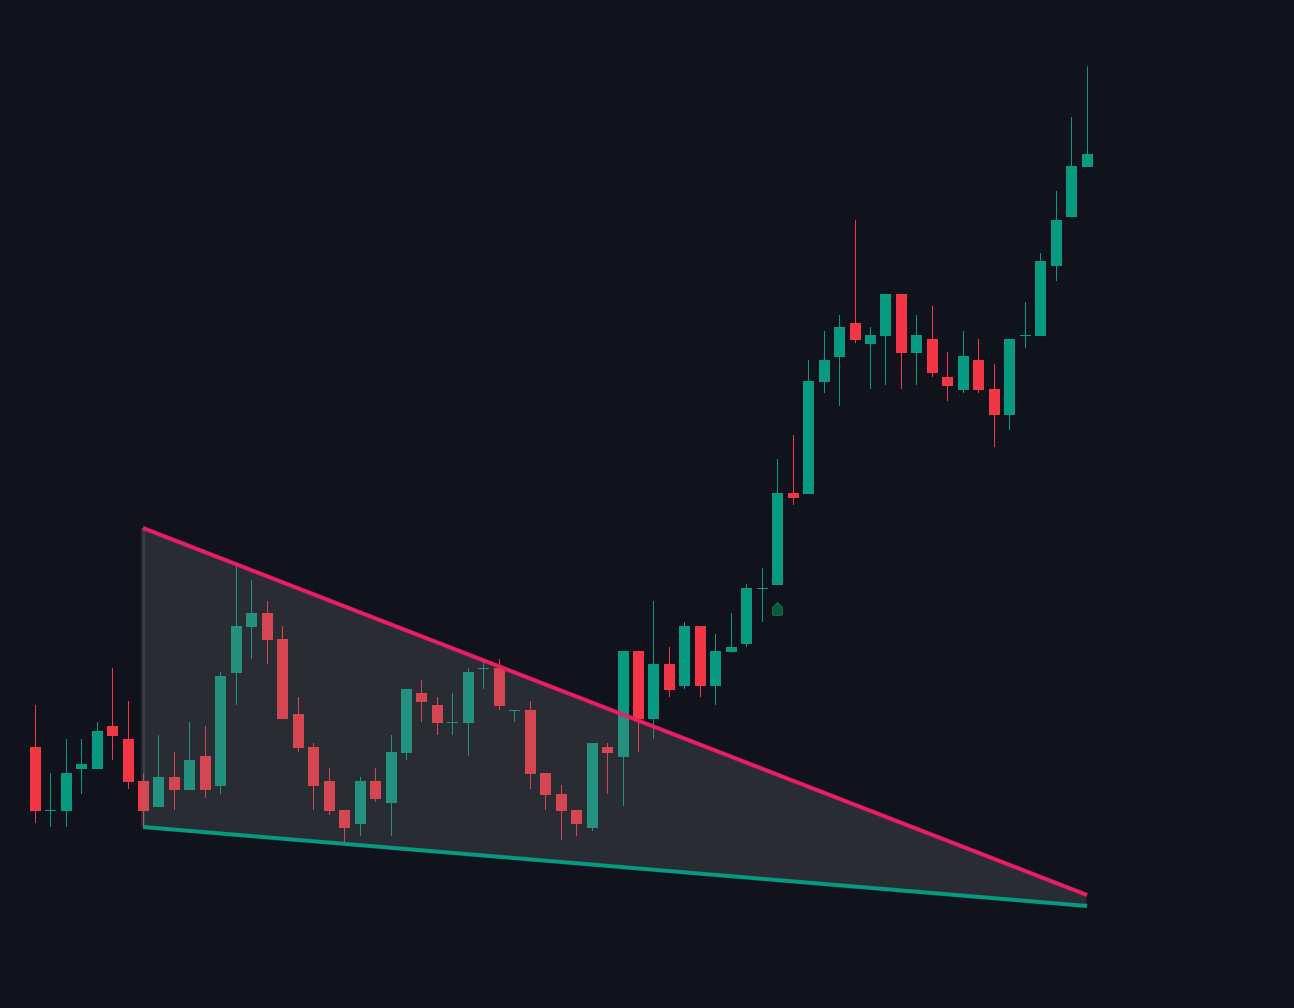
### **Falling Wedge**
Characterized by two downward-sloping, converging trend lines, this pattern suggests a potential bullish reversal, particularly when it appears after a downtrend.
Falling Wedge
{% hint style="info" %}
It reflects diminishing bearish momentum and the possibility of an upward breakout
{% endhint %}
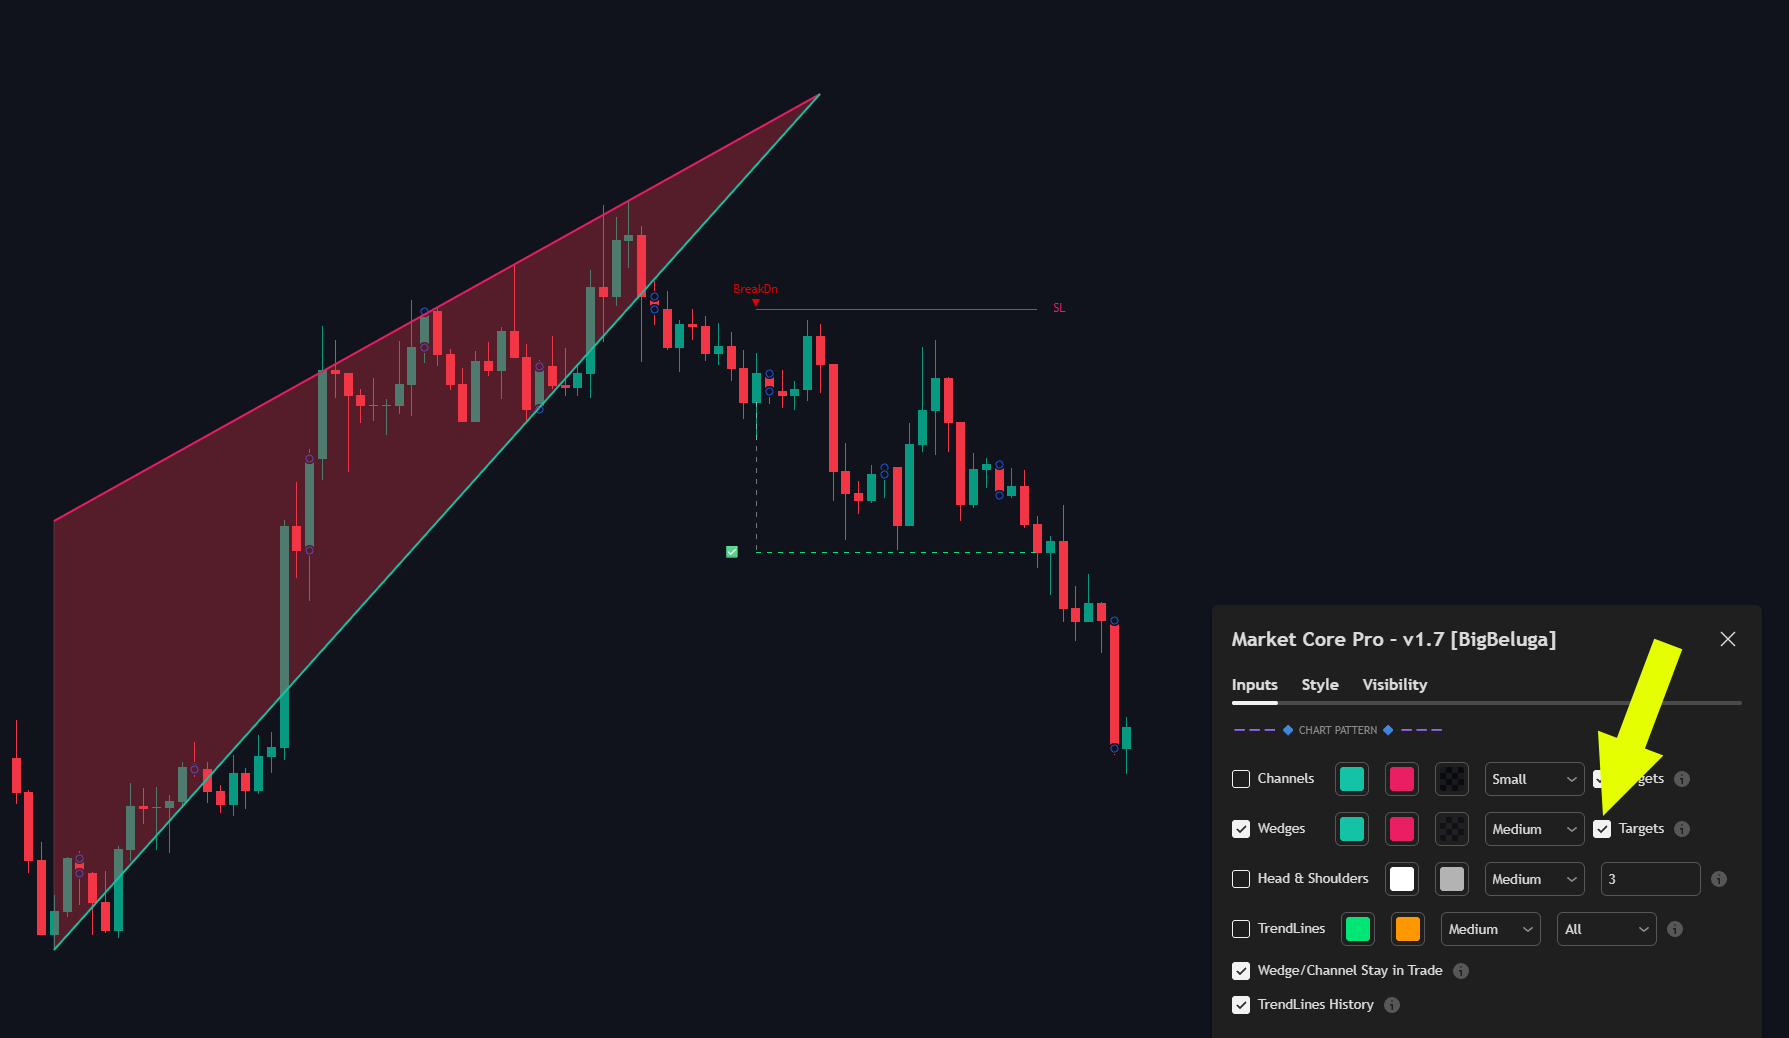
## **Wedges Targets** and Stop-Loss (SL)
Automatic SL & Targets: When you enable the Targets toggle in the settings, the indicator now displays both the designated target and the calculated Stop Loss (SL) directly on the chart for active wedge patterns.
{% hint style="info" %}
Risk Management: This gives you a clear visual breakdown of your potential risk versus reward right out of the box.
{% endhint %}
## "Stay in Trade" Mode
* Prevent Overlapping Signals: The new "Stay in Trade" input helps prevent the indicator from spamming new pattern entries while an active trade is still ongoing.
* How It Works:
* This input becomes active only when the Targets toggle is turned ON.
* When enabled, the toolkit will lock out the creation of any new patterns until your current position's stop loss or target is officially hit.
## Head & Shoulders
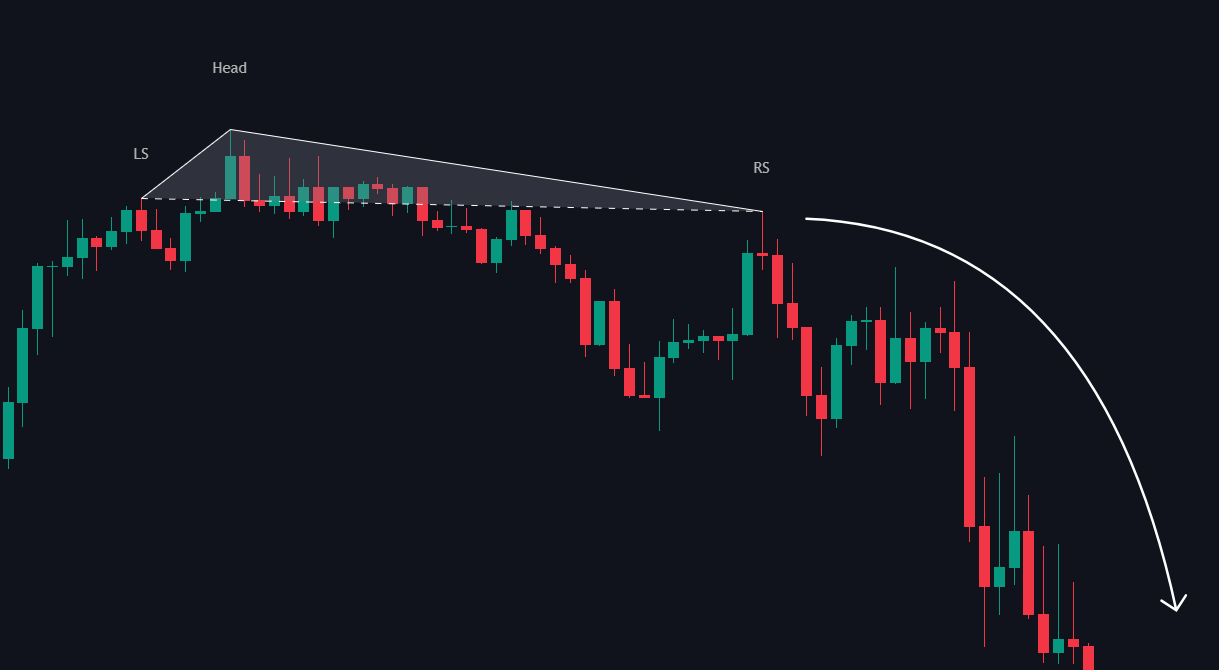
Identifies the **Head and Shoulders** pattern, a **bearish reversal** formation signaling a potential trend change from bullish to bearish.
The pattern consists of three peaks:
* **Left Shoulder (LS)** – A price rise followed by a pullback.
* **Head** – A higher peak forming the highest point of the pattern.
* **Right Shoulder (RS)** – A lower peak, similar to the left shoulder, indicating weakening momentum.
## Trend Lines & Breakout Signals
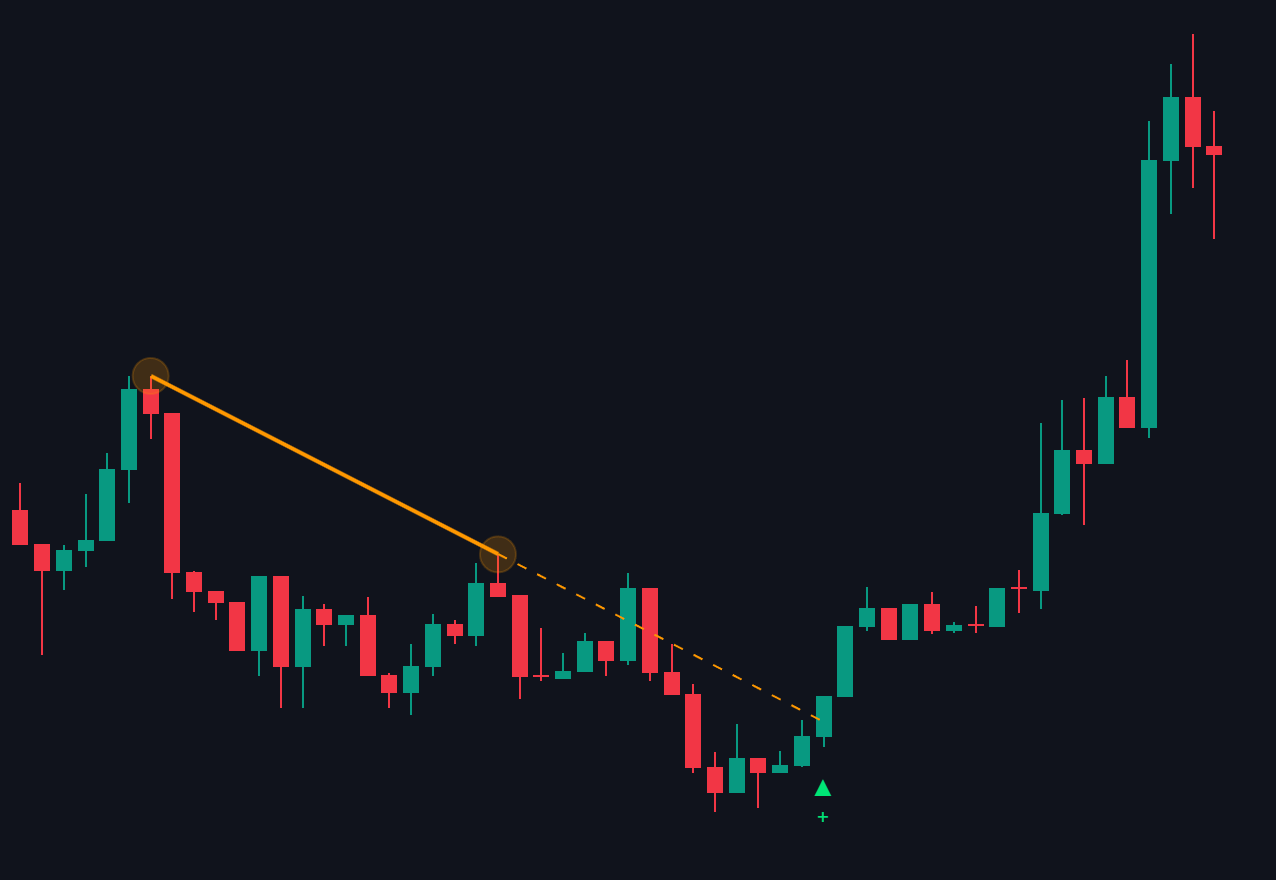
The Trend Lines feature automatically maps critical trend boundaries by connecting major structural highs or lows, delivering real-time breakout signals when the price decisively violates these lines.
#### **How It Works**
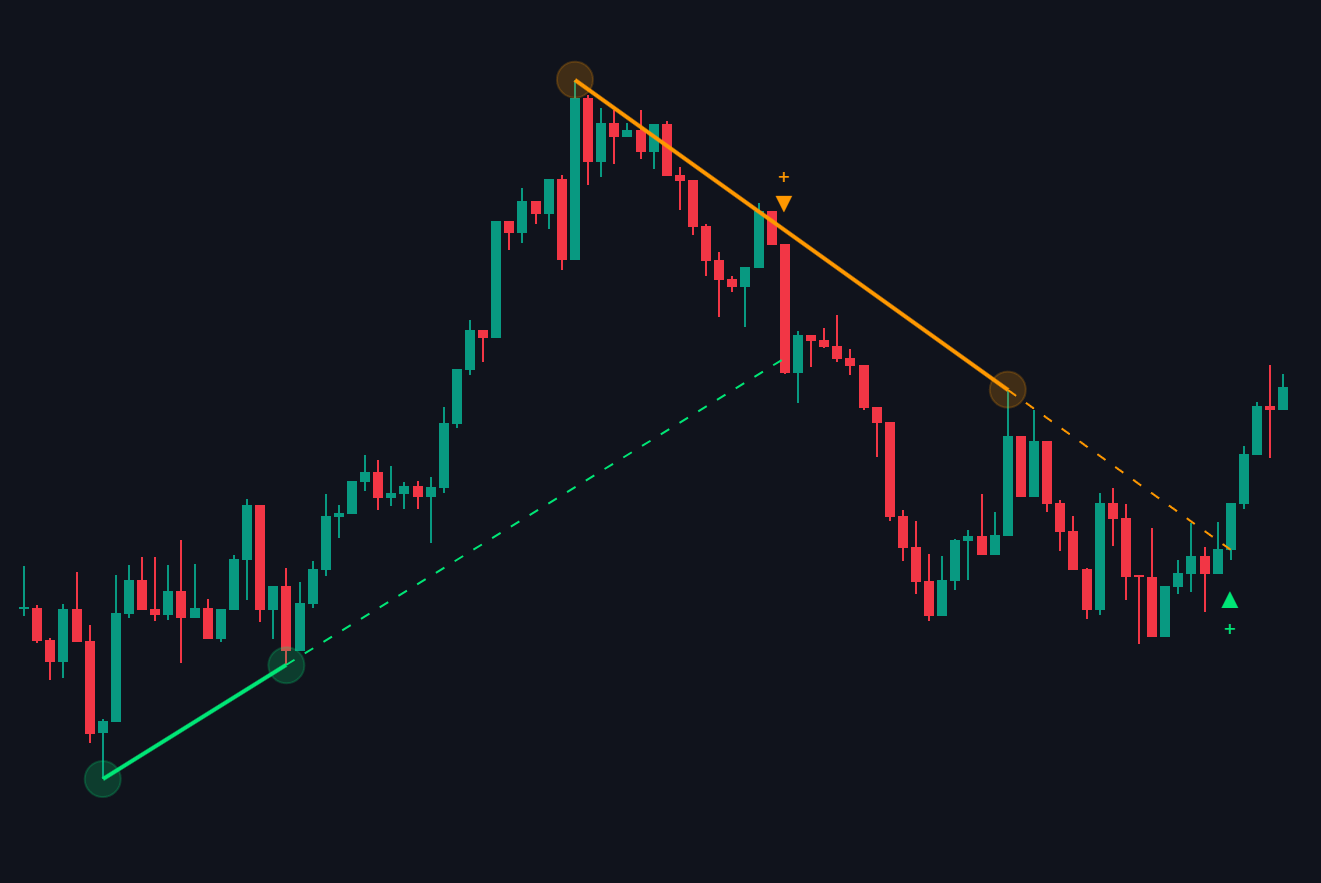
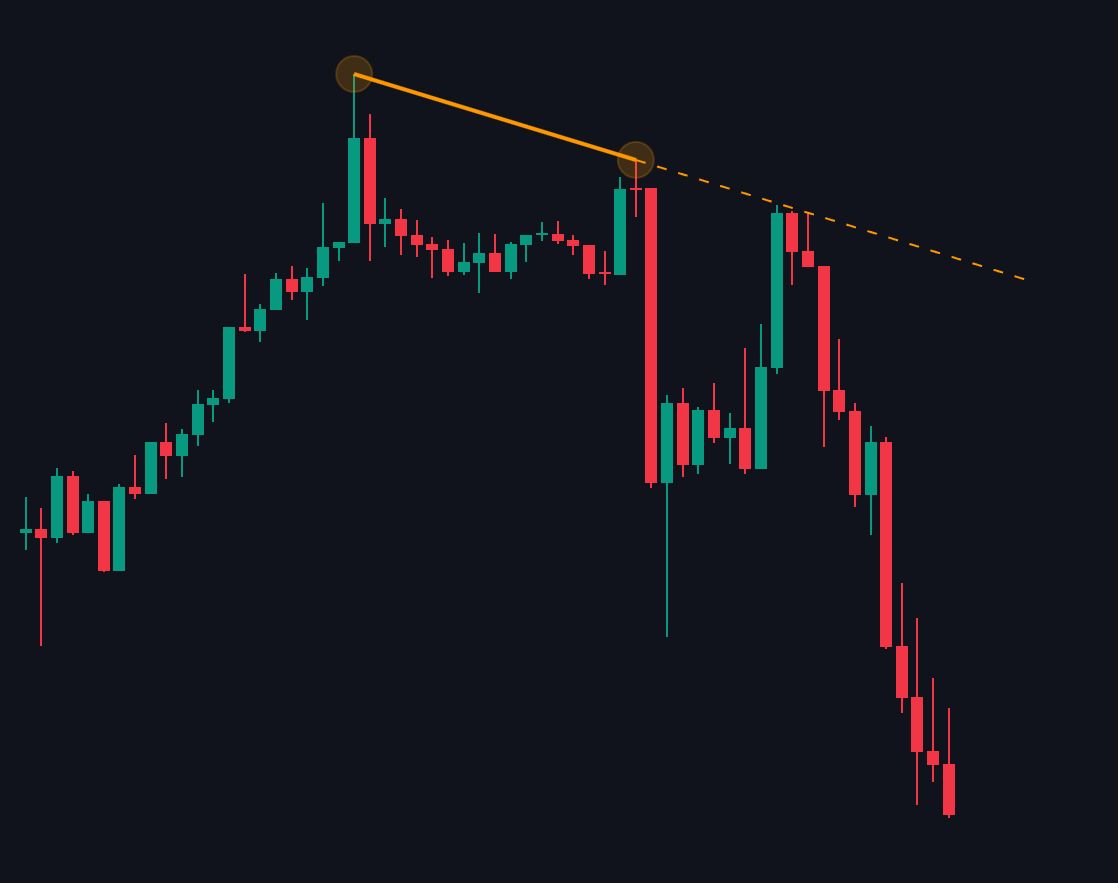
* Solid Trend Lines: The indicator automatically identifies and draws a solid line connecting two or more prominent local highs (resistance trend lines) or local lows (support trend lines).
* Dashed Line Extensions: Once the initial trend line is formed, a dashed line projects forward into space. This serves as a live, tracking extension line that market participants are watching.
* Breakout Triggers: The exact moment price action crosses and breaks past the dashed extension line, a dynamic real-time signal is plotted on your chart.
### **Signal Classification**
The system differentiates between standard and high-momentum breakouts, labeling them based on the volume and velocity of the breaking candle:
| **Signal Label** | **Type** | **Description** |
| -------------------- | --------------------- | ----------------------------------------------------------------------------------------------------------------------- |
| ▲ Break Up | Standard Bullish | Plotted when price closes cleanly above a resistance trend line extension. |
| ▲+ Strong Break Up | High-Momentum Bullish | Plotted with a `+` sign when a breakout occurs with exceptional volume, signaling a highly reliable trend acceleration. |
| ▼ Break Down | Standard Bearish | Plotted when price closes cleanly below a support trend line extension. |
| ▼+ Strong Break Down | High-Momentum Bearish | Plotted with a `+` sign when a breakdown occurs with heavy selling pressure, indicating strong continuation downside. |
##
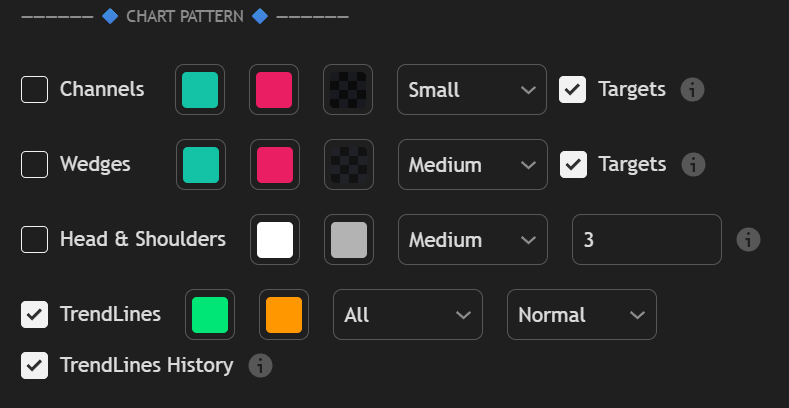
## Settings
| Setting | Color Customization | Display / Filter Dropdown | Additional Options / Targets |
| ---------------- | --------------------------------------- | ----------------------------------------------------------------- | ----------------------------------------------------------------- |
| Channels | Support / Resistance / Background Fill | Select period of calculation Dropdown: `Small` / `Medium` / `Big` | ☑️ Targets (Take Profit Levels) |
| Wedges | Support / Resistance / Background Fill | Select period of calculation Dropdown: `Small` / `Medium` / `Big` | ☑️ Targets (Take Profit Levels) |
| Head & Shoulders | Baseline / Labels Structure | Select period of calculation Dropdown: `Small` / `Medium` / `Big` | Threshold input % (e.g., `3`) |
| TrendLines | Support / Resistance | Dropdown: `All` / `Support` / `Resistance` | Select period of calculation Dropdown: `Small` / `Medium` / `Big` |