> For the complete documentation index, see [llms.txt](https://docs.bigbeluga.org/llms.txt). Markdown versions of documentation pages are available by appending `.md` to page URLs; this page is available as [Markdown](https://docs.bigbeluga.org/ai-extension-sonar-tm/liquidation-events.md).
# Liquidation Events
**The Liquidation Events panel** streams real-time forced position closures from major crypto derivatives exchanges directly into your [TradingView](https://www.tradingview.com/) workspace. It helps you spot liquidation cascades, squeeze conditions, and liquidity sweeps without leaving the chart.
### How to Access
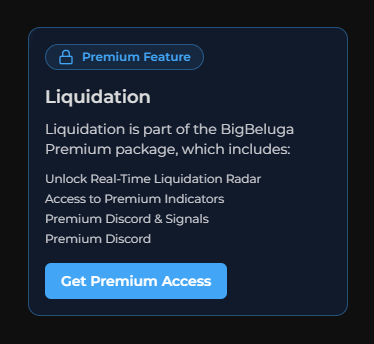
The Liquidation Events panel is a **premium feature**.
{% hint style="success" %}
If you already have a subscription to any of our **Premium Indicators**, this panel will automatically unlock for you
{% endhint %}
* If not, you’ll need to subscribe to **any of our** [**three premium plans**](https://bigbeluga.org/#pricing) to enable it.
Click the **“****Get Premium Access****”** button. It will redirect you to the [BigBeluga subscription page](https://bigbeluga.org/#pricing) where you can choose a plan.
To open the panel:
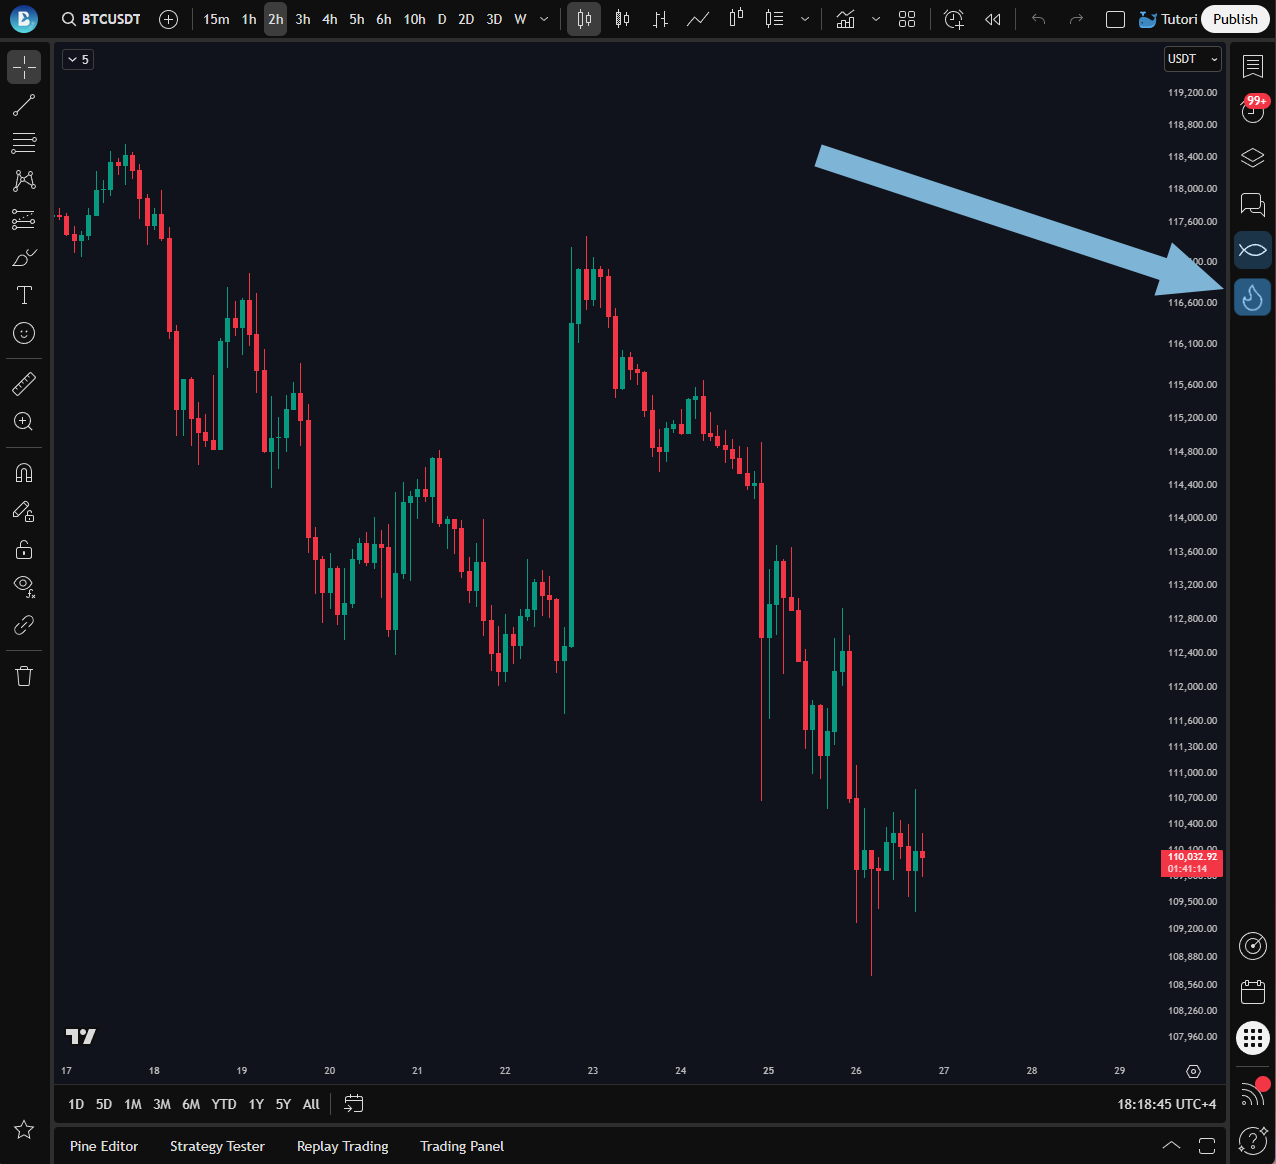
1. Click the **Sonar** icon on the right sidebar of your [TradingView ](https://www.tradingview.com/)chart.
### Table Columns & Data
{% stepper %}
{% step %}
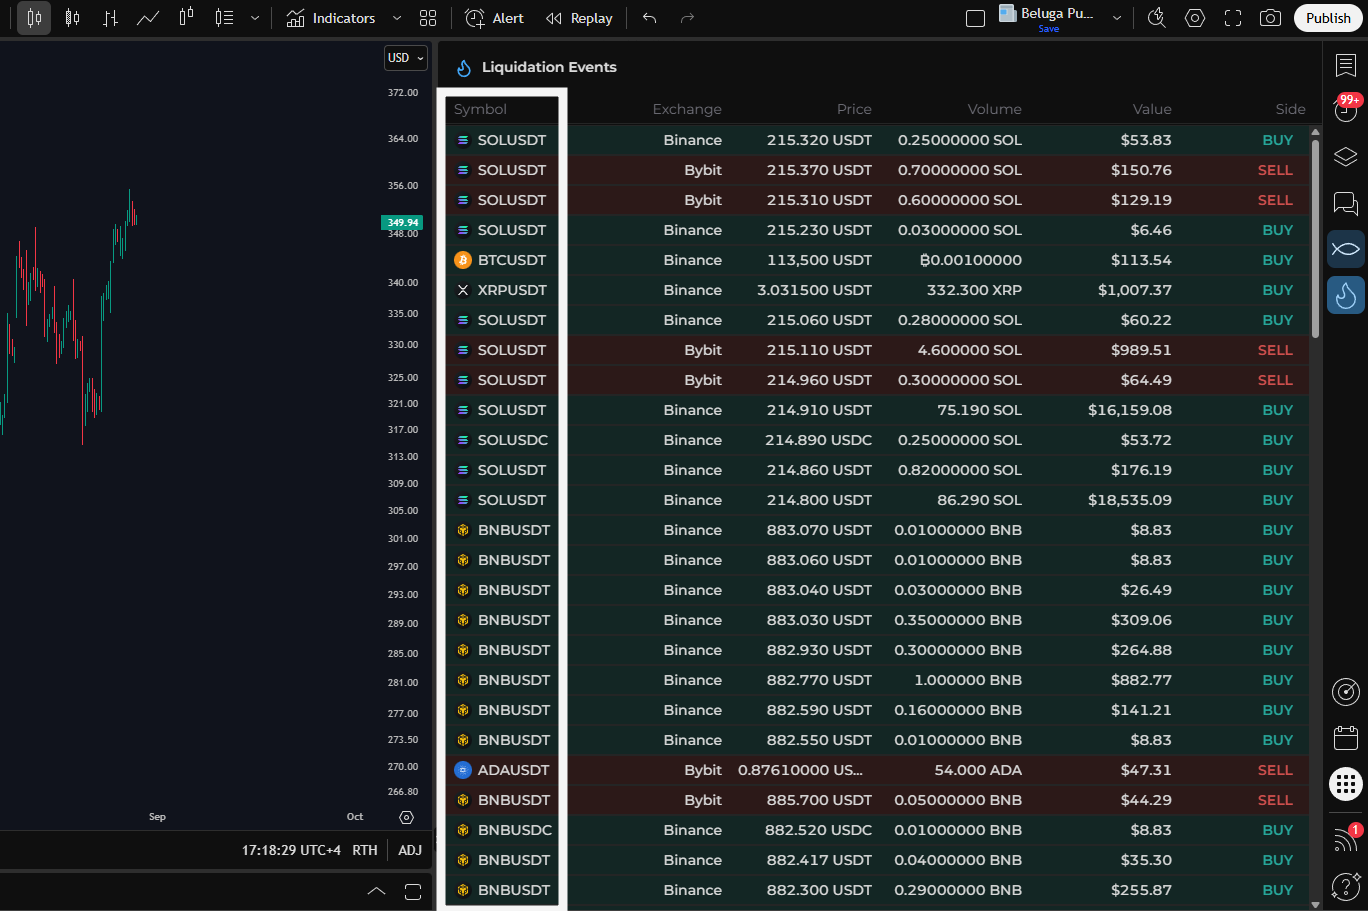
#### **Symbol** – The futures pair where the liquidation occurred (e.g., BTCUSDT, ETHUSDT).
{% endstep %}
{% step %}
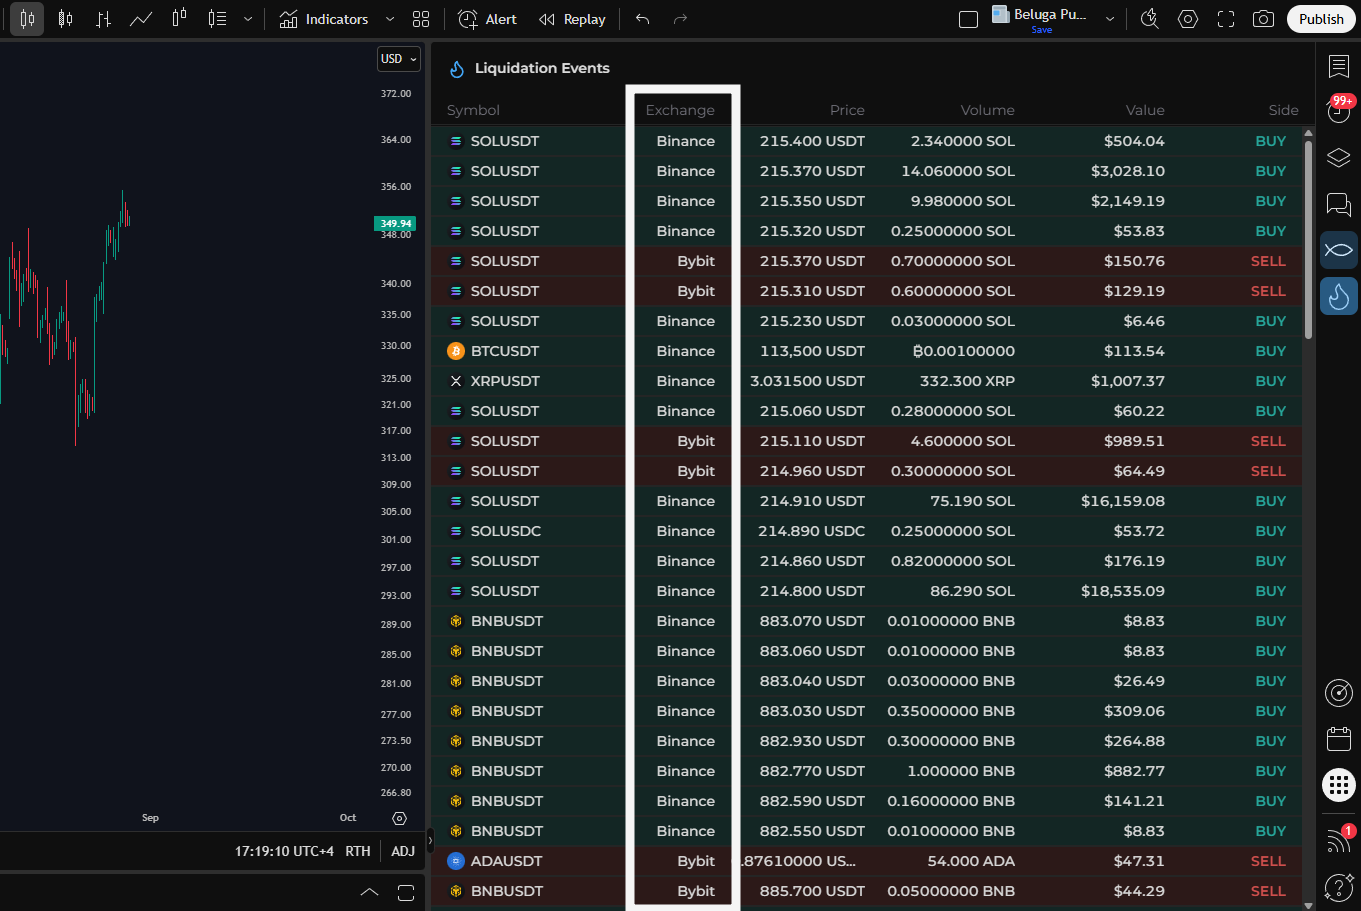
#### **Exchange** – Source venue reporting the event (e.g., Bybit, Binance, OKX).
{% endstep %}
{% step %}
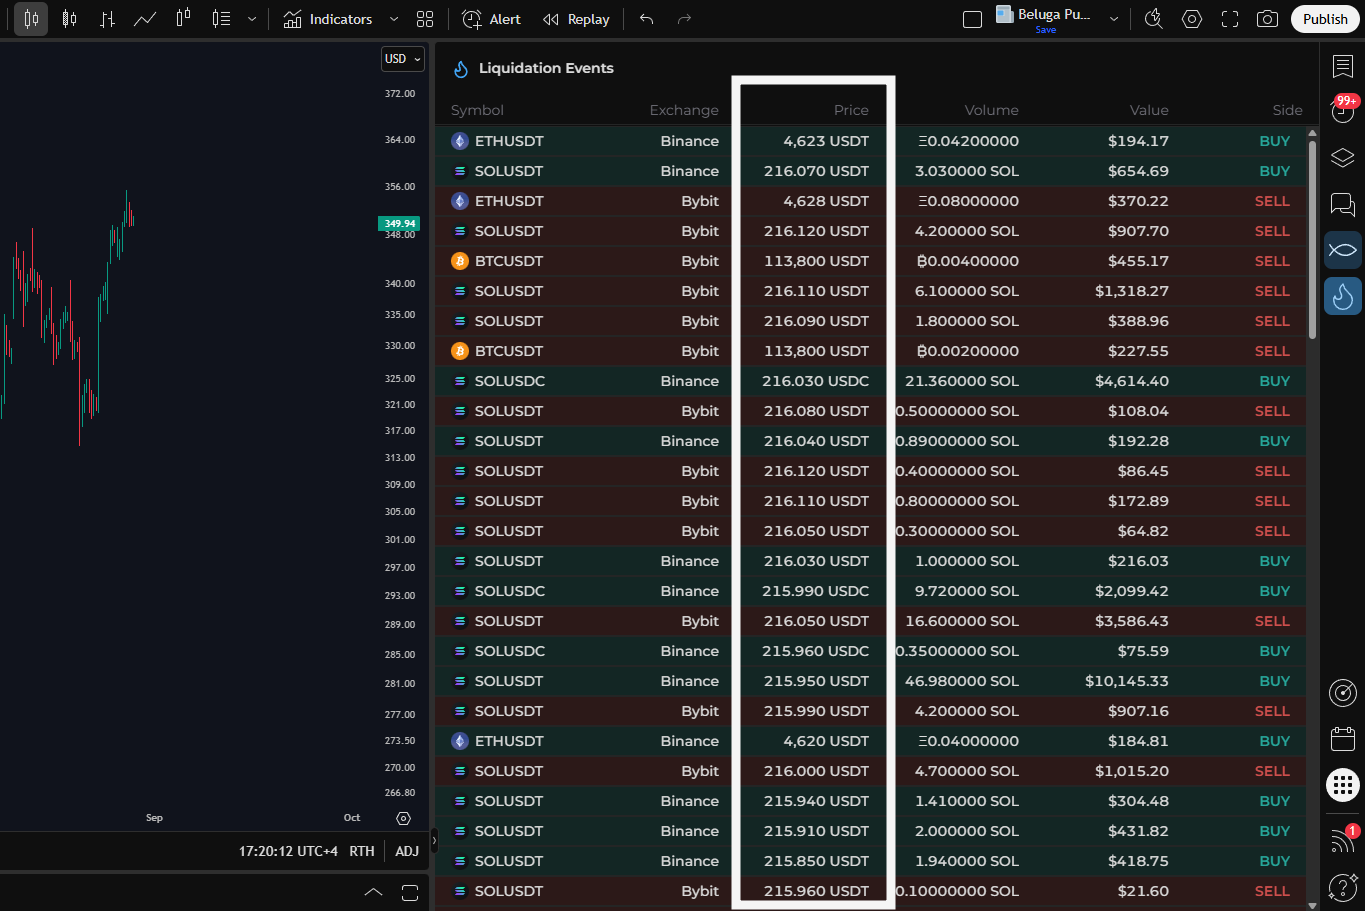
#### **Price** – Execution price of the liquidation order at the moment it was closed.
{% endstep %}
{% step %}
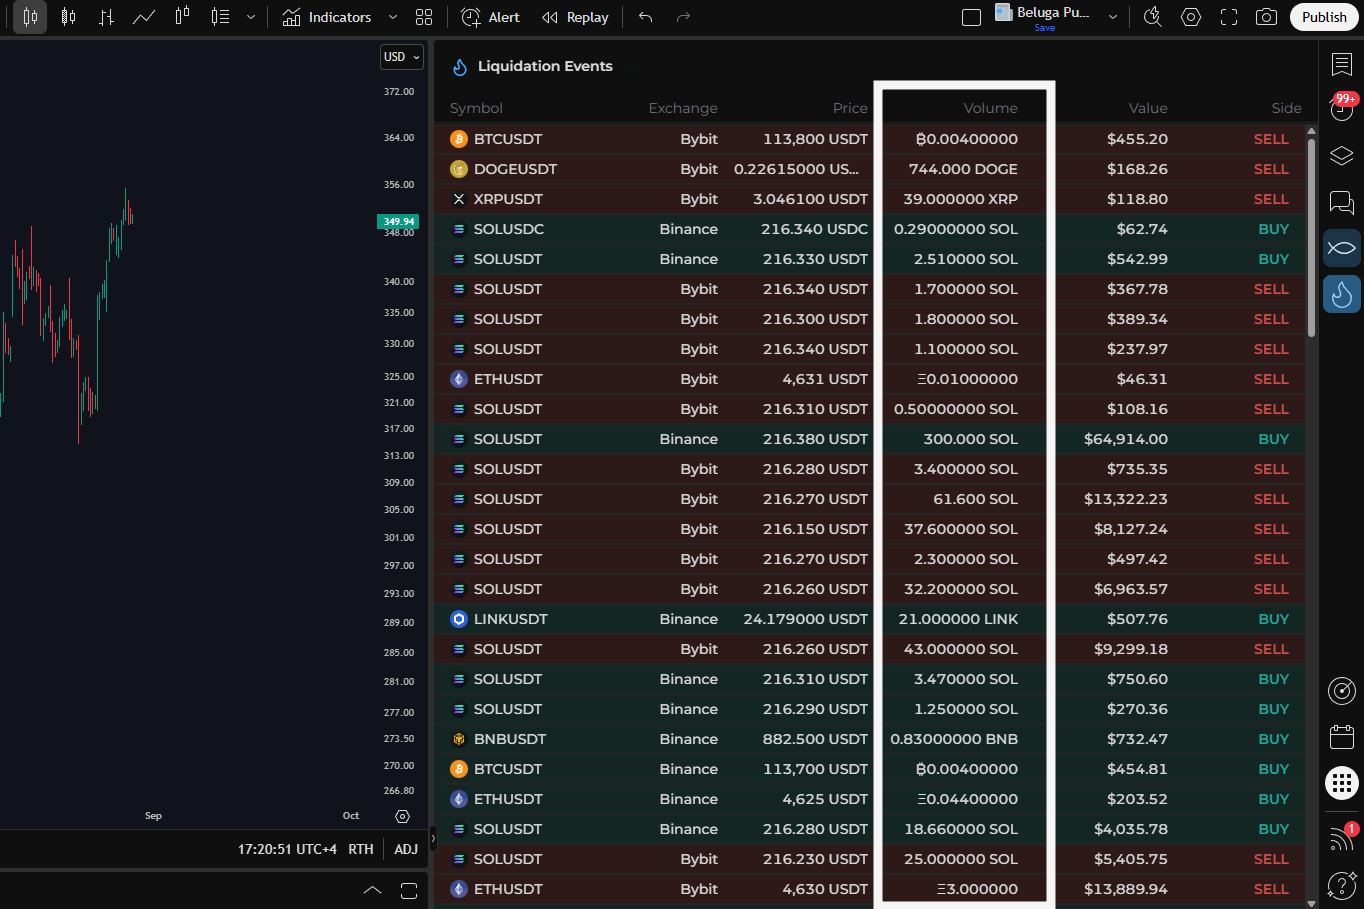
#### **Volume** – Quantity liquidated (coin amount as reported by the exchange).
{% endstep %}
{% step %}
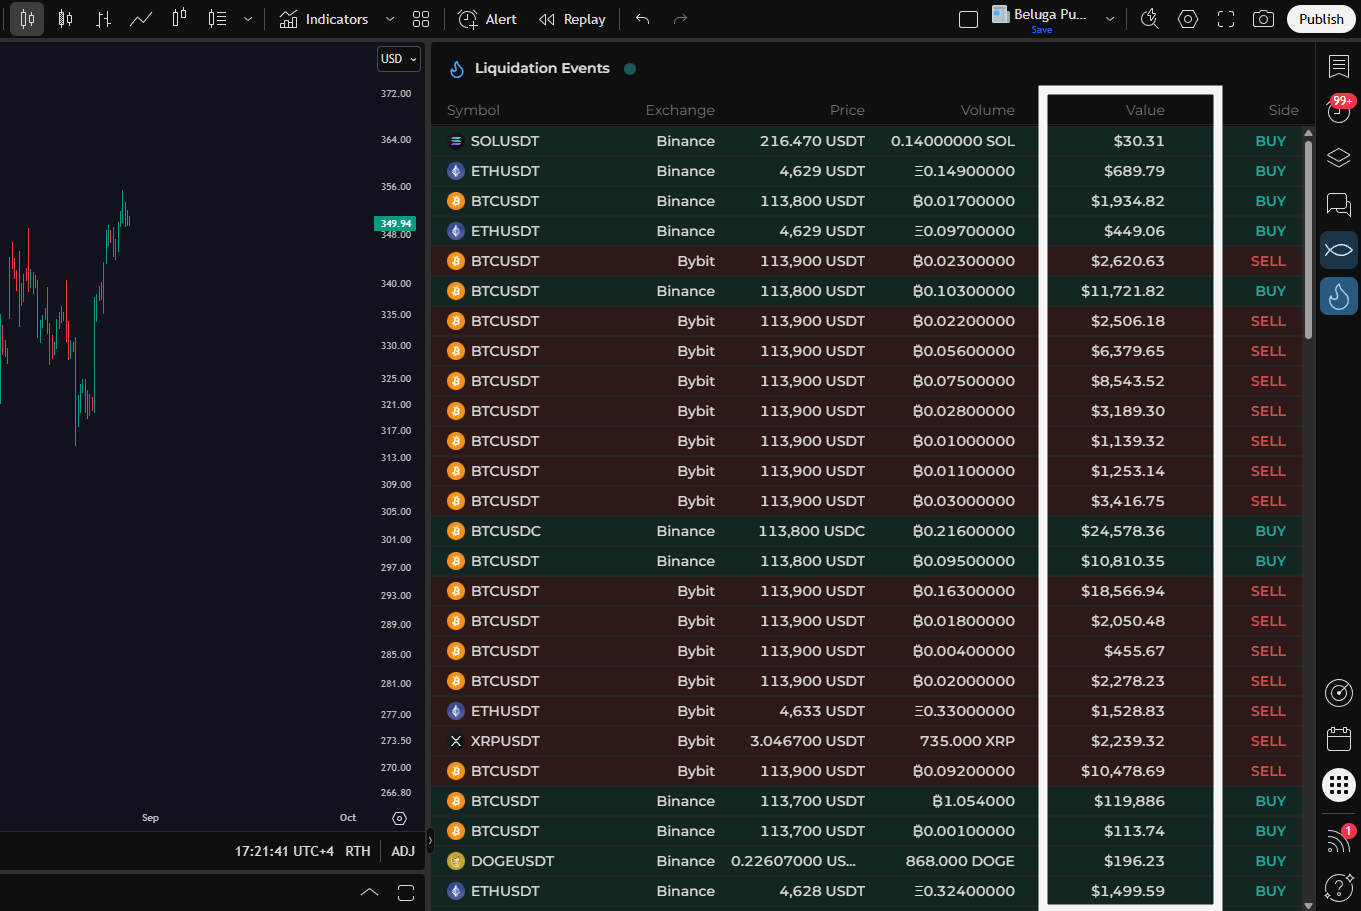
#### **Value** – Notional value of the liquidation, shown in USDT.
{% endstep %}
{% step %}
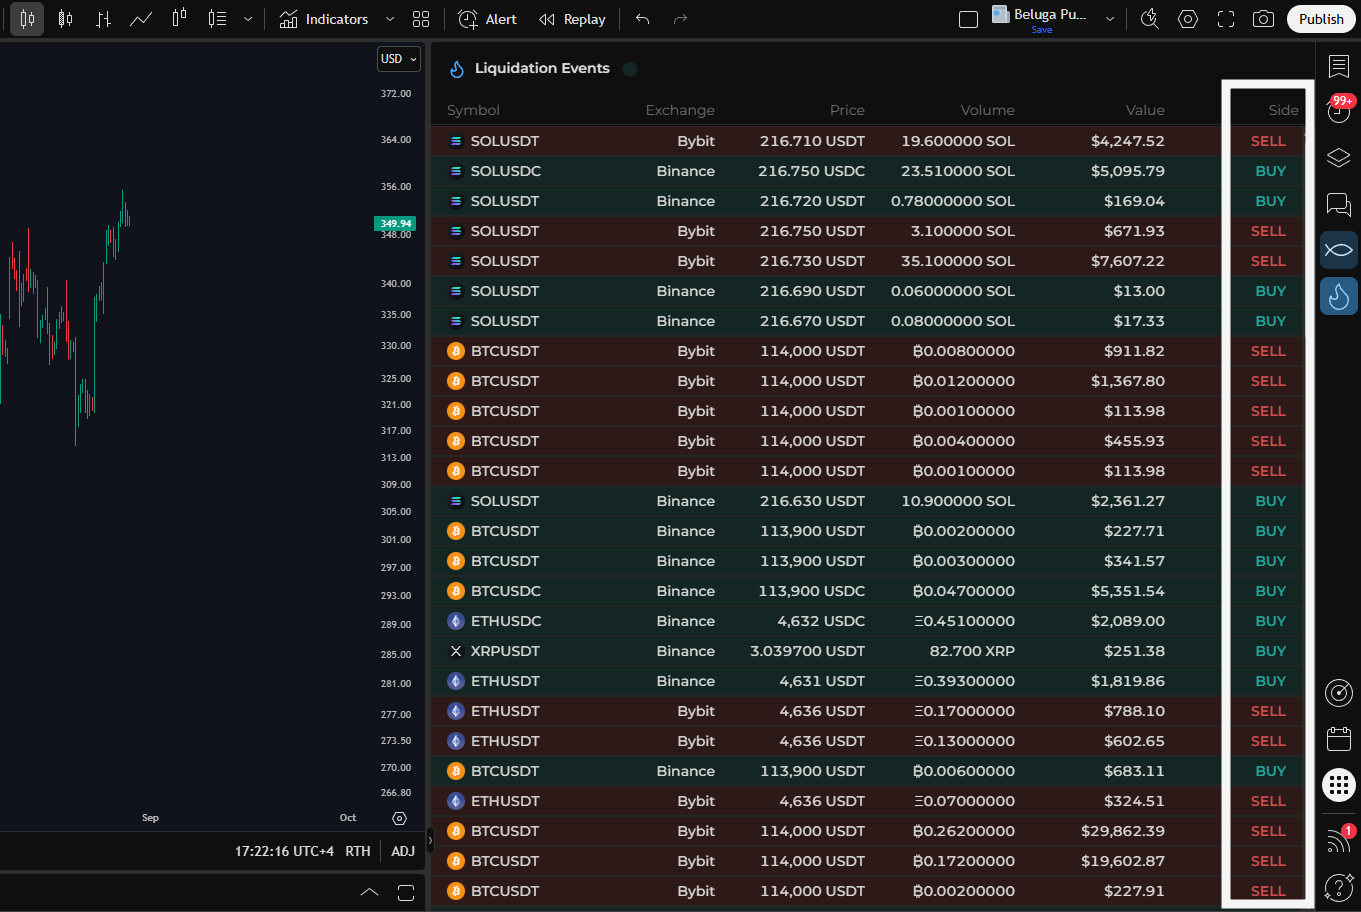
#### **Side** – Direction of the forced close:
* **SELL** = short positions liquidated (down-move flushes).
* **BUY** = long positions liquidated (up-move squeezes).
{% endstep %}
{% endstepper %}
***
### Live Data Feed
The table updates continuously as exchanges publish new liquidation prints, allowing you to:
> * See **bursts** of clustered liquidations during volatile moves.
> * Track **momentum continuation** after a cascade begins.
> * Gauge whether pressure is **one-sided** (mostly BUY or SELL liquidations) or mixed.
### Use Cases
> * **Identify squeezes & cascades**: Rapid sequences of BUY (short) or SELL (long) liquidations often precede extension or exhaustion.
> * **Confirm liquidity sweeps**: Spikes in liquidations near key levels validate that stops were triggered.
> * **Add confluence to entries/exits**: Align prints with order-flow tools, OB levels, or trend signals.
> * **Risk awareness**: Stand aside (or tighten risk) when the tape shows accelerating liquidation clusters.