> For the complete documentation index, see [llms.txt](https://docs.bigbeluga.org/llms.txt). Markdown versions of documentation pages are available by appending `.md` to page URLs; this page is available as [Markdown](https://docs.bigbeluga.org/ai-extension-sonar-tm/home/order-book.md).
# Order Book
The Order Book tool inside BigBeluga Sonar brings centralized exchange market depth data directly onto your chart view, giving traders a clear understanding of where real buy and sell pressure exists.
{% embed url="" %}
***
## **What it shows**
### Heatmap Depth Chart
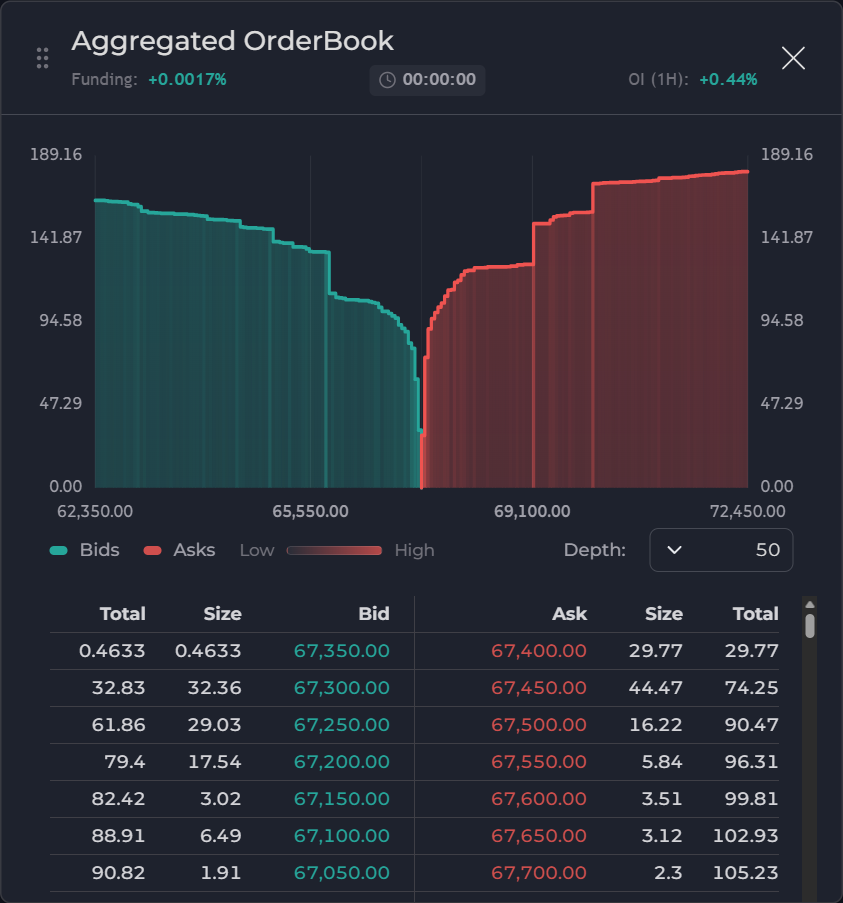
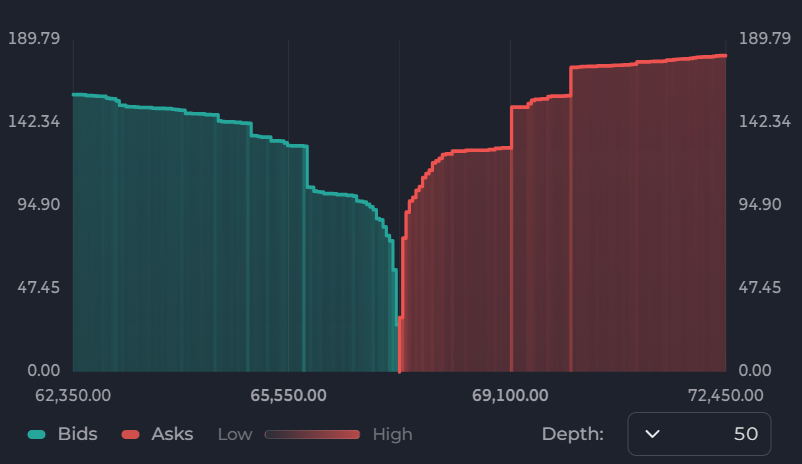
The central histogram visualizes the "walls" in the market:
* Bids (Green) & Asks (Red): Represents the cumulative buy and sell orders.
* Heatmap Intensity: The brightness/saturation of the bars indicates liquidity concentration. Brighter areas represent massive order blocks (walls) that price is likely to react to.
* Depth Toggle: Adjust the granularity of the book (e.g., Depth 5 to 50) to see near-price liquidity or major macro walls.
Use the dropdown to:
> * Adjust how many levels of bids and asks are shown.
> * Get a broader or more focused view of the market liquidity.
> * Easily analyze order flow at different depths.
Perfect for scalpers, intraday traders, and anyone who wants more control over how they visualize market pressure.
### Advanced Market Header
The top bar provides essential context for the current asset’s global state:
* Funding Rate: Displays the current aggregated funding rate.
* Green: Positive funding (Longs pay Shorts).
* Red: Negative funding (Shorts pay Longs).
* Funding Countdown: A live timer showing exactly when the next funding settlement will occur (HH:MM:SS).
* Open Interest (1H): Shows the percentage change in Open Interest over the last hour. This helps confirm if a price move is backed by new capital entering the market.
### **Volume Table**
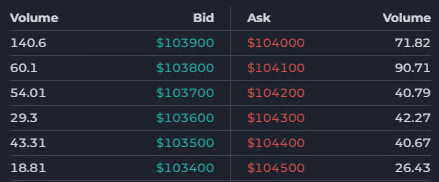
A detailed breakdown of individual price levels showing exact bid, ask, and volume figures.
***
## **How it helps**
> * Spot large buy/sell walls and hidden liquidity areas that might stop or trigger price movements.
> * Time entries and exits around thin areas in the book where price could move quickly.
> * Detect spoofing behavior or sudden shifts in liquidity.
### **Use case example**
You're watching a coin near resistance, and the order book shows a large cluster of sell orders just above current price. This could suggest limited upside unless that wall is broken, giving you a reason to wait for confirmation before going long.